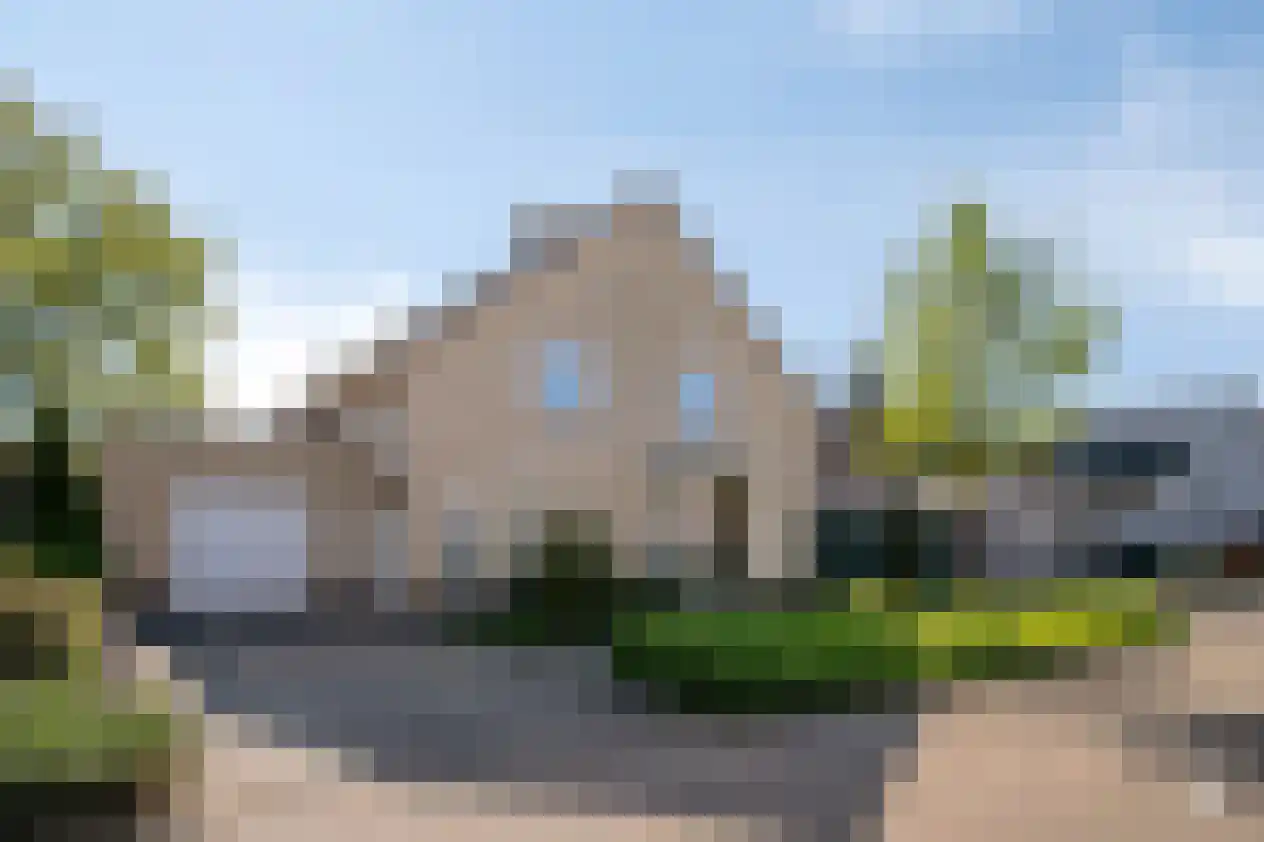
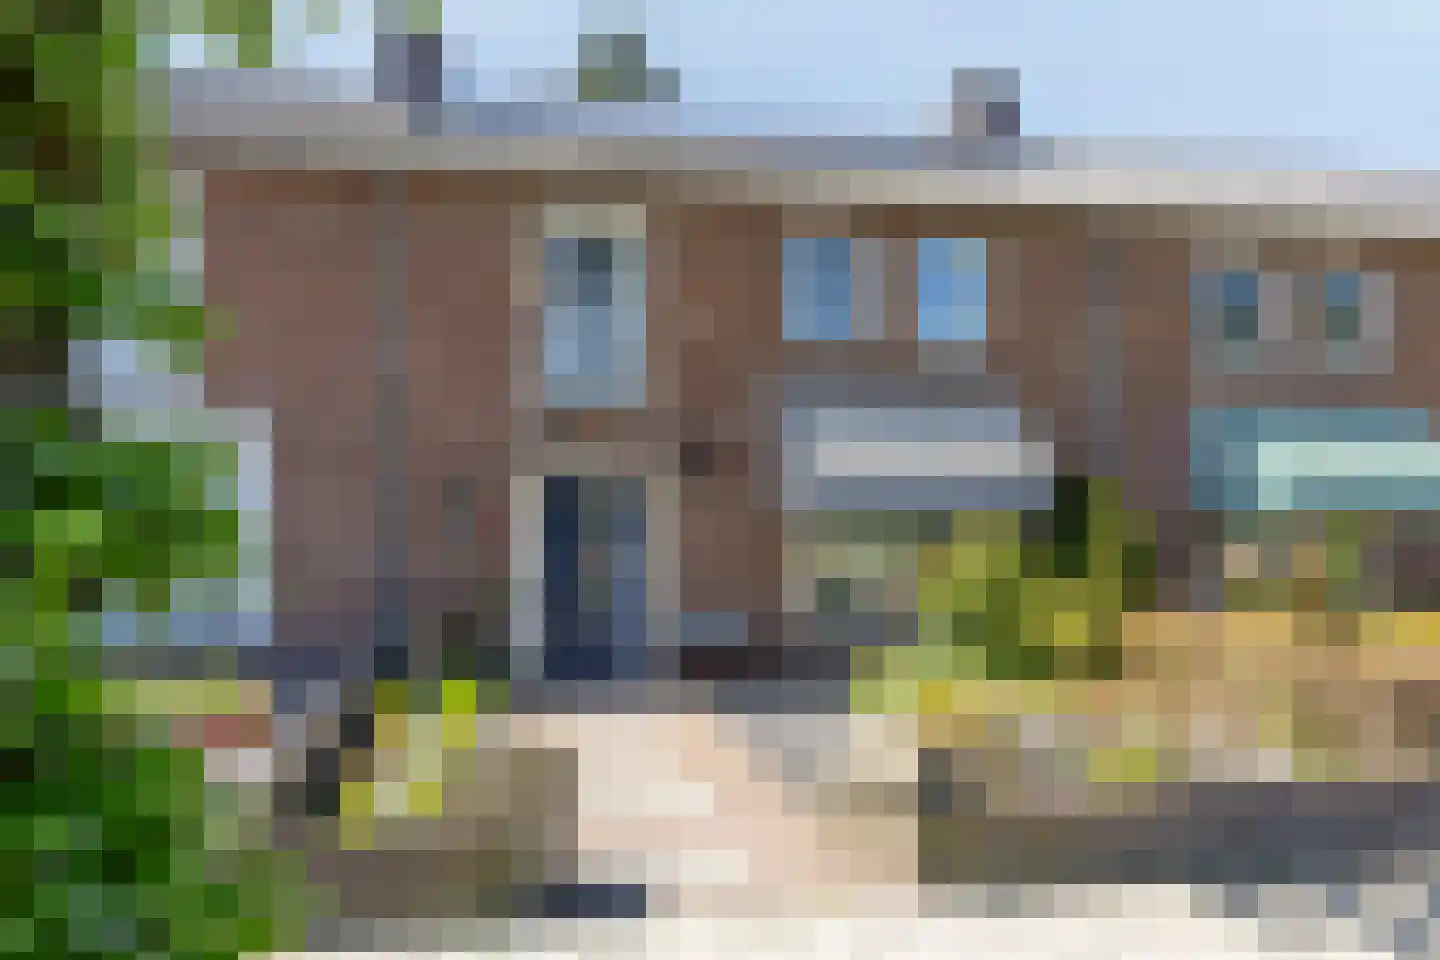
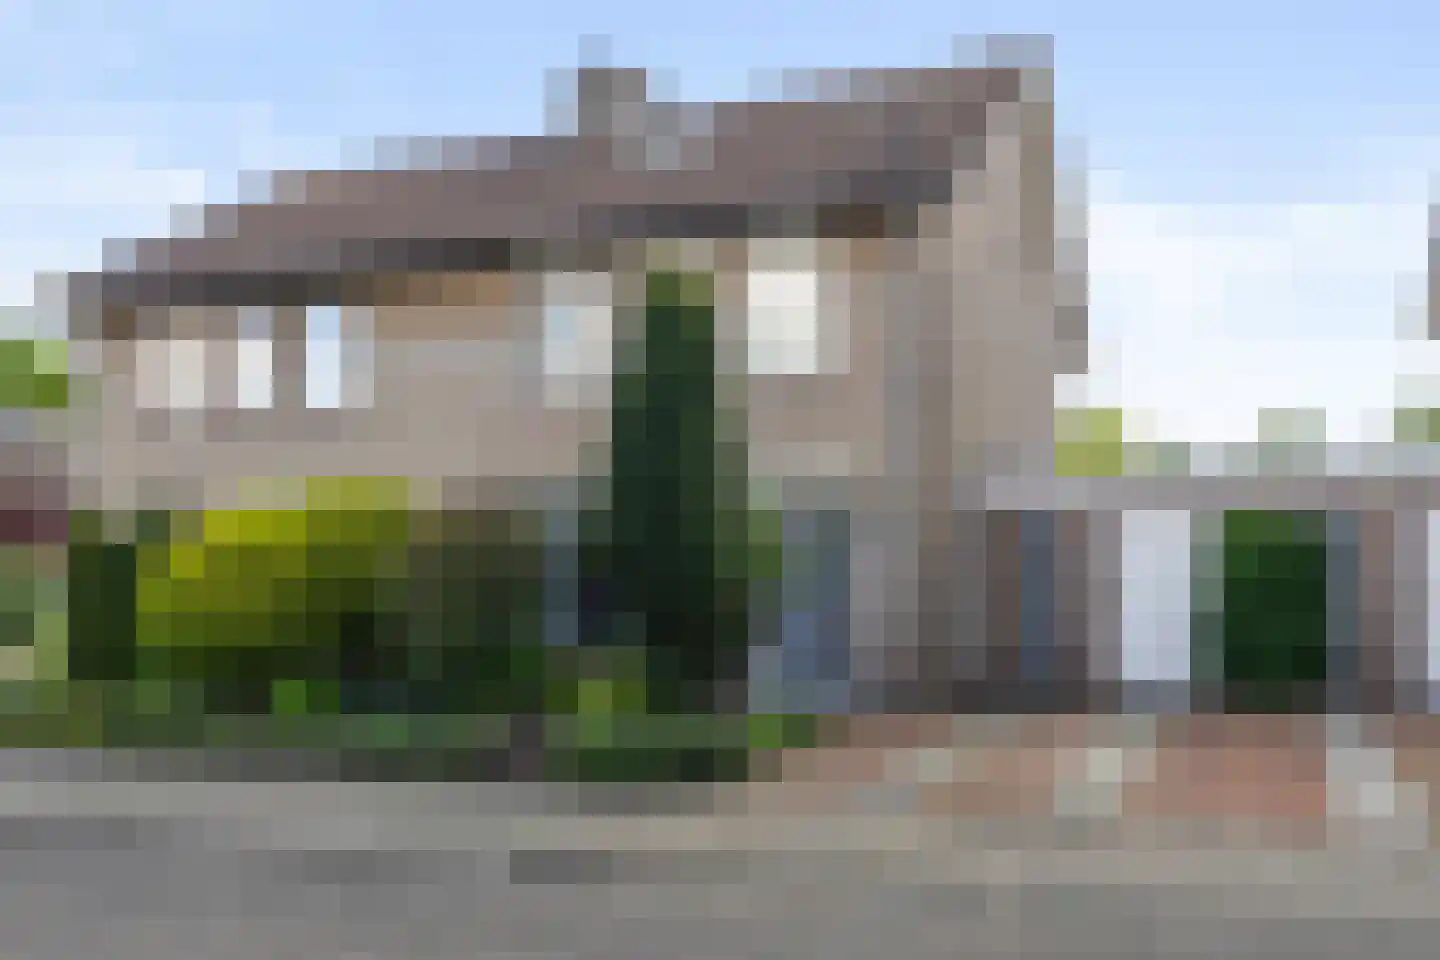
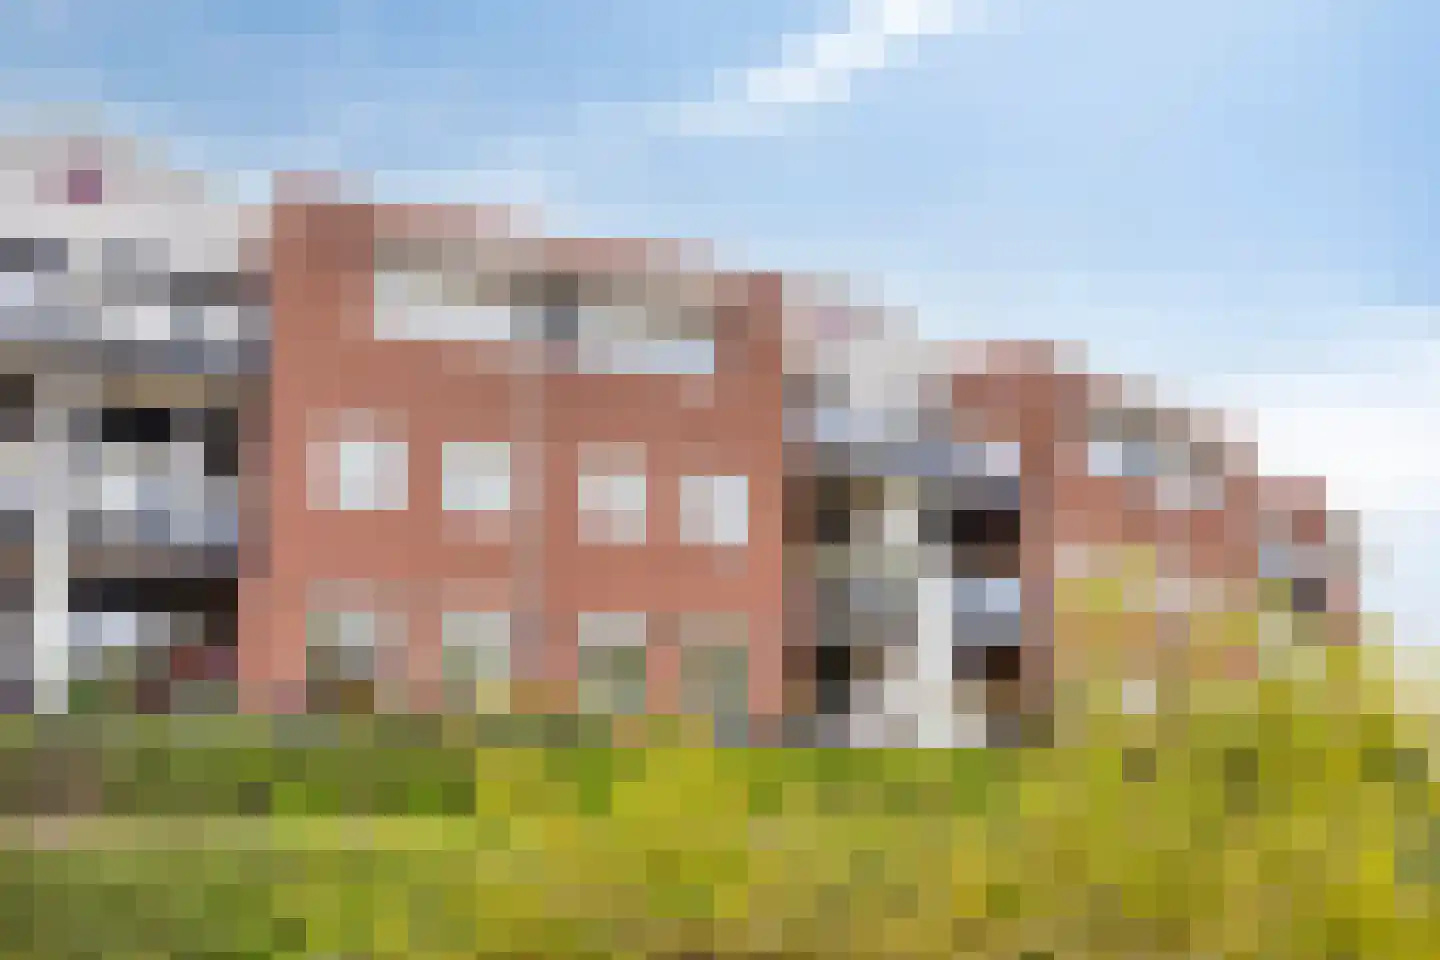
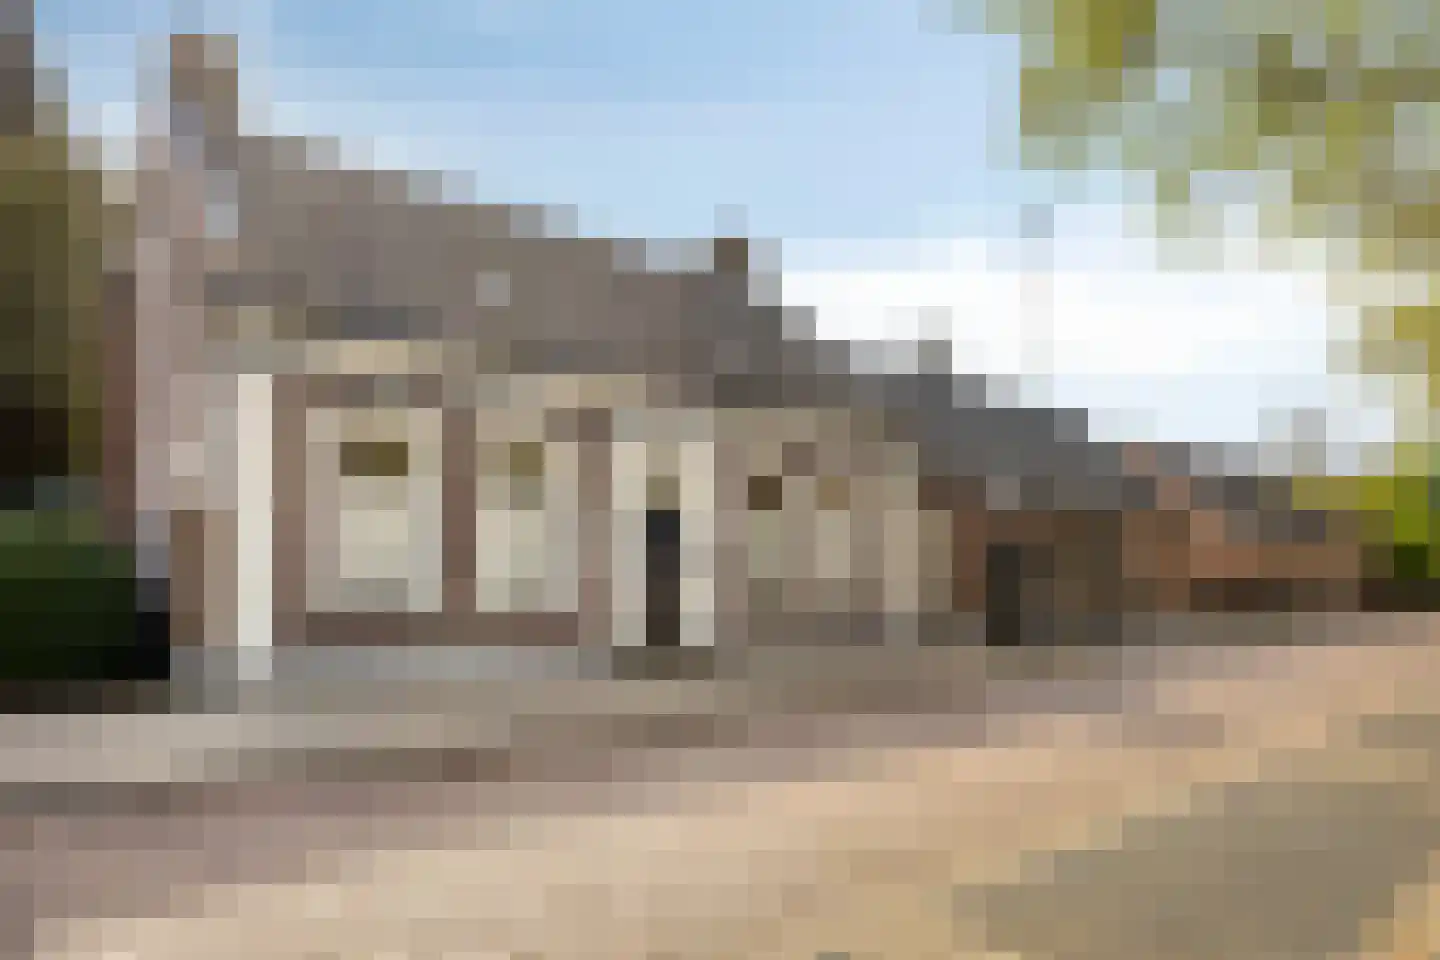
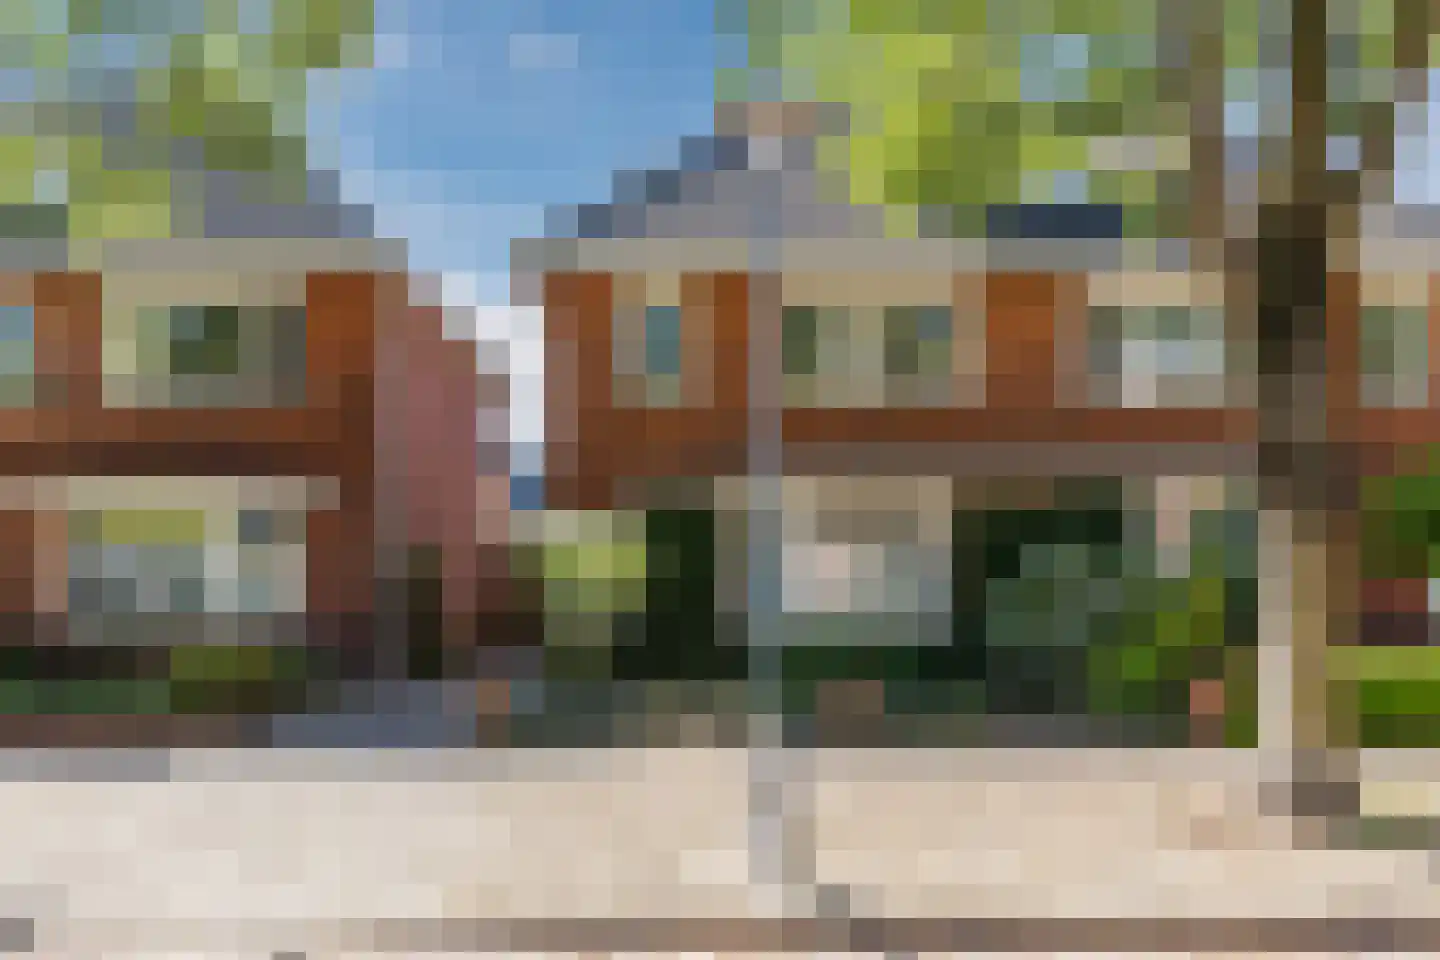
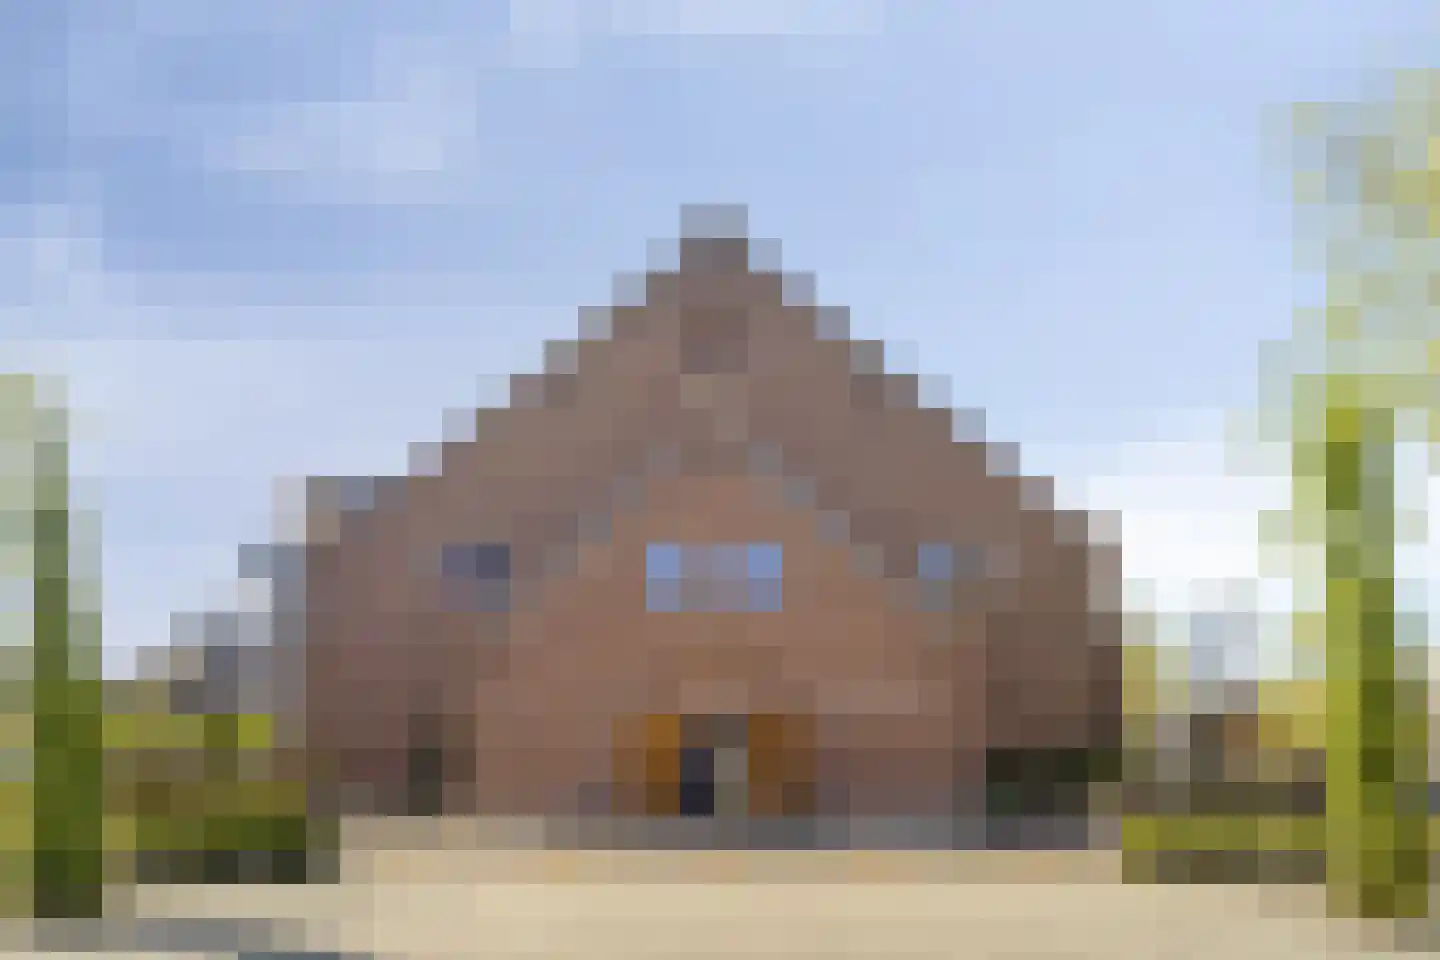
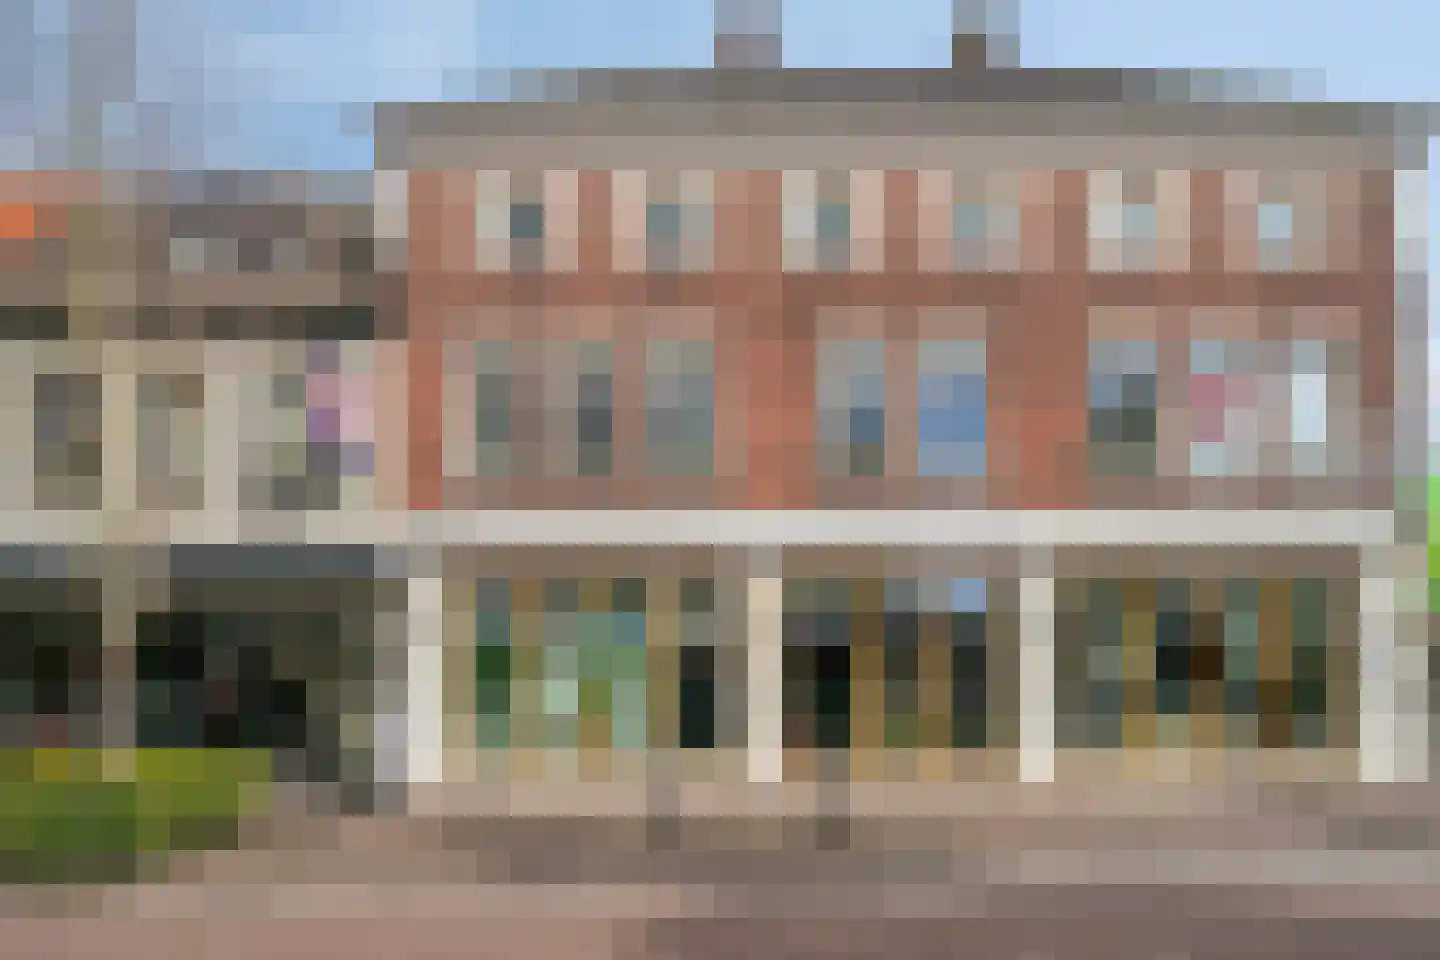
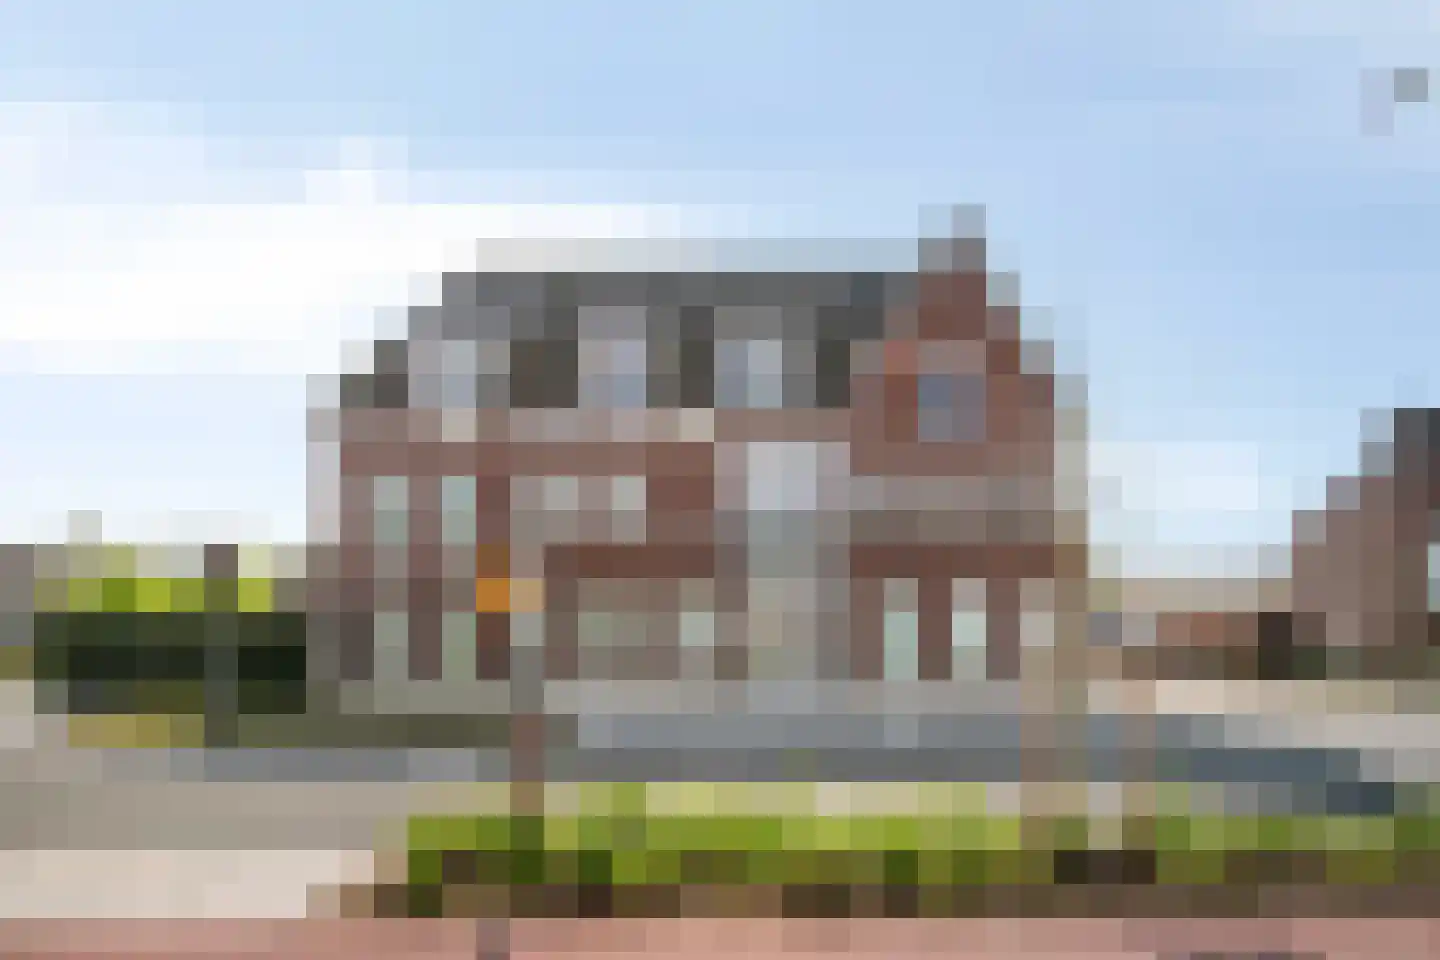
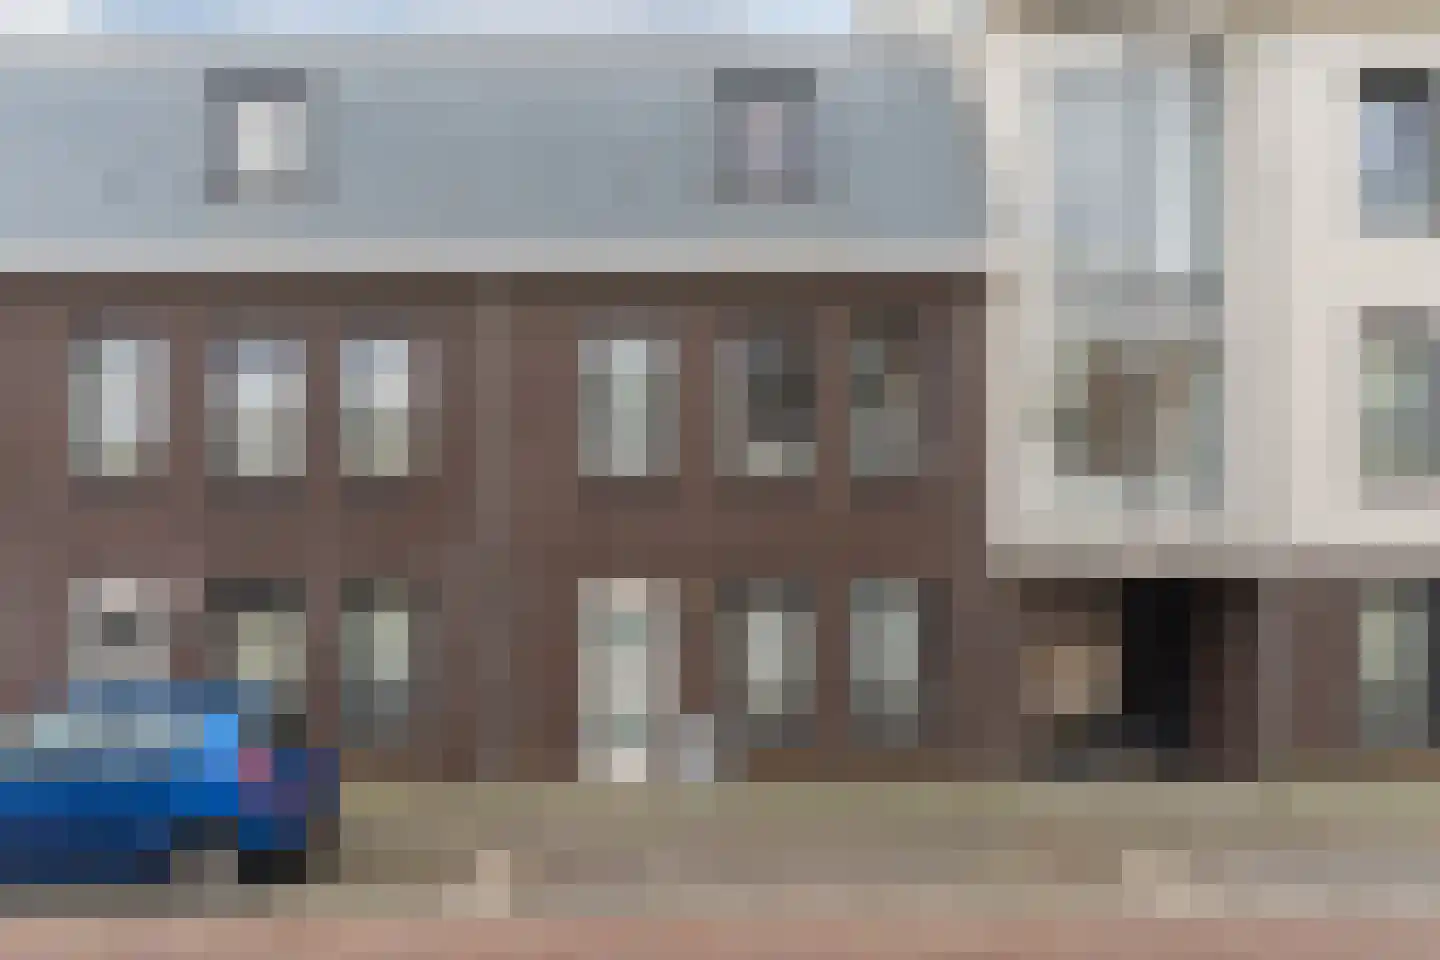
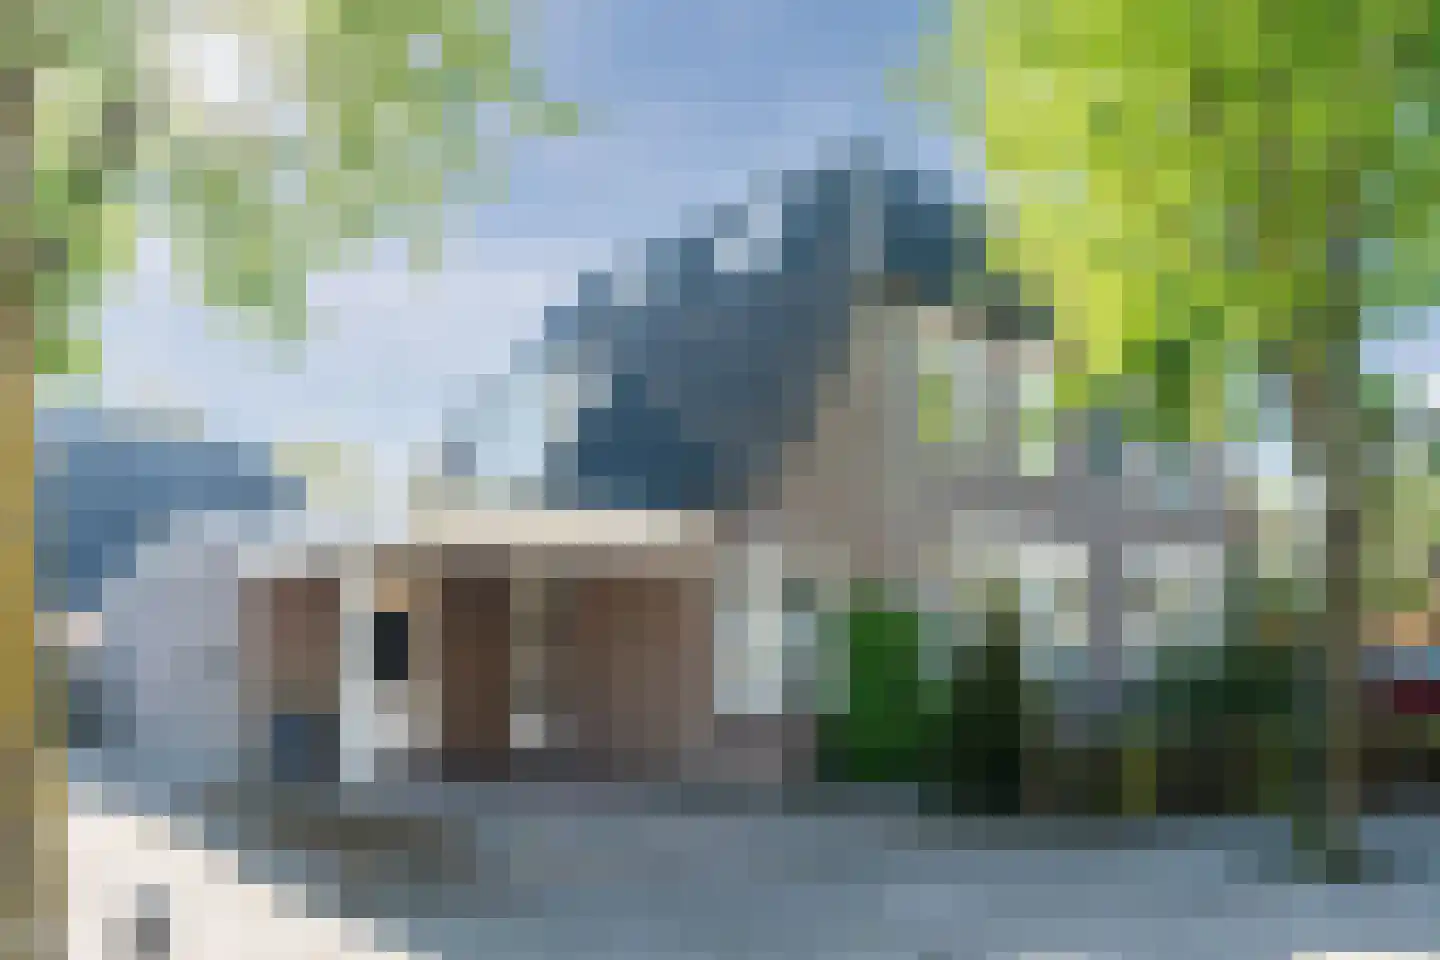
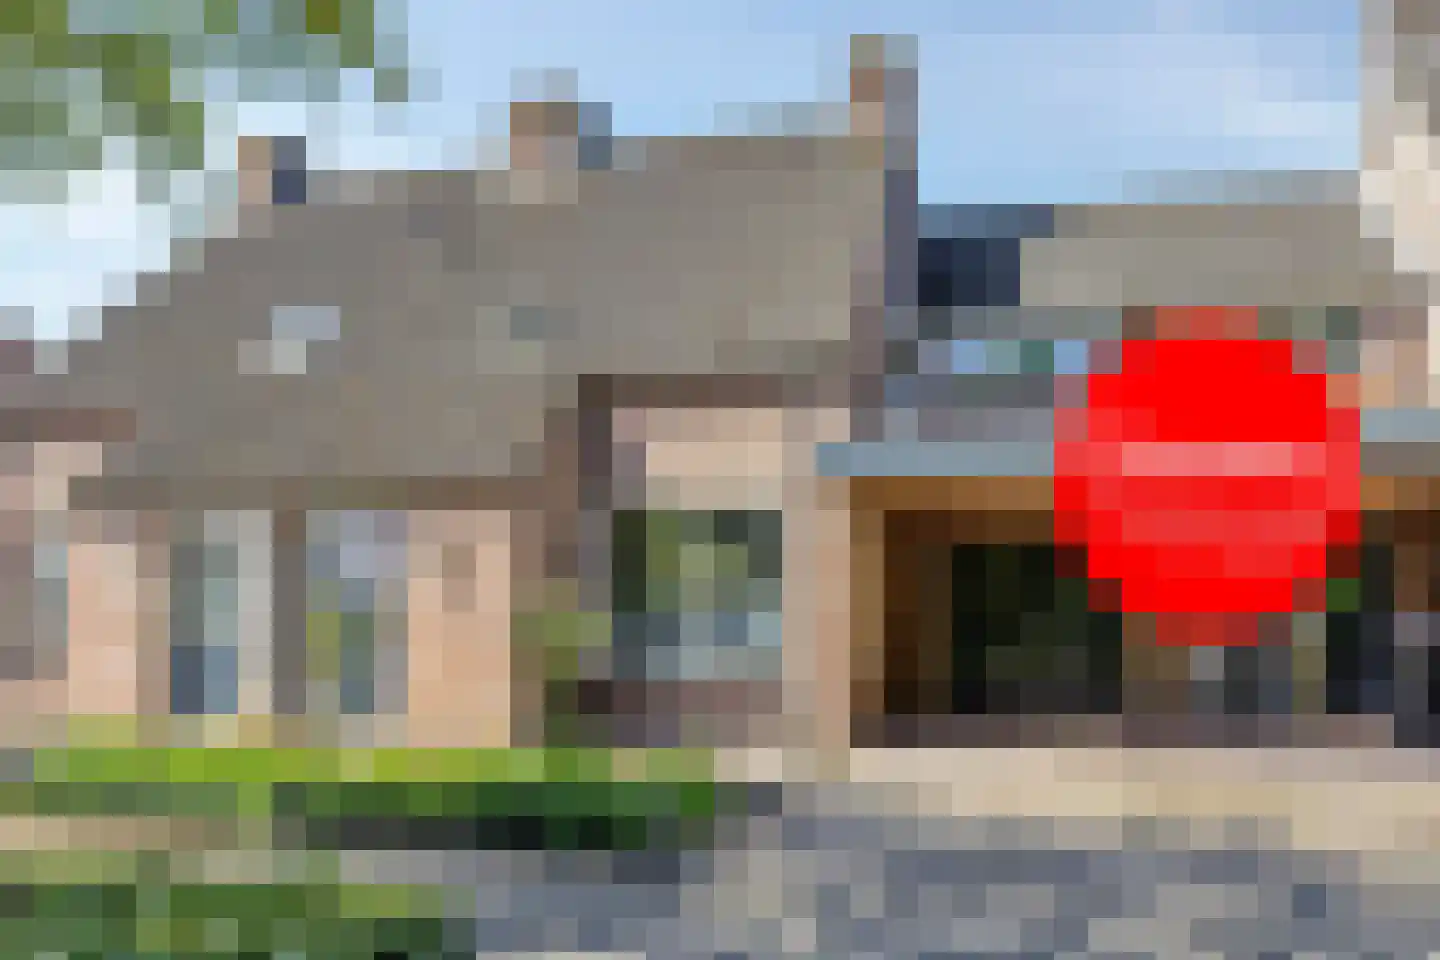
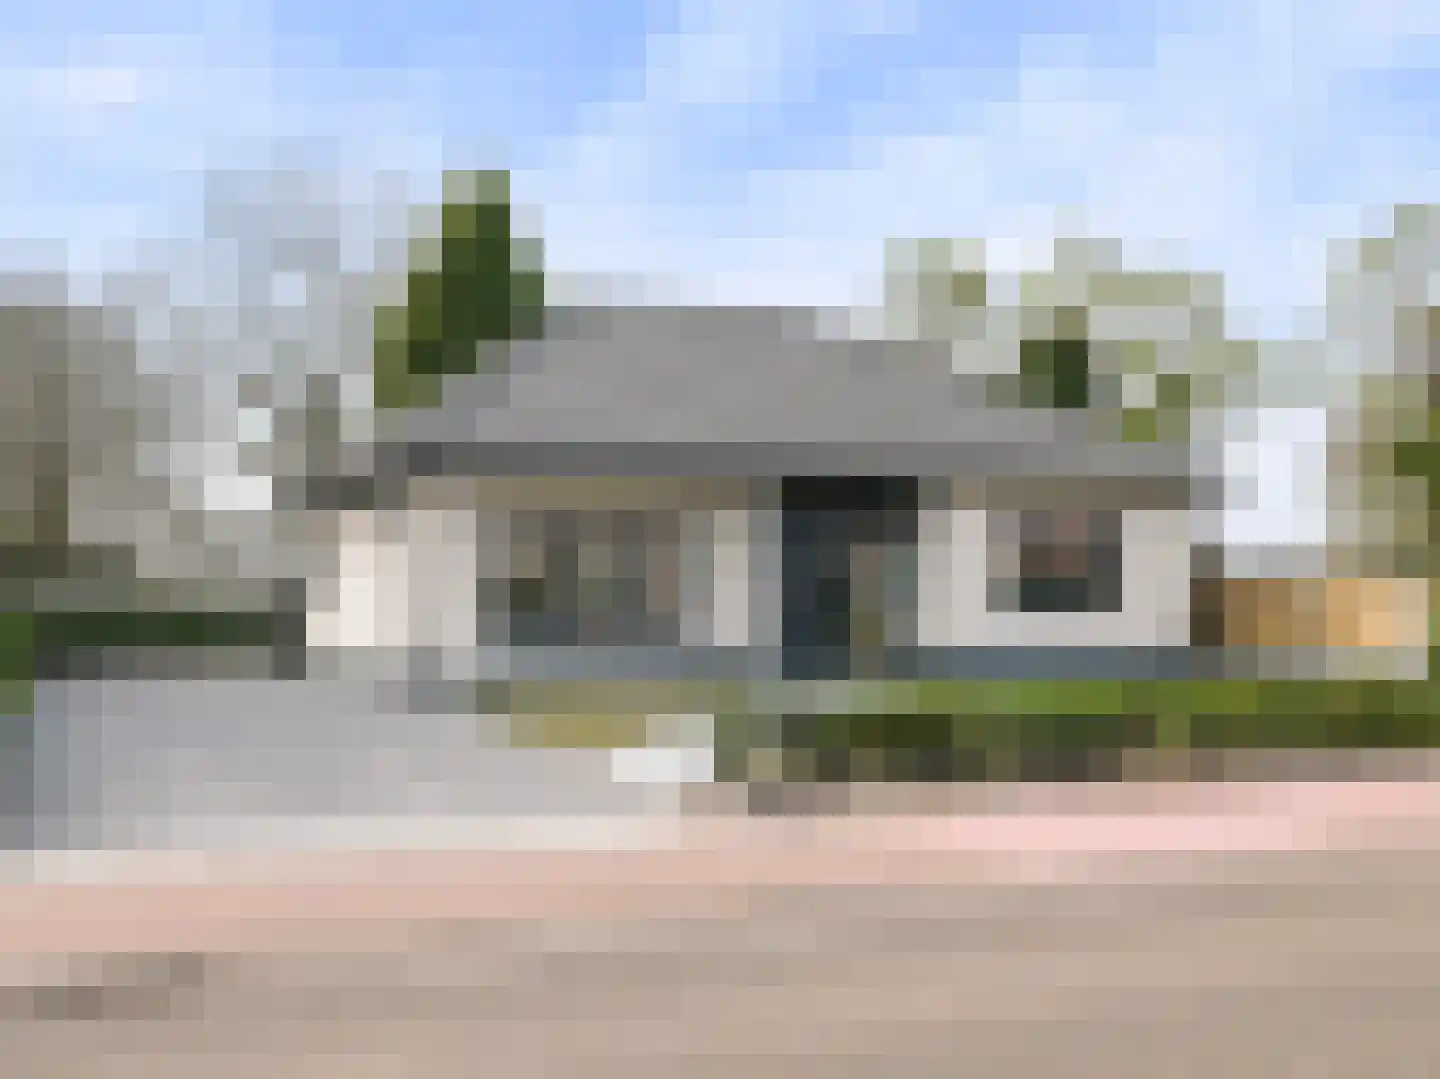
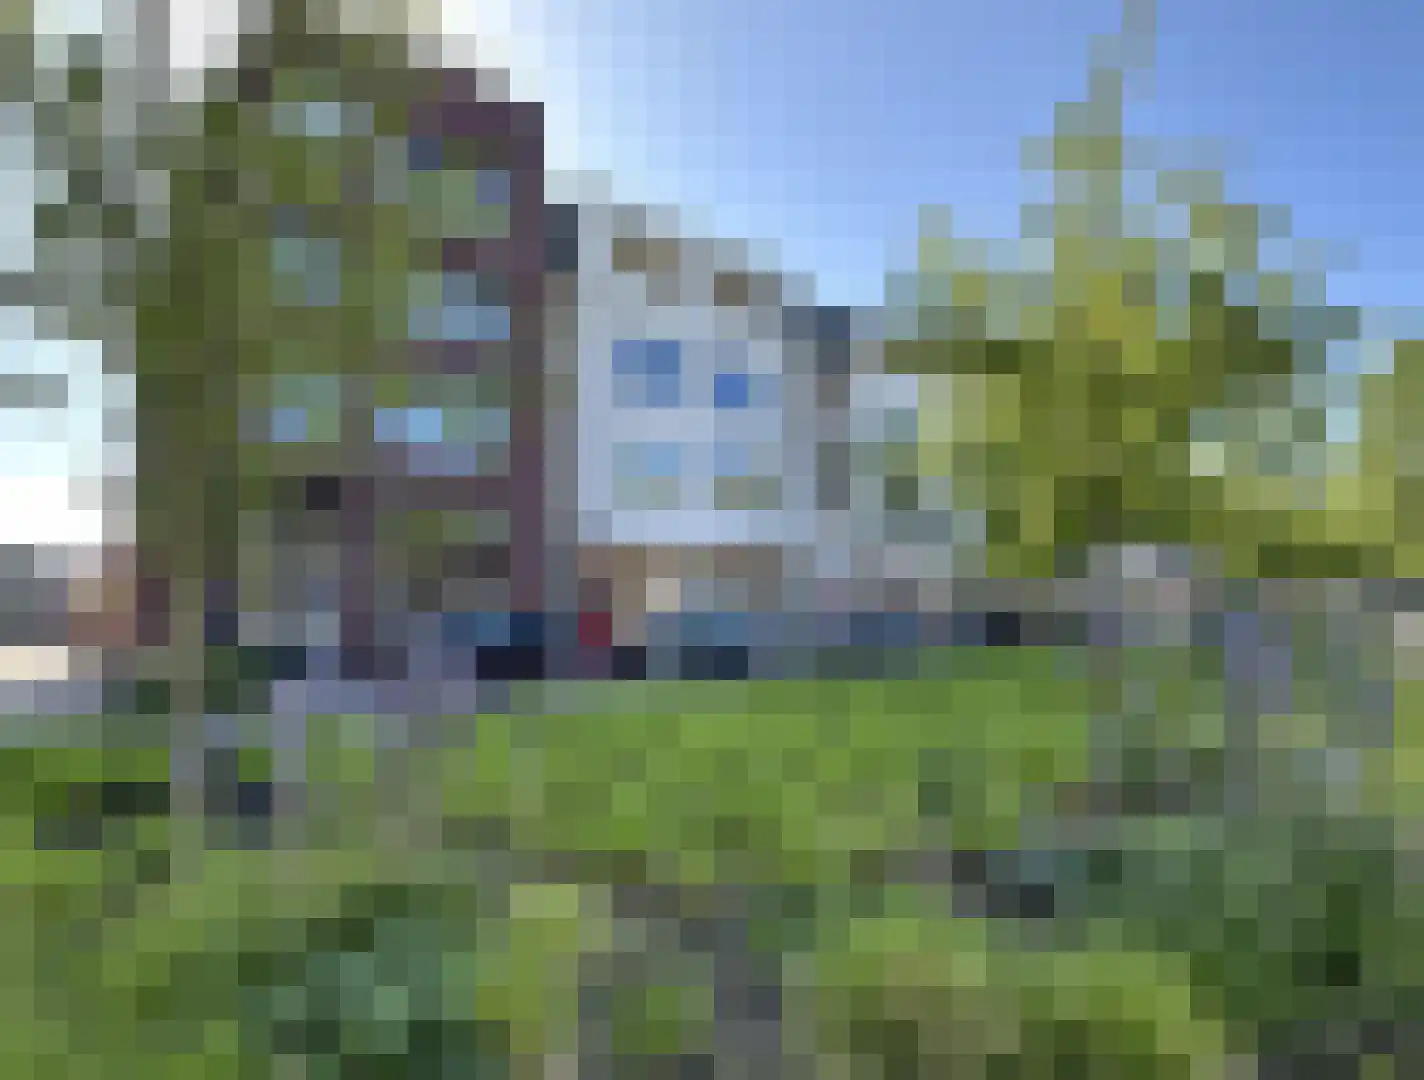
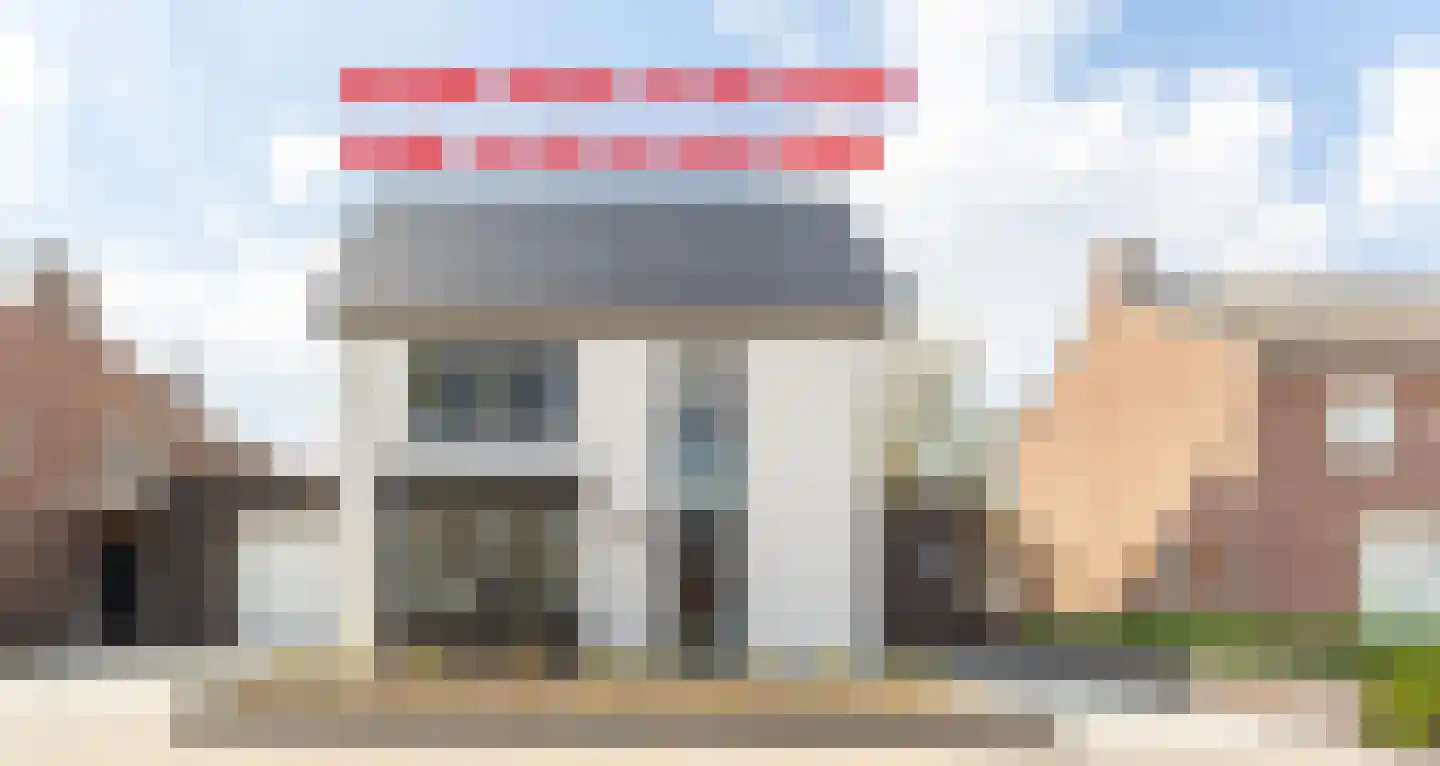
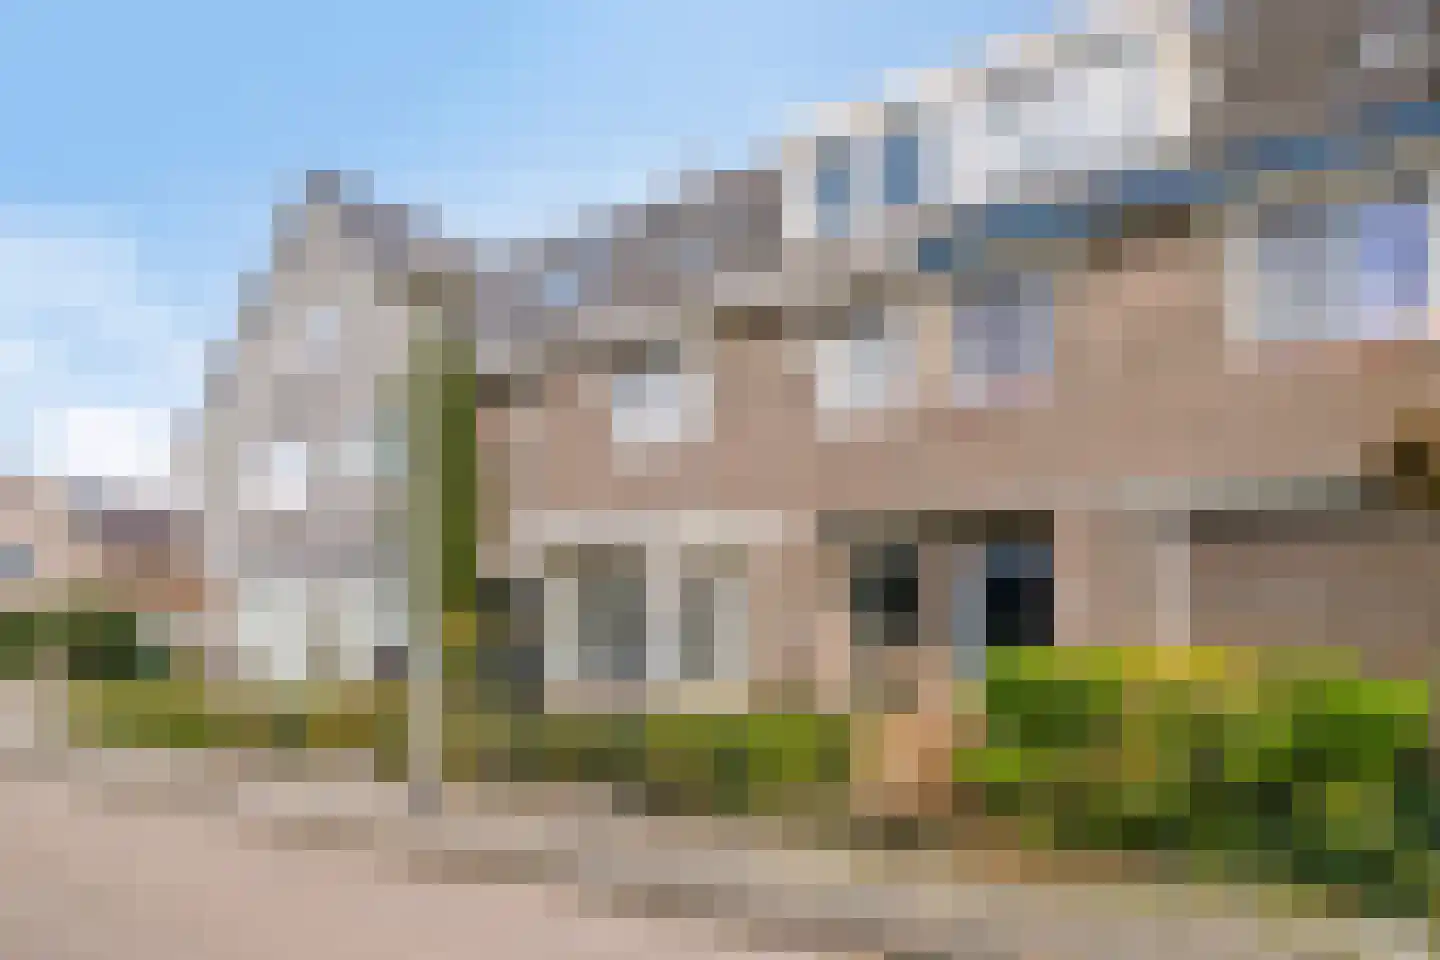
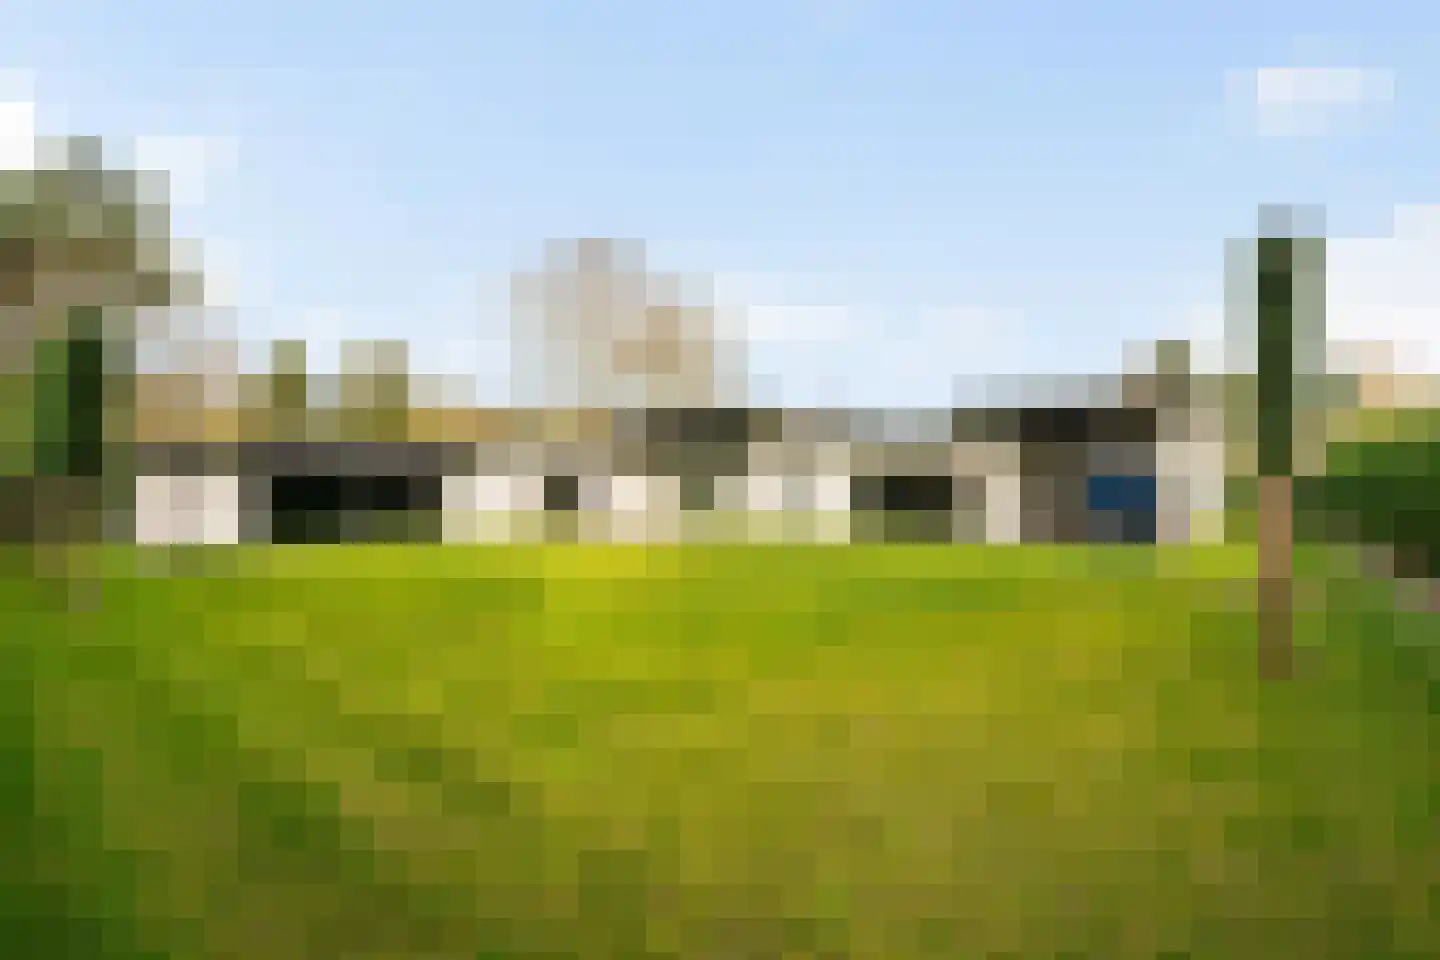
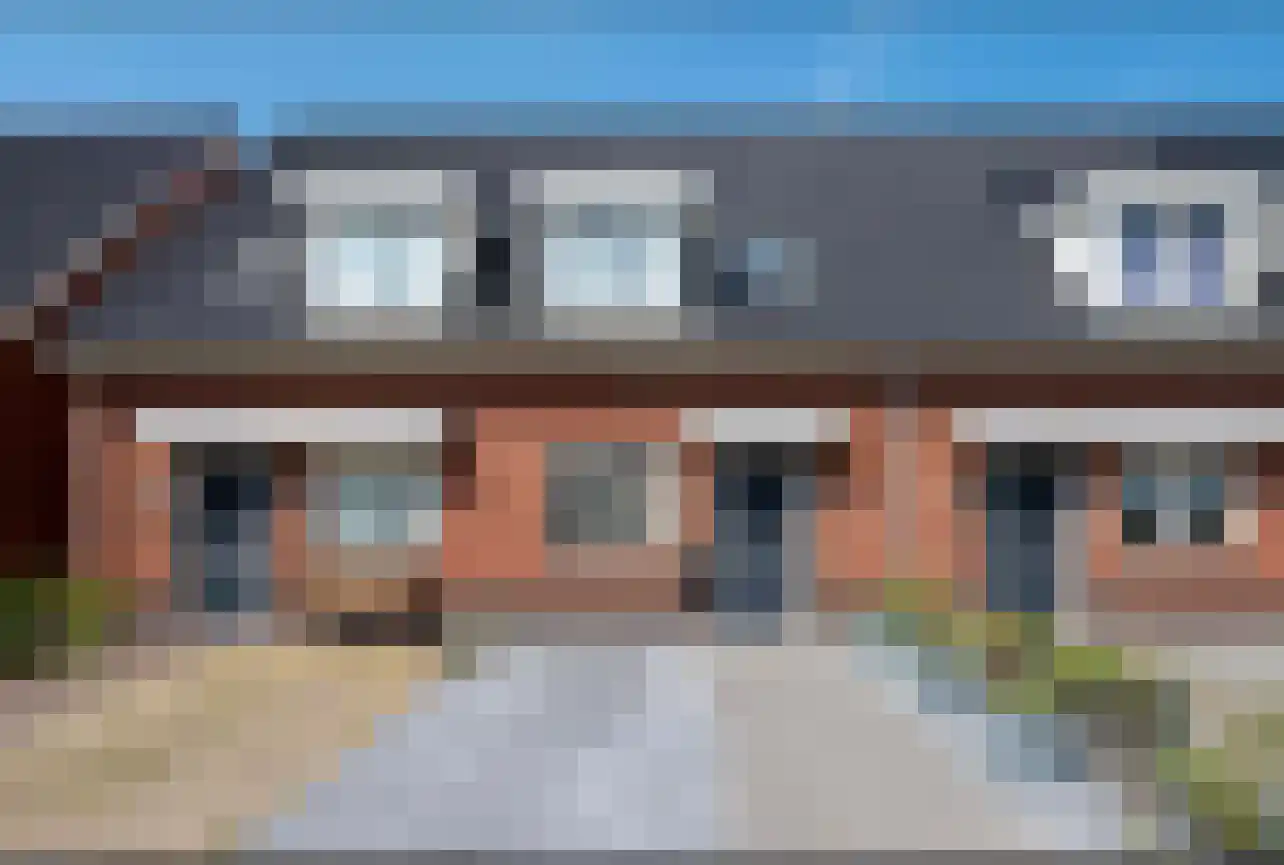
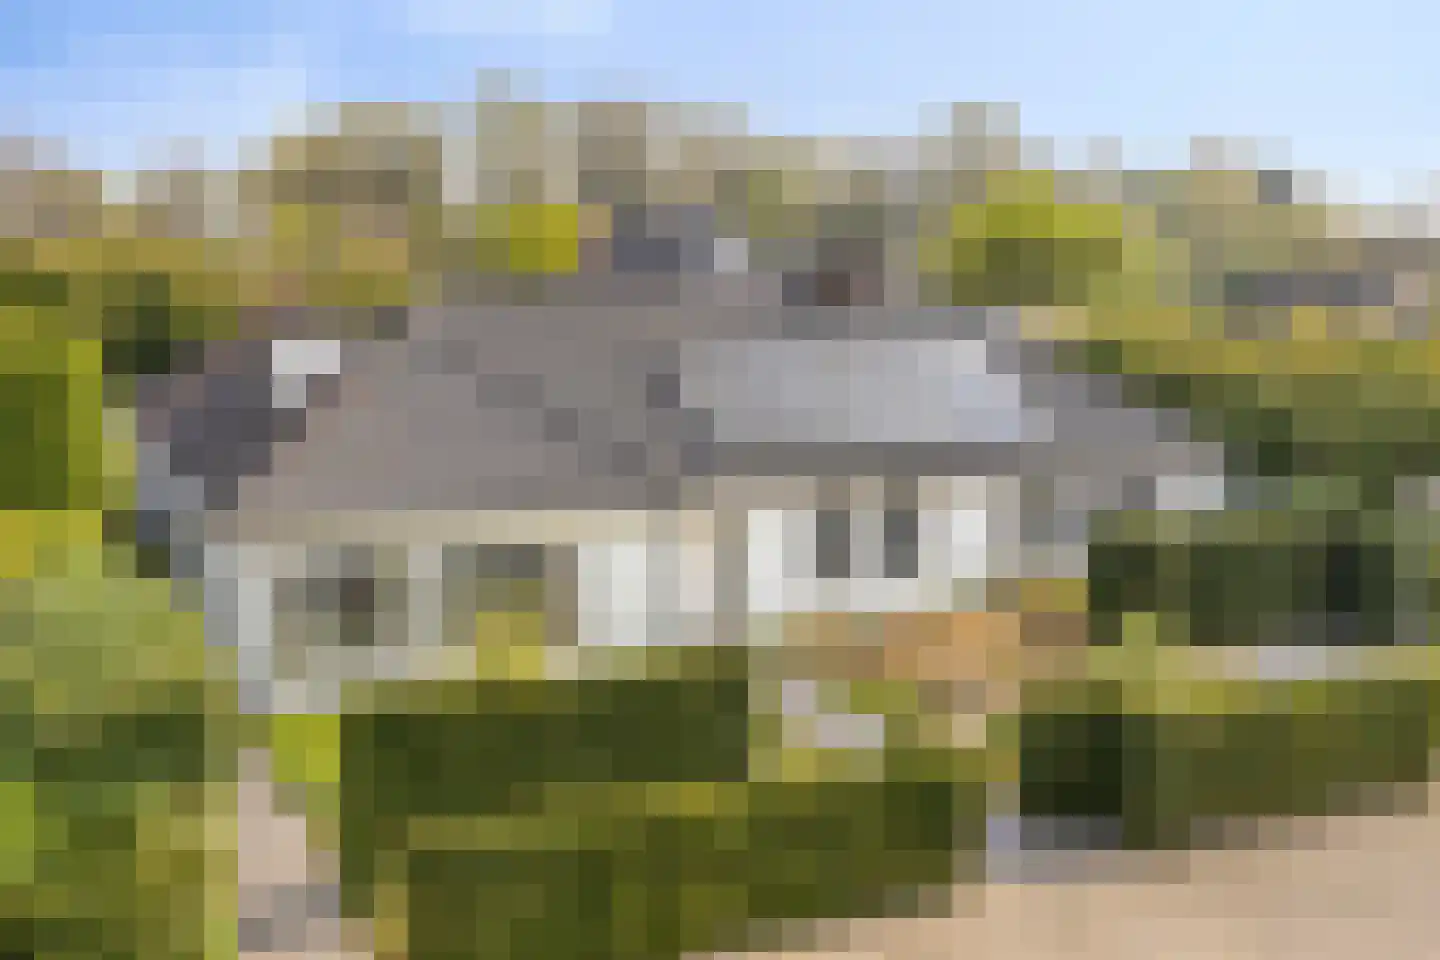
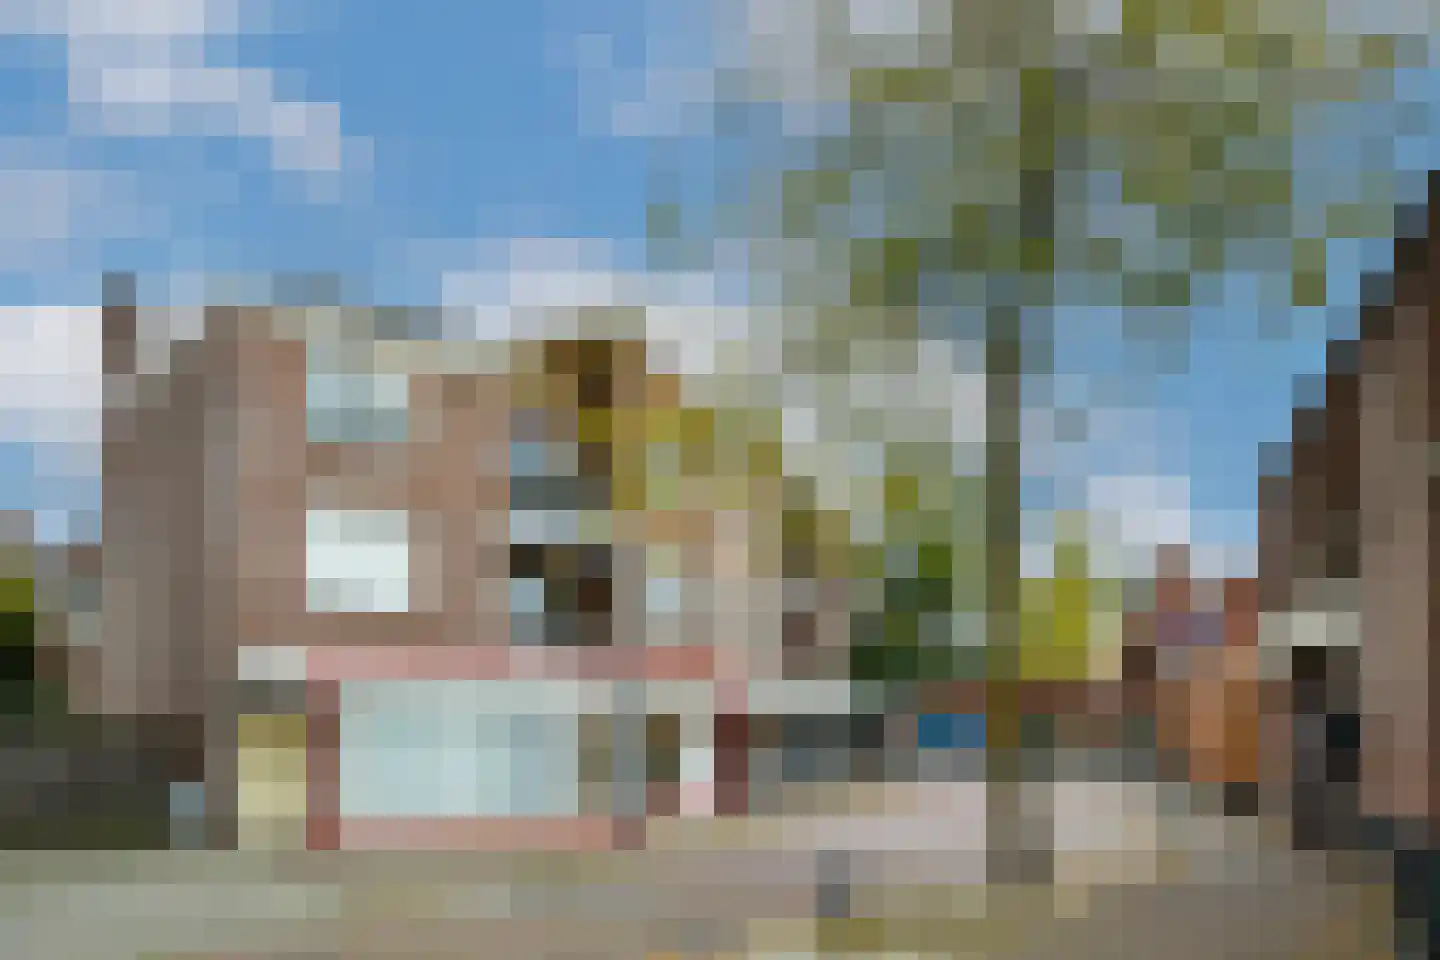
- Available
Peperstraat 5 B
5554EG Valkenswaard
€ 399.000 k.k.
€ 4.337/m²
- Living area
- 92 m²
- Land area
- —
- Bedrooms
- 3
Searching in 492 houses in Valkenswaard
Type to search. Use arrow down and arrow up to navigate through results and press Enter to open.
Hidden search suggestions.
View current properties in Valkenswaard or search targeted on street, postal code and property characteristics.
View the current housing stock in Valkenswaard and quickly filter by price, living area, rooms and more. There are currently 492 houses in this place within our selection. View also 344 sold houses in Valkenswaard for extra insight into the local housing market.
5554EG Valkenswaard
€ 399.000 k.k.
€ 4.337/m²
5554MA Valkenswaard
€ 895.000 k.k.
€ 4.972/m²
5552CA Valkenswaard
€ 495.000 k.k.
€ 3.486/m²
5554SW Valkenswaard
€ 439.000 k.k.
€ 3.817/m²
5551RA Valkenswaard
€ 499.000 k.k.
€ 3.590/m²
5554LX Valkenswaard
€ 389.000 k.k.
5554GE Valkenswaard
€ 995.000 k.k.
5554CH Valkenswaard
€ 395.000 k.k.
5554JP Valkenswaard
€ 715.000 k.k.
5554JW Valkenswaard
€ 469.000 k.k.
5552HC Valkenswaard
€ 435.000 k.k.
5554AB Valkenswaard
€ 889.000 k.k.
5554CV Valkenswaard
€ 429.000 k.k.
5552JE Valkenswaard
€ 600.000 k.k.
€ 4.478/m²
5554NM Valkenswaard
€ 375.000 k.k.
€ 4.747/m²
5552JA Valkenswaard
€ 349.500 k.k.
€ 4.369/m²
5554KN Valkenswaard
€ 599.000 k.k.
€ 4.218/m²
5551MA Valkenswaard
€ 585.000 k.k.
€ 3.679/m²
5556VB Valkenswaard
€ 449.000 k.k.
€ 2.551/m²
5551ET Valkenswaard
€ 375.000 k.k.
€ 4.261/m²
5554AD Valkenswaard
€ 315.000 k.k.
€ 3.841/m²
5554ER Valkenswaard
€ 995.000 k.k.
€ 5.408/m²
5555CN Valkenswaard
€ 589.000 k.k.
€ 3.681/m²
5556WB Valkenswaard
€ 1.499.000 k.k.
€ 3.873/m²
5551NC Valkenswaard
€ 469.000 k.k.
5555LA Valkenswaard
€ 1.295.000 k.k.
€ 3.700/m²
5554HK Valkenswaard
€ 450.000 k.k.
€ 3.846/m²
5555JE Valkenswaard
€ 615.000 k.k.
€ 4.556/m²
Get free quotes from real estate agents with local market knowledge. Compare more than 83 real estate agents in Valkenswaard.
Selling a home in Valkenswaard? View the sales-oriented guide sell a house in Valkenswaard, compare all real estate agents in Valkenswaard or view the top 10 real estate agents in Valkenswaard for extra context to your choice.
Real estate agents make sharper offers when they know you're comparing — ask for quotes for sale or purchase.
Practical answers about housing supply, sales and comparing real estate agents in Valkenswaard.
The costs of a real estate agent in Valkenswaard depend on commission, setup costs, property presentation and the chosen service. Compare the 83 real estate agents in Valkenswaard via the real estate agent page and request multiple quotes to compare rates and approach well.
Within our selection, we are currently showing 492 houses in Valkenswaard. View also the sold houses in Valkenswaard to compare the current offering with recent transactions.
Take into account not only price and living area but also maintenance, energy label, location, outdoor space and sales status. This way you compare houses in Valkenswaard on more than just the asking price.
A local real estate agent knows the neighborhoods, recent transactions and demand in Valkenswaard. By comparing 83 real estate agents in the region you get a better insight into prices, sales strategy and expected yield; the top 10 in Valkenswaard provides a useful starting point.
Yes, when making a sales plan, a valuation in Valkenswaard is wise. You gain insight into a realistic asking price and can then compare offers from real estate agents specifically.
View current location data on residents, WOZ development, housing stock, energy consumption, business activity and safety in Valkenswaard. In 2026 were there 31.912 residents. The average WOZ value in 2025 is EUR 419.000.
These figures help to better assess and compare the housing stock in Valkenswaard with recent sold homes. Orient yourself then on suitable top real estate agents in Valkenswaard for sales advice in this region.
Residents
31.912
Last year: 2026
Average WOZ
EUR 419.000
Last year: 2025
Average income per person.
EUR 35.200
Source: AllNumbers
Crimes (current year)
1.000
Total registered
| Year | Residents |
|---|---|
| 2022 | 31.236 |
| 2023 | 31.527 |
| 2024 | 31.714 |
| 2025 | 31.955 |
| 2026 | 31.912 |
| Year | Average WOZ |
|---|---|
| 2021 | EUR 301.000 |
| 2022 | EUR 326.000 |
| 2023 | EUR 360.000 |
| 2024 | EUR 381.000 |
| 2025 | EUR 419.000 |
Hoger
31
Praktisch
27
Middelbaar
42
Europa
2.822
Nederland
25.976
Buiten Europa
3.157
Label A
4.306
Label C
4.052
Label B
2.629
Label D
1.250
Label G
935
Label E
779
Label F
725
Label A+++
469
Label A+
395
Label A++
245
Label A++++
92
Label A+++++
6
| Year | Gas (m3) | Electricity (kWh) |
|---|---|---|
| 2020 | 1.250 | 2.990 |
| 2021 | 1.400 | 3.000 |
| 2022 | 1.100 | 2.790 |
| 2023 | 920 | 2.660 |
| 2024 | 880 | 2.730 |
Hoekwoning
Gas: 980 • Electricity: 2.650
Huurwoning
Gas: 720 • Electricity: 2.000
Koopwoning
Gas: 1.050 • Electricity: 3.090
Appartement
Gas: 550 • Electricity: 1.890
Tussenwoning
Gas: 880 • Electricity: 2.470
Vrijstaande woning
Gas: 1.480 • Electricity: 4.210
Twee-onder-één-kap woning
Gas: 1.120 • Electricity: 3.120
Total number of company establishments: 4.100
| Period | Crimes |
|---|---|
| jan 2025 | 91 |
| jan 2026 | 55 |
| jul 2025 | 85 |
| jun 2025 | 66 |
| mei 2025 | 84 |
| mrt 2025 | 111 |
| nov 2024 | 91 |
| nov 2025 | 68 |
| okt 2024 | 103 |
| okt 2025 | 95 |
| sep 2024 | 98 |
| sep 2025 | 88 |
These figures give an indicative picture of safety trends in the living environment of Valkenswaard.
Short answers based on current local statistics, handy for a quick comparison of the living environment.
Valkenswaard telt in 2026 ongeveer 31.912 inwoners.
De gemiddelde WOZ-waarde in Valkenswaard is in 2025 circa € 419.000.
Het gemiddelde inkomen per inwoner in Valkenswaard ligt rond € 35.200 per jaar.
Voor het huidige jaar gaat het om ongeveer 1.000 geregistreerde misdrijven. Gebruik deze cijfers als indicatie en vergelijk trends per periode.
In Valkenswaard komt vooral "Tussenwoningen" veel voor, met ongeveer 5.150 woningen.