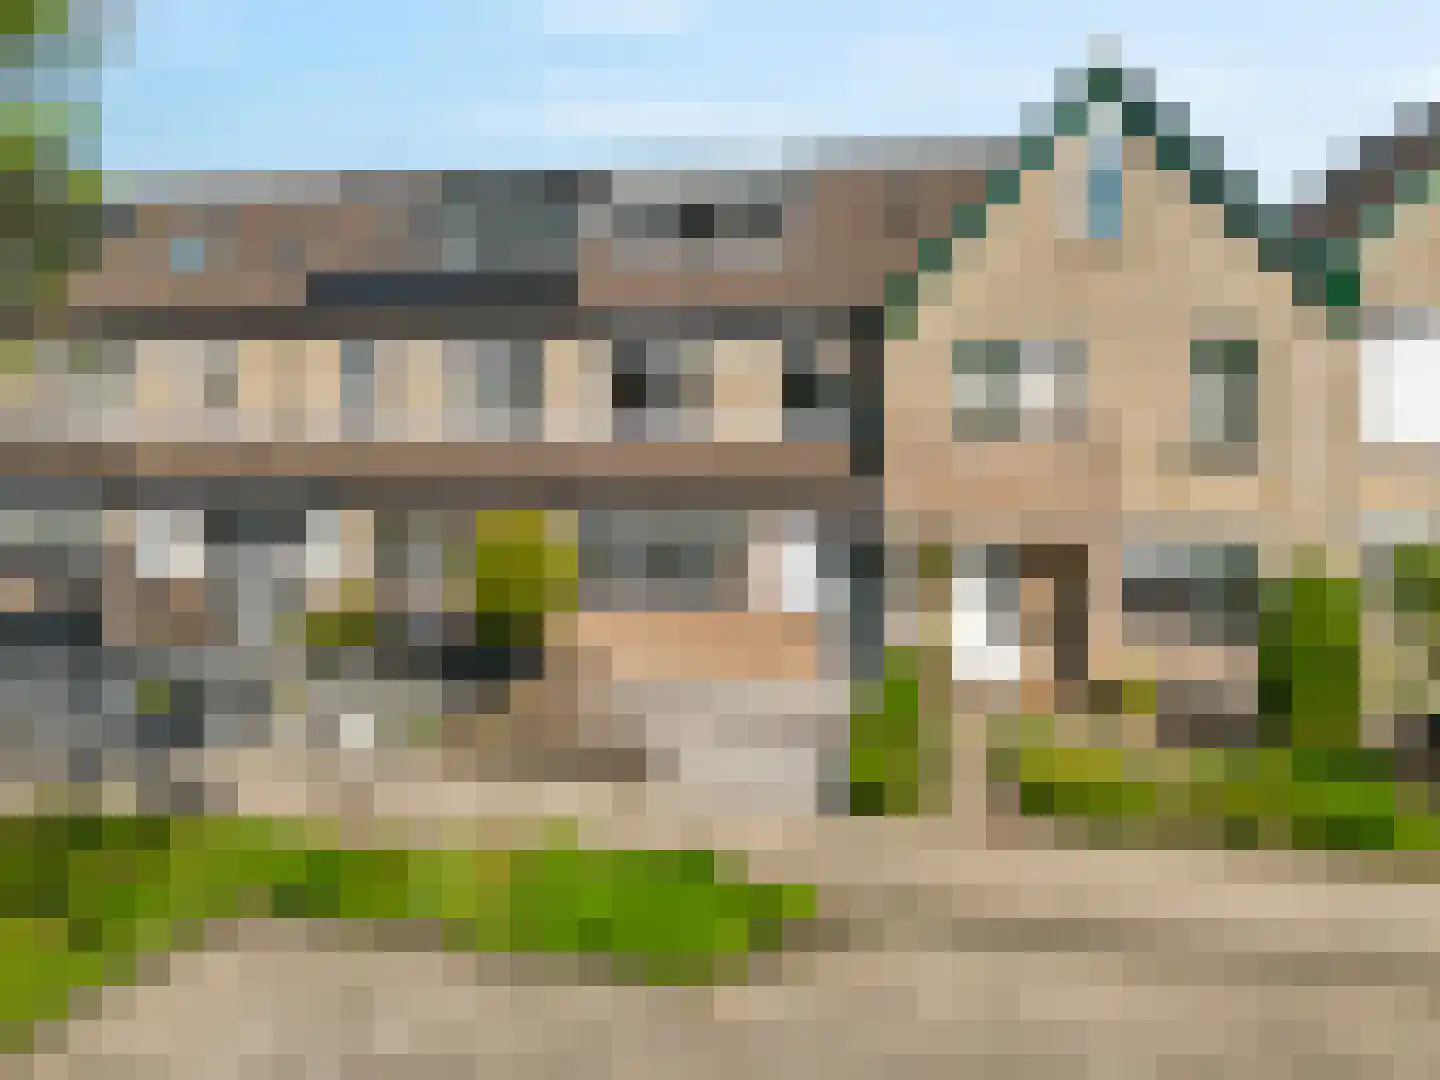
- Available
Waeterrijck 11
3645CP Vinkeveen
€ 710.000 k.k.
€ 8.415/m²
- Living area
- 101 m²
- Land area
- 732 m²
- Bedrooms
- 3
Searching in 176 houses in Vinkeveen
Type to search. Use arrow down and arrow up to navigate through results and press Enter to open.
Hidden search suggestions.
View current properties in Vinkeveen or search targeted on street, postal code and property characteristics.
View the current housing stock in Vinkeveen and quickly filter by price, living area, rooms and more. There are currently 176 houses in this place within our selection. View also 82 sold houses in Vinkeveen for extra insight into the local housing market.
3645CP Vinkeveen
€ 710.000 k.k.
€ 8.415/m²
3645AR Vinkeveen
€ 295.000 k.k.
€ 9.218/m²
3645DL Vinkeveen
€ 1.150.000 k.k.
€ 7.143/m²
3645DL Vinkeveen
€ 995.000 k.k.
€ 6.030/m²
3645BB Vinkeveen
€ 2.695.000
€ 10.446/m²
3645AD Vinkeveen
€ 5.395.000 k.k.
€ 10.726/m²
3645EG Vinkeveen
€ 1.295.000 k.k.
€ 11.773/m²
3645EH Vinkeveen
€ 499.000 k.k.
€ 7.028/m²
3645BA Vinkeveen
€ 2.500.000 k.k.
€ 8.418/m²
3645AE Vinkeveen
€ 14.950.000 k.k.
€ 13.591/m²
3645BB Vinkeveen
€ 1.495.000 k.k.
€ 7.119/m²
3645AD Vinkeveen
€ 2.650.000 k.k.
€ 8.055/m²
3645GS Vinkeveen
€ 699.000 k.k.
€ 3.841/m²
3645AP Vinkeveen
€ 1.295.000 k.k.
€ 6.816/m²
3645BX Vinkeveen
€ 750.000 k.k.
€ 9.593/m²
3645DW Vinkeveen
€ 725.000 k.k.
€ 7.631/m²
3645CE Vinkeveen
€ 750.000 k.k.
€ 15.666/m²
3645CE Vinkeveen
€ 750.000 k.k.
€ 13.852/m²
3645DX Vinkeveen
€ 5.650.000 k.k.
€ 6.377/m²
3645DW Vinkeveen
€ 695.000 k.k.
€ 8.019/m²
3645AA Vinkeveen
€ 1.275.000 k.k.
€ 6.439/m²
3645AE Vinkeveen
€ 5.495.000 k.k.
€ 8.402/m²
3645CD Vinkeveen
€ 375.000 k.k.
€ 6.818/m²
3645BD Vinkeveen
€ 785.000 k.k.
€ 5.340/m²
3645JG Vinkeveen
€ 37.500 k.k.
3645JK Vinkeveen
€ 389.000 k.k.
€ 4.576/m²
3645GB Vinkeveen
€ 595.000 k.k.
€ 4.722/m²
3645LK Vinkeveen
€ 565.000 k.k.
Get free quotes from real estate agents with local market knowledge. Compare more than 37 real estate agents in Vinkeveen.
Selling a home in Vinkeveen? View the sales-oriented guide sell a house in Vinkeveen, compare all real estate agents in Vinkeveen or view the top 10 real estate agents in Vinkeveen for extra context to your choice.
Real estate agents make sharper offers when they know you're comparing — ask for quotes for sale or purchase.
Practical answers about housing supply, sales and comparing real estate agents in Vinkeveen.
The costs of a real estate agent in Vinkeveen depend on commission, setup costs, property presentation and the chosen service. Compare the 37 real estate agents in Vinkeveen via the real estate agent page and request multiple quotes to compare rates and approach well.
Within our selection, we are currently showing 176 houses in Vinkeveen. View also the sold houses in Vinkeveen to compare the current offering with recent transactions.
Take into account not only price and living area but also maintenance, energy label, location, outdoor space and sales status. This way you compare houses in Vinkeveen on more than just the asking price.
A local real estate agent knows the neighborhoods, recent transactions and demand in Vinkeveen. By comparing 37 real estate agents in the region you get a better insight into prices, sales strategy and expected yield; the top 10 in Vinkeveen provides a useful starting point.
Yes, when making a sales plan, a valuation in Vinkeveen is wise. You gain insight into a realistic asking price and can then compare offers from real estate agents specifically.
View current location data on residents, WOZ development, housing stock, energy consumption, business activity and safety in Vinkeveen. In 2025 were there 9.710 residents. The average WOZ value in 2025 is EUR 583.000.
These figures help to better assess and compare the housing stock in Vinkeveen with recent sold homes. Orient yourself then on suitable top real estate agents in Vinkeveen for sales advice in this region.
Residents
9.710
Last year: 2025
Average WOZ
EUR 583.000
Last year: 2025
Average income per person.
EUR 42.100
Source: AllNumbers
Crimes (current year)
224
Total registered
| Year | Residents |
|---|---|
| 2021 | 9.490 |
| 2022 | 9.480 |
| 2023 | 9.545 |
| 2024 | 9.600 |
| 2025 | 9.710 |
| Year | Average WOZ |
|---|---|
| 2021 | EUR 434.000 |
| 2022 | EUR 474.000 |
| 2023 | EUR 557.000 |
| 2024 | EUR 555.000 |
| 2025 | EUR 583.000 |
Hoger
2.660
Praktisch
1.560
Middelbaar
2.960
Europa
630
Nederland
7.920
Buiten Europa
1.160
Label C
1.232
Label A
1.193
Label B
745
Label D
336
Label G
243
Label F
195
Label E
179
Label A+
39
Label A+++
30
Label A++
24
Label A++++
6
Label A+++++
1
| Year | Gas (m3) | Electricity (kWh) |
|---|---|---|
| 2020 | 1.320 | 3.070 |
| 2021 | 1.500 | 3.210 |
| 2022 | 1.170 | 3.000 |
| 2023 | 1.010 | 2.850 |
| 2024 | 970 | 2.900 |
Hoekwoning
Gas: 1.010 • Electricity: 2.570
Huurwoning
Gas: 820 • Electricity: 1.950
Koopwoning
Gas: 1.100 • Electricity: 3.290
Appartement
Gas: 650 • Electricity: 1.850
Tussenwoning
Gas: 850 • Electricity: 2.540
Vrijstaande woning
Gas: 1.520 • Electricity: 4.250
Twee-onder-één-kap woning
Gas: 1.200 • Electricity: 3.360
Total number of company establishments: 1.825
| Period | Crimes |
|---|---|
| jan 2025 | 25 |
| jan 2026 | 9 |
| jul 2025 | 26 |
| jun 2025 | 21 |
| mei 2025 | 19 |
| mrt 2025 | 12 |
| nov 2024 | 26 |
| nov 2025 | 19 |
| okt 2024 | 17 |
| okt 2025 | 18 |
| sep 2024 | 19 |
| sep 2025 | 19 |
These figures give an indicative picture of safety trends in the living environment of Vinkeveen.
Short answers based on current local statistics, handy for a quick comparison of the living environment.
Vinkeveen telt in 2025 ongeveer 9.710 inwoners.
De gemiddelde WOZ-waarde in Vinkeveen is in 2025 circa € 583.000.
Het gemiddelde inkomen per inwoner in Vinkeveen ligt rond € 42.100 per jaar.
Voor het huidige jaar gaat het om ongeveer 224 geregistreerde misdrijven. Gebruik deze cijfers als indicatie en vergelijk trends per periode.
In Vinkeveen komt vooral "Tussenwoningen" veel voor, met ongeveer 1.429 woningen.