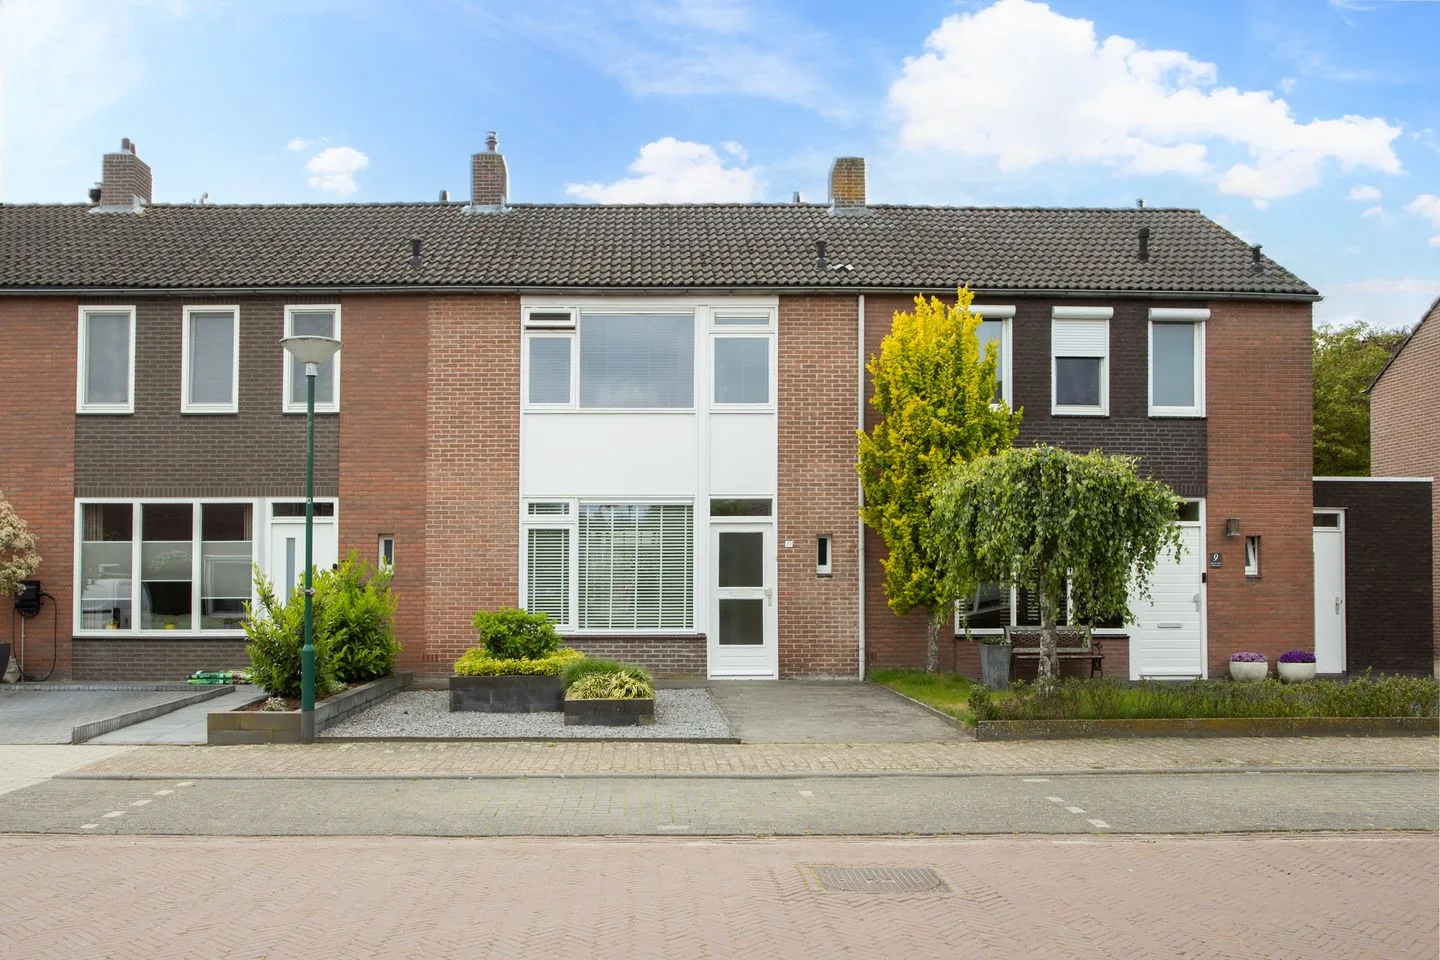
- Available
Hoeverstraat 50
5563AJ Westerhoven
€ 699.000 k.k.
€ 4.993/m²
- Living area
- 140 m²
- Land area
- 756 m²
- Bedrooms
- 4
Searching in 17 houses in Westerhoven
Type to search. Use arrow down and arrow up to navigate through results and press Enter to open.
Hidden search suggestions.
View current properties in Westerhoven or search targeted on street, postal code and property characteristics.
View the current housing stock in Westerhoven and quickly filter by price, living area, rooms and more. There are currently 17 houses in this place within our selection. View also 14 sold houses in Westerhoven for extra insight into the local housing market.
5563AJ Westerhoven
€ 699.000 k.k.
€ 4.993/m²
5563CG Westerhoven
€ 500.000 k.k.
€ 4.065/m²
5563BB Westerhoven
€ 409.000 k.k.
€ 4.050/m²
5563AJ Westerhoven
€ 799.000 k.k.
€ 4.097/m²
5563BR Westerhoven
€ 569.000 k.k.
€ 5.269/m²
5563AG Westerhoven
€ 760.000 k.k.
€ 4.720/m²
5563AW Westerhoven
€ 355.000 k.k.
€ 4.080/m²
5563CH Westerhoven
€ 675.000 k.k.
€ 4.560/m²
5563AD Westerhoven
€ 695.000 k.k.
€ 2.883/m²
5563AR Westerhoven
€ 275.000 k.k.
€ 6.875/m²
5563AR Westerhoven
€ 395.000 k.k.
€ 3.495/m²
5563AR Westerhoven
€ 498.000 k.k.
€ 3.192/m²
5563BL Westerhoven
€ 689.000 k.k.
€ 4.593/m²
5563AB Westerhoven
€ 750.000 k.k.
€ 5.033/m²
5563AZ Westerhoven
€ 425.000 k.k.
€ 0/m²
5563AD Westerhoven
€ 825.000 k.k.
€ 5.357/m²
5563BN Westerhoven
€ 679.000 k.k.
€ 3.447/m²
Get free quotes from real estate agents with local market knowledge. Compare more than 43 real estate agents in Westerhoven.
Selling a home in Westerhoven? Compare all real estate agents in Westerhoven or view the top 10 real estate agents in Westerhoven for extra context for your choice.
Real estate agents make sharper offers when they know you're comparing — ask for quotes for sale or purchase.
Practical answers about housing supply, sales and comparing real estate agents in Westerhoven.
The costs of a real estate agent in Westerhoven depend on commission, setup costs, property presentation and the chosen service. Compare the 43 real estate agents in Westerhoven via the real estate agent page and request multiple quotes to compare rates and approach well.
Within our selection, we are currently showing 17 houses in Westerhoven. View also the sold houses in Westerhoven to compare the current offering with recent transactions.
Take into account not only price and living area but also maintenance, energy label, location, outdoor space and sales status. This way you compare houses in Westerhoven on more than just the asking price.
A local real estate agent knows the neighborhoods, recent transactions and demand in Westerhoven. By comparing 43 real estate agents in the region you get a better insight into prices, sales strategy and expected yield; the top 10 in Westerhoven provides a useful starting point.
Yes, when making a sales plan, a valuation in Westerhoven is wise. You gain insight into a realistic asking price and can then compare offers from real estate agents specifically.
View current location data on residents, WOZ development, housing stock, energy consumption, business activity and safety in Westerhoven. In 2025 were there 2.030 residents. The average WOZ value in 2025 is EUR 470.855.
These figures help to better assess and compare the housing stock in Westerhoven with recent sold homes. Orient yourself then on suitable top real estate agents in Westerhoven for sales advice in this region.
Residents
2.030
Last year: 2025
Average WOZ
EUR 470.855
Last year: 2025
Average income per person.
EUR 29.534
Source: AllNumbers
Crimes (current year)
81
Total registered
| Year | Residents |
|---|---|
| 2021 | 2.015 |
| 2022 | 2.060 |
| 2023 | 2.070 |
| 2024 | 2.050 |
| 2025 | 2.030 |
| Year | Average WOZ |
|---|---|
| 2021 | EUR 345.869 |
| 2022 | EUR 385.068 |
| 2023 | EUR 433.814 |
| 2024 | EUR 472.137 |
| 2025 | EUR 470.855 |
Hoger
180
Praktisch
200
Middelbaar
420
Europa
180
Nederland
1.770
Buiten Europa
90
Label D
465
Label C
395
Label A
225
Label B
204
Label F
152
Label G
115
Label E
24
Label A+
17
Label A++
11
Label A+++
11
Label A+++++
1
Label A++++
0
| Year | Gas (m3) | Electricity (kWh) |
|---|---|---|
| 2020 | 1.444 | 3.586 |
| 2021 | 1.663 | 3.587 |
| 2022 | 1.286 | 3.309 |
| 2023 | 1.043 | 3.183 |
| 2024 | 998 | 3.176 |
Hoekwoning
Gas: 699 • Electricity: 2.112
Huurwoning
Gas: 902 • Electricity: 2.131
Koopwoning
Gas: 1.082 • Electricity: 3.438
Appartement
Gas: 609 • Electricity: 1.733
Tussenwoning
Gas: 535 • Electricity: 1.807
Vrijstaande woning
Gas: 1.231 • Electricity: 3.969
Twee-onder-één-kap woning
Gas: 903 • Electricity: 2.677
Total number of company establishments: 360
| Period | Crimes |
|---|---|
| jan 2025 | 4 |
| jan 2026 | 3 |
| jul 2025 | 8 |
| jun 2025 | 4 |
| mei 2025 | 7 |
| mrt 2025 | 8 |
| nov 2024 | 11 |
| nov 2025 | 5 |
| okt 2024 | 11 |
| okt 2025 | 8 |
| sep 2024 | 7 |
| sep 2025 | 3 |
These figures give an indicative picture of safety trends in the living environment of Westerhoven.
Short answers based on current local statistics, handy for a quick comparison of the living environment.
Westerhoven telt in 2025 ongeveer 2.030 inwoners.
De gemiddelde WOZ-waarde in Westerhoven is in 2025 circa € 470.855.
Het gemiddelde inkomen per inwoner in Westerhoven ligt rond € 29.534 per jaar.
Voor het huidige jaar gaat het om ongeveer 81 geregistreerde misdrijven. Gebruik deze cijfers als indicatie en vergelijk trends per periode.
In Westerhoven komt vooral "Vrijstaande woningen" veel voor, met ongeveer 365 woningen.