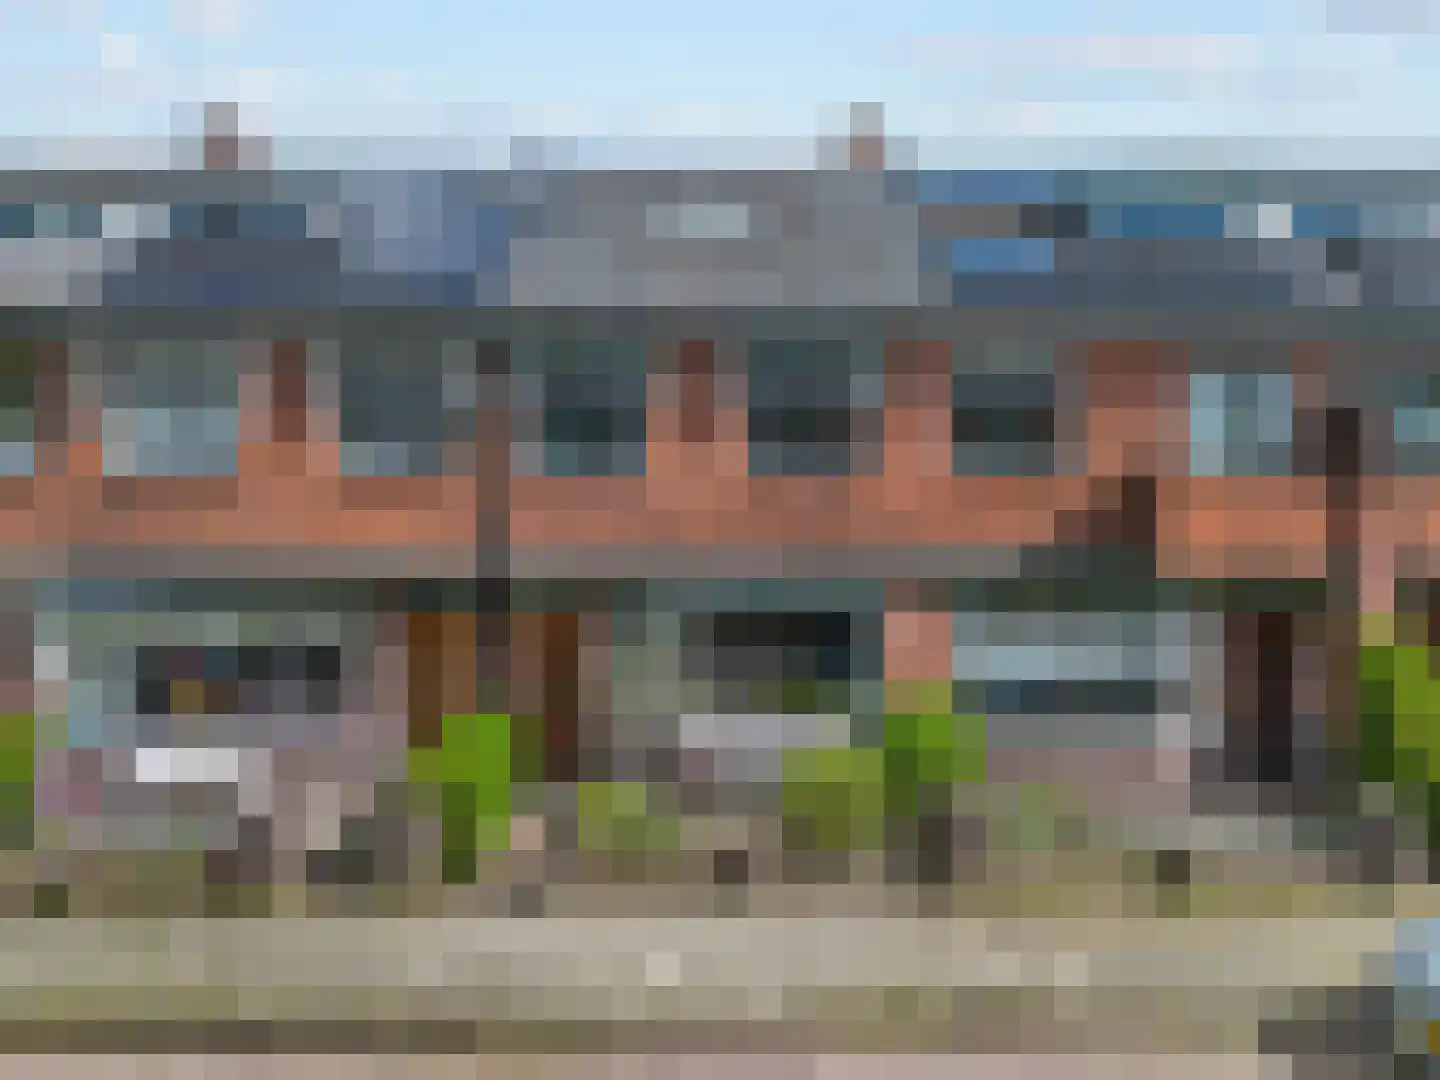
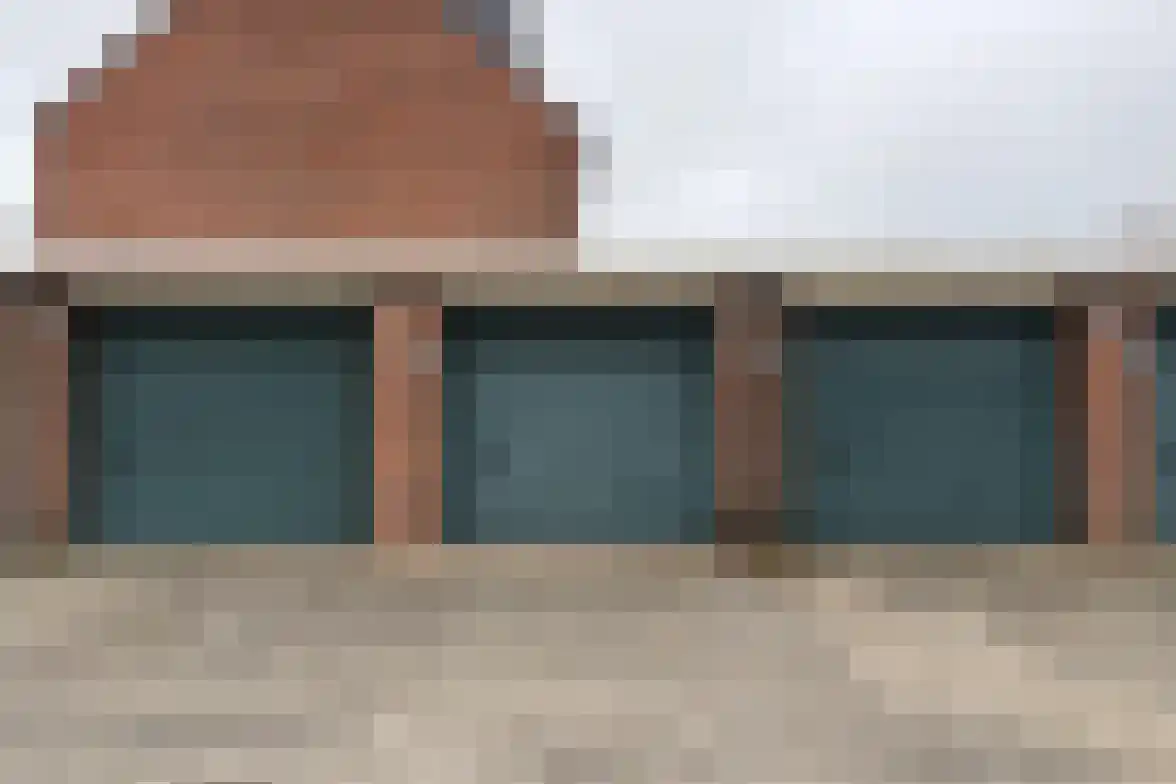
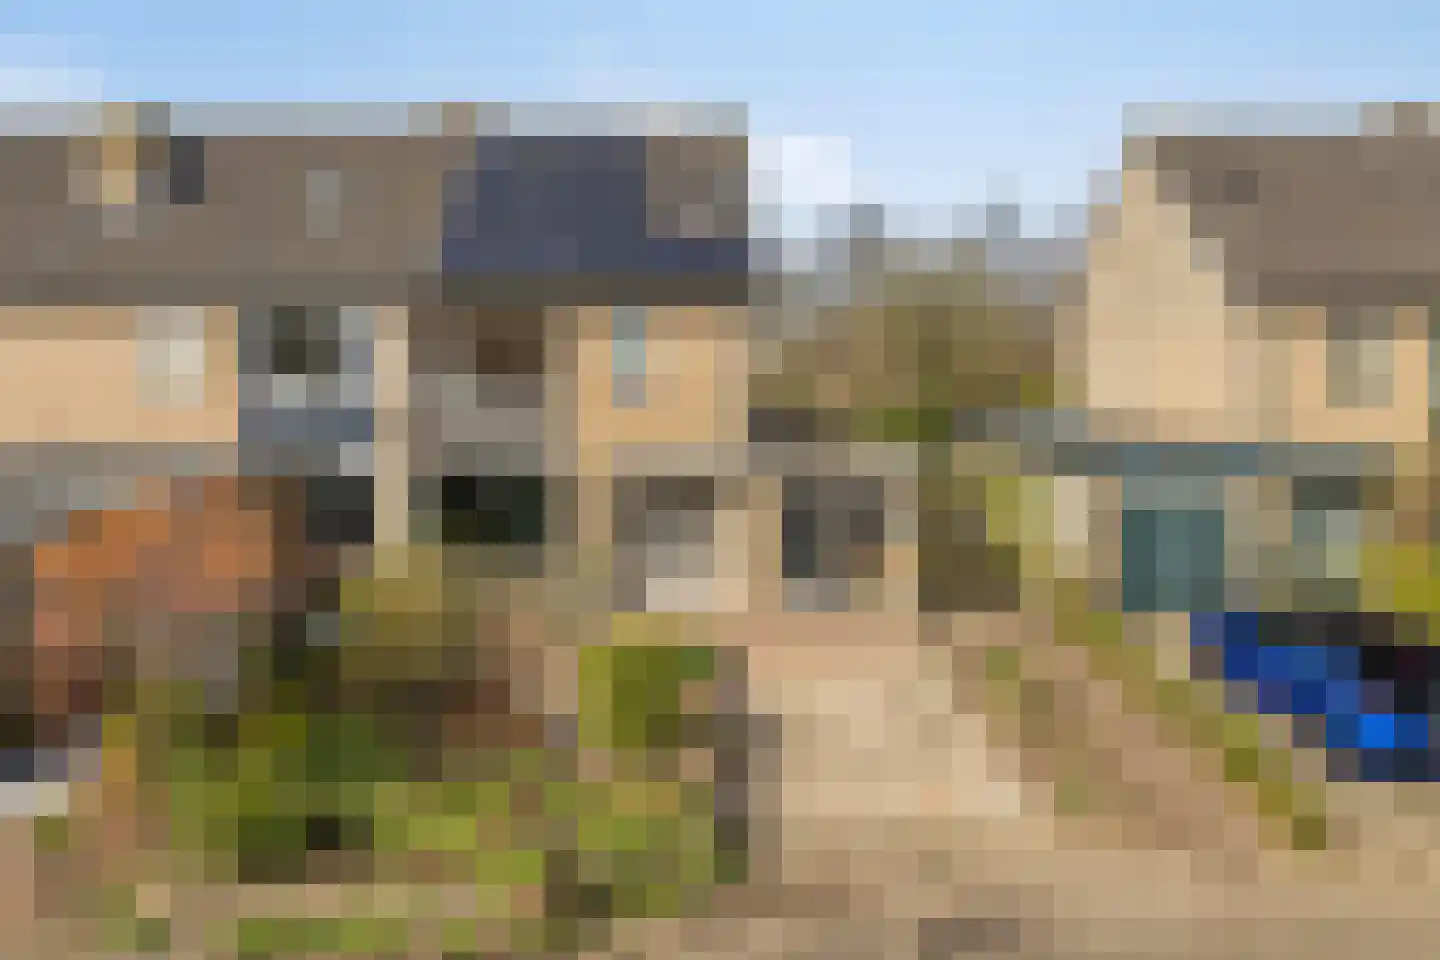
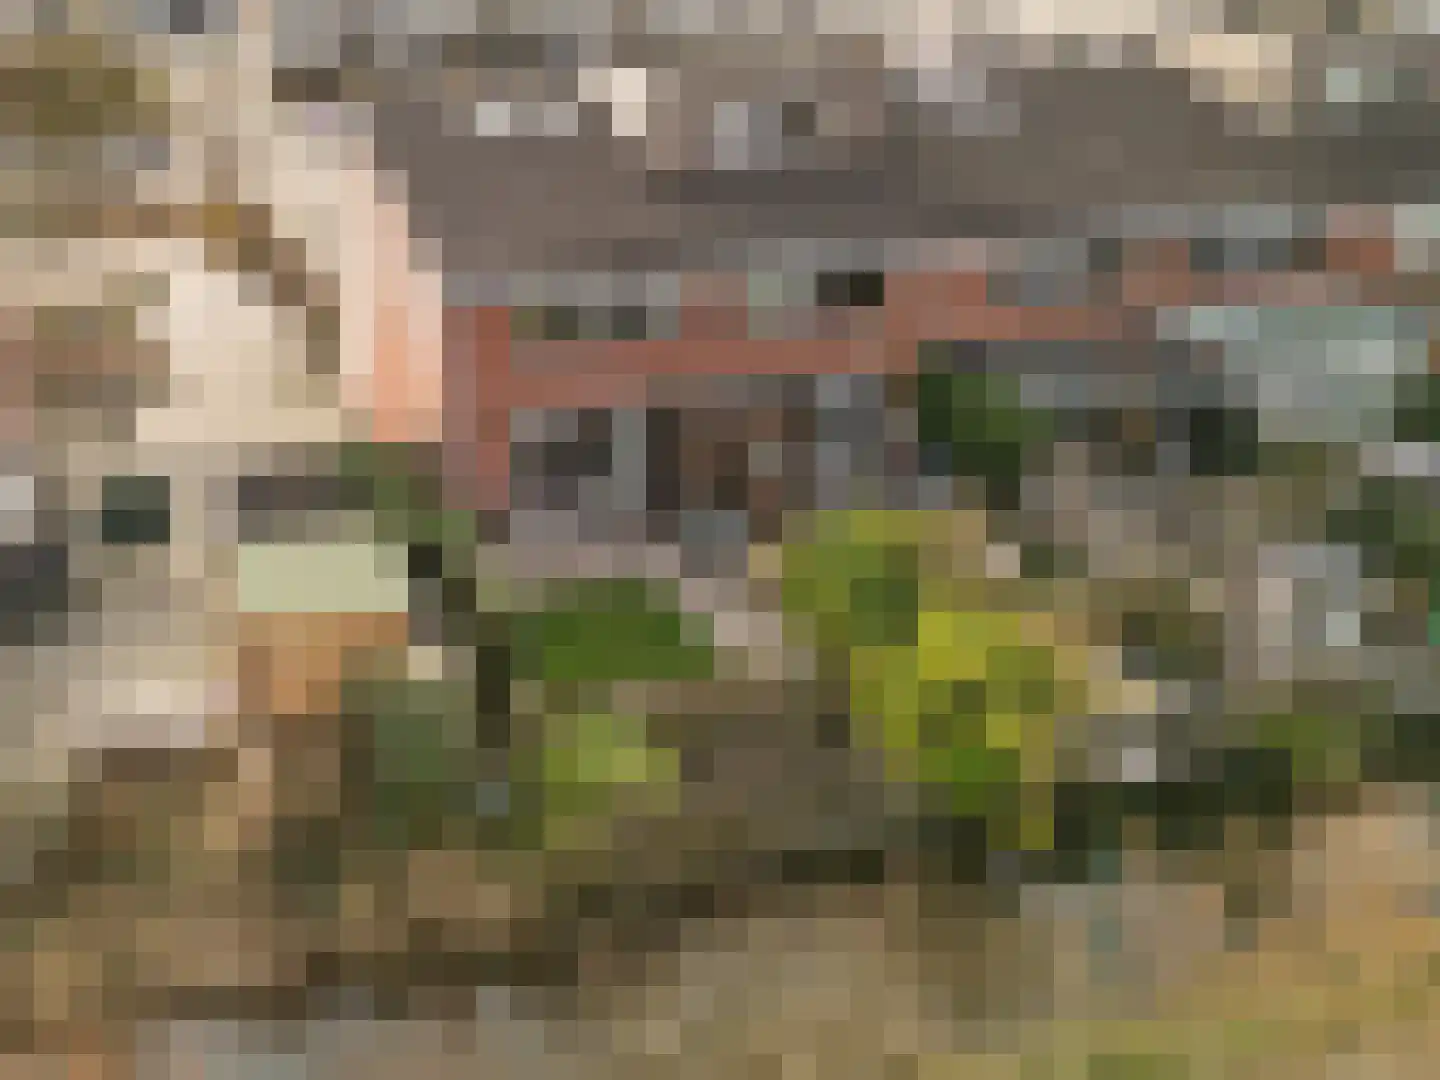
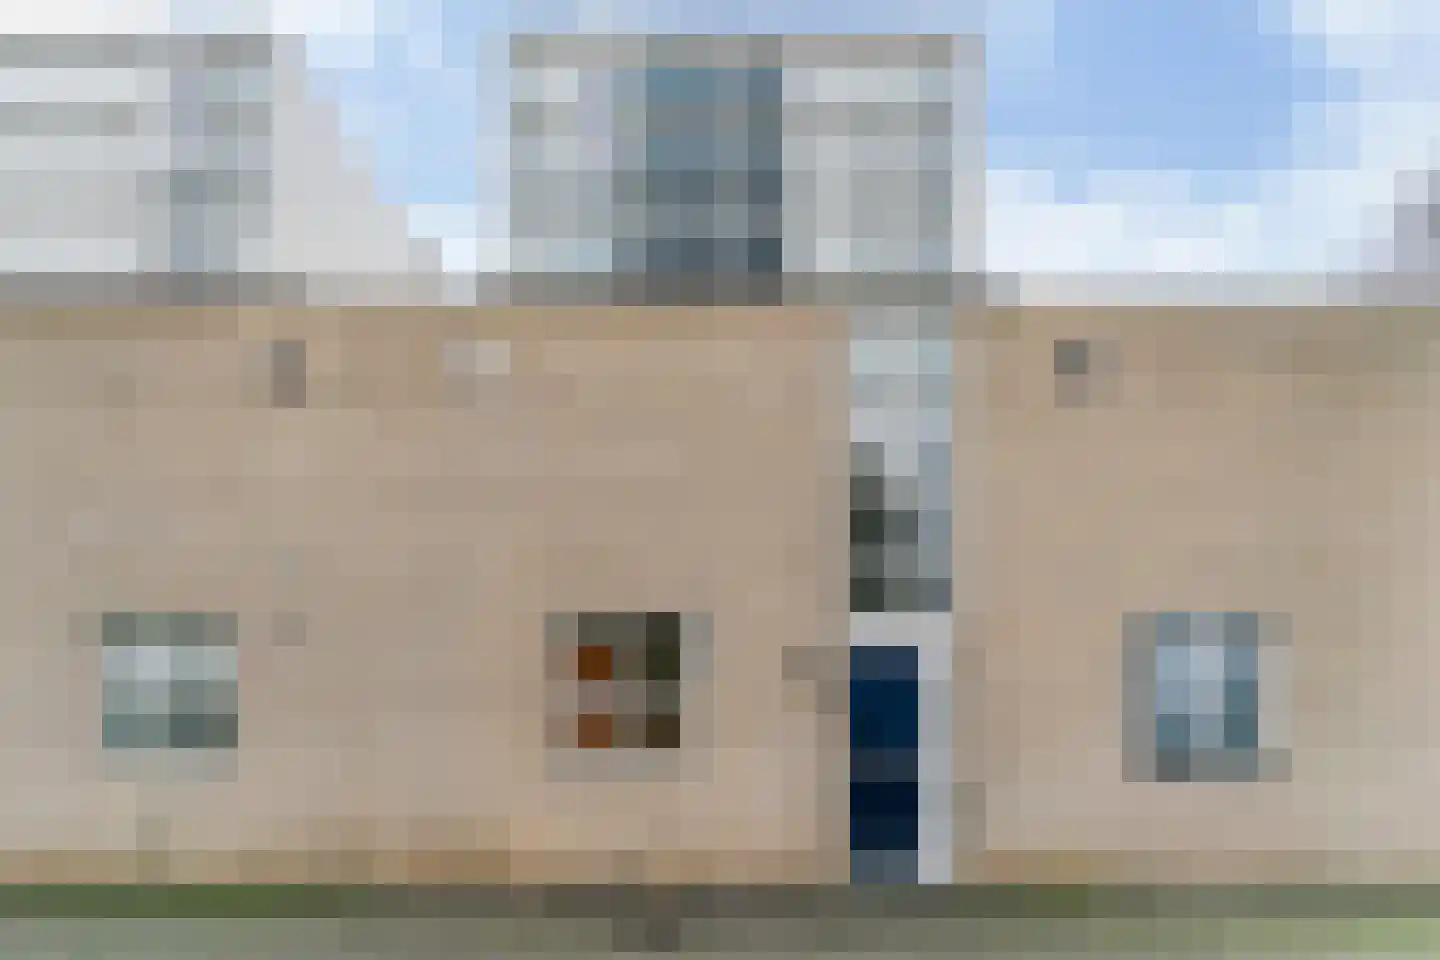
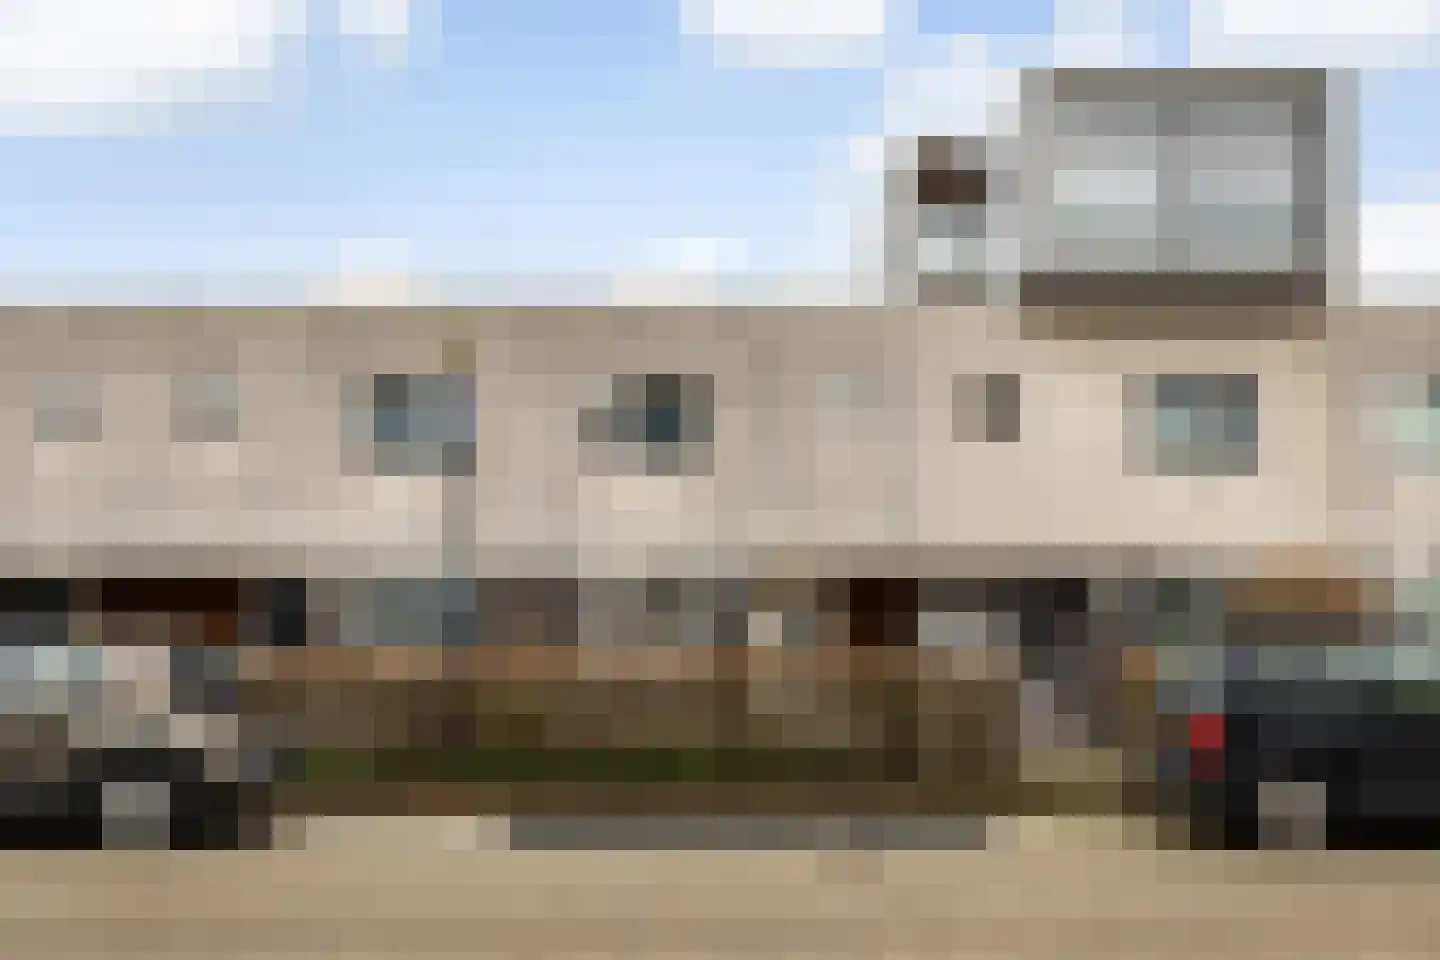
Houses sold in Woerden

View 389 sold houses in Woerden

Connected to: Vastgoed Nederland NVM Makelaars

On this page you will find recently sold homes in Woerden. Use this overview to better estimate selling prices, popular neighborhoods, and the local housing supply before you choose a real estate agent. Also view the current housing supply with 505 houses in Woerden.

Selection

Search and filter homes

Set your preferences and discover homes that suit you.

Total supply 241.423
Filters

Set price, area and other characteristics. Adjust a filter or click on Show homes. Location changes directly above.

Reset filters

You search for

  • Place Woerden
  • Status Sold

Huis verkopen in Woerden? Vergelijk verkoopmakelaars

Bekijk recente verkopen en ontvang gratis offertes van lokale verkoopmakelaars in Woerden.

Free request a quote

  • Quotes in Woerden
  • Non-binding
  • Personal
  • Gratis tarieven vergelijken

Recent verkocht in Woerden? Lees de verkoopgerichte gids huis verkopen in Woerden, vergelijk verkoopmakelaars in Woerden of bekijk de beste verkoopmakelaars in Woerden voor referentie bij jouw keuze.

Vergelijk meerdere offertes

Makelaars maken scherpere voorstellen als ze weten dat je vergelijkt — vraag offertes aan voor verkoop of aankoop.

Frequently asked questions about sold homes in Woerden

Short answers about housing prices, sold homes and comparing real estate agents in Woerden.

Residential and neighborhood statistics in Woerden

View current location data on residents, WOZ development, housing stock, energy consumption, business activity and safety in Woerden. In 2025 were there 39.445 residents. The average WOZ value in 2025 is EUR 426.601.

These figures help to better assess and compare the housing stock in Woerden with recent sold homes. Orient yourself then on suitable top real estate agents in Woerden for sales advice in this region.

Residents

39.445

Last year: 2025

Average WOZ

EUR 426.601

Last year: 2025

Average income per person.

EUR 36.693

Source: AllNumbers

Crimes (current year)

1.620

Total registered

Demographics and WOZ development

Inhabitants per year

Inhabitants per year in Woerden
Year Residents
2021 38.320
2022 38.490
2023 38.800
2024 39.325
2025 39.445

Annual WOZ value

WOZ value per year in Woerden
Year Average WOZ
2021 EUR 318.312
2022 EUR 346.230
2023 EUR 397.354
2024 EUR 403.570
2025 EUR 426.601

Composition of residents

Age build-up

65+: 7.730 0-15: 6.550 15-25: 4.770 25-45: 9.750 45-65: 10.635

Education level

Hoger

11.370

Praktisch

6.700

Middelbaar

11.010

Origin of residents (2025)

Europa

2.265

Nederland

30.655

Buiten Europa

6.500

Housing stock and construction periods

Types of homes

Hoekwoningen 2.687
Appartementen 6.253
Tussenwoningen 6.780
Vrijstaande woningen 1.060
Twee-onder-één-kap woningen 867

Construction period of buildings

Voor 1700 22
1700 tot 1900 527
1900 tot 1925 542
1925 tot 1950 970
1950 tot 1970 2.630
1970 tot 1980 2.578
1980 tot 1990 2.026
1990 tot 2000 2.356
2000 tot 2010 864
2010 tot 2020 899
2020 en later 295

Energy and sustainability

Energy label distribution

Label A

5.571

Label C

4.448

Label B

3.352

Label D

1.125

Label G

865

Label F

780

Label A+++

666

Label E

605

Label A+

431

Label A++

287

Label A++++

21

Label A+++++

15

Average energy consumption per year

Average energy consumption per year in Woerden
Year Gas (m3) Electricity (kWh)
2020 1.076 2.749
2021 1.203 2.801
2022 929 2.618
2023 802 2.464
2024 768 2.490

Consumption per house type

Hoekwoning

Gas: 953 • Electricity: 2.733

Huurwoning

Gas: 629 • Electricity: 1.914

Koopwoning

Gas: 902 • Electricity: 2.771

Appartement

Gas: 544 • Electricity: 1.785

Tussenwoning

Gas: 823 • Electricity: 2.554

Vrijstaande woning

Gas: 1.502 • Electricity: 4.167

Twee-onder-één-kap woning

Gas: 1.150 • Electricity: 3.141

Business activity in Woerden (2025)

Handel en HORECA 1.015
Nijverheid en energie 750
Zakelijke dienstverlening 1.710
Overheid, onderwijs en zorg 990
Landbouw, bosbouw en visserij 45
Vervoer, informatie en communicatie 525
Financiele diensten en onroerendgoed 365
Cultuur, recreatie en overige diensten 580

Total number of company establishments: 5.980

Recent crime statistics

Recent crime statistics in Woerden
Period Crimes
jan 2025 112
jan 2026 149
jul 2025 138
jun 2025 128
mei 2025 143
mrt 2025 145
nov 2024 155
nov 2025 142
okt 2024 146
okt 2025 129
sep 2024 113
sep 2025 157

These figures give an indicative picture of safety trends in the living environment of Woerden.

Frequently asked questions about living in Woerden

Short answers based on current local statistics, handy for a quick comparison of the living environment.

Hoeveel inwoners heeft Woerden?

Woerden telt in 2025 ongeveer 39.445 inwoners.

Wat is de gemiddelde WOZ-waarde in Woerden?

De gemiddelde WOZ-waarde in Woerden is in 2025 circa € 426.601.

Wat is het gemiddelde inkomen per inwoner in Woerden?

Het gemiddelde inkomen per inwoner in Woerden ligt rond € 36.693 per jaar.

Hoe veilig is wonen in Woerden?

Voor het huidige jaar gaat het om ongeveer 1.620 geregistreerde misdrijven. Gebruik deze cijfers als indicatie en vergelijk trends per periode.

Welke woningtypen komen het meest voor in Woerden?

In Woerden komt vooral "Tussenwoningen" veel voor, met ongeveer 6.780 woningen.

Gratis vrijblijvende offertes ontvangen

Vergelijk meerdere makelaars en kies de beste match.