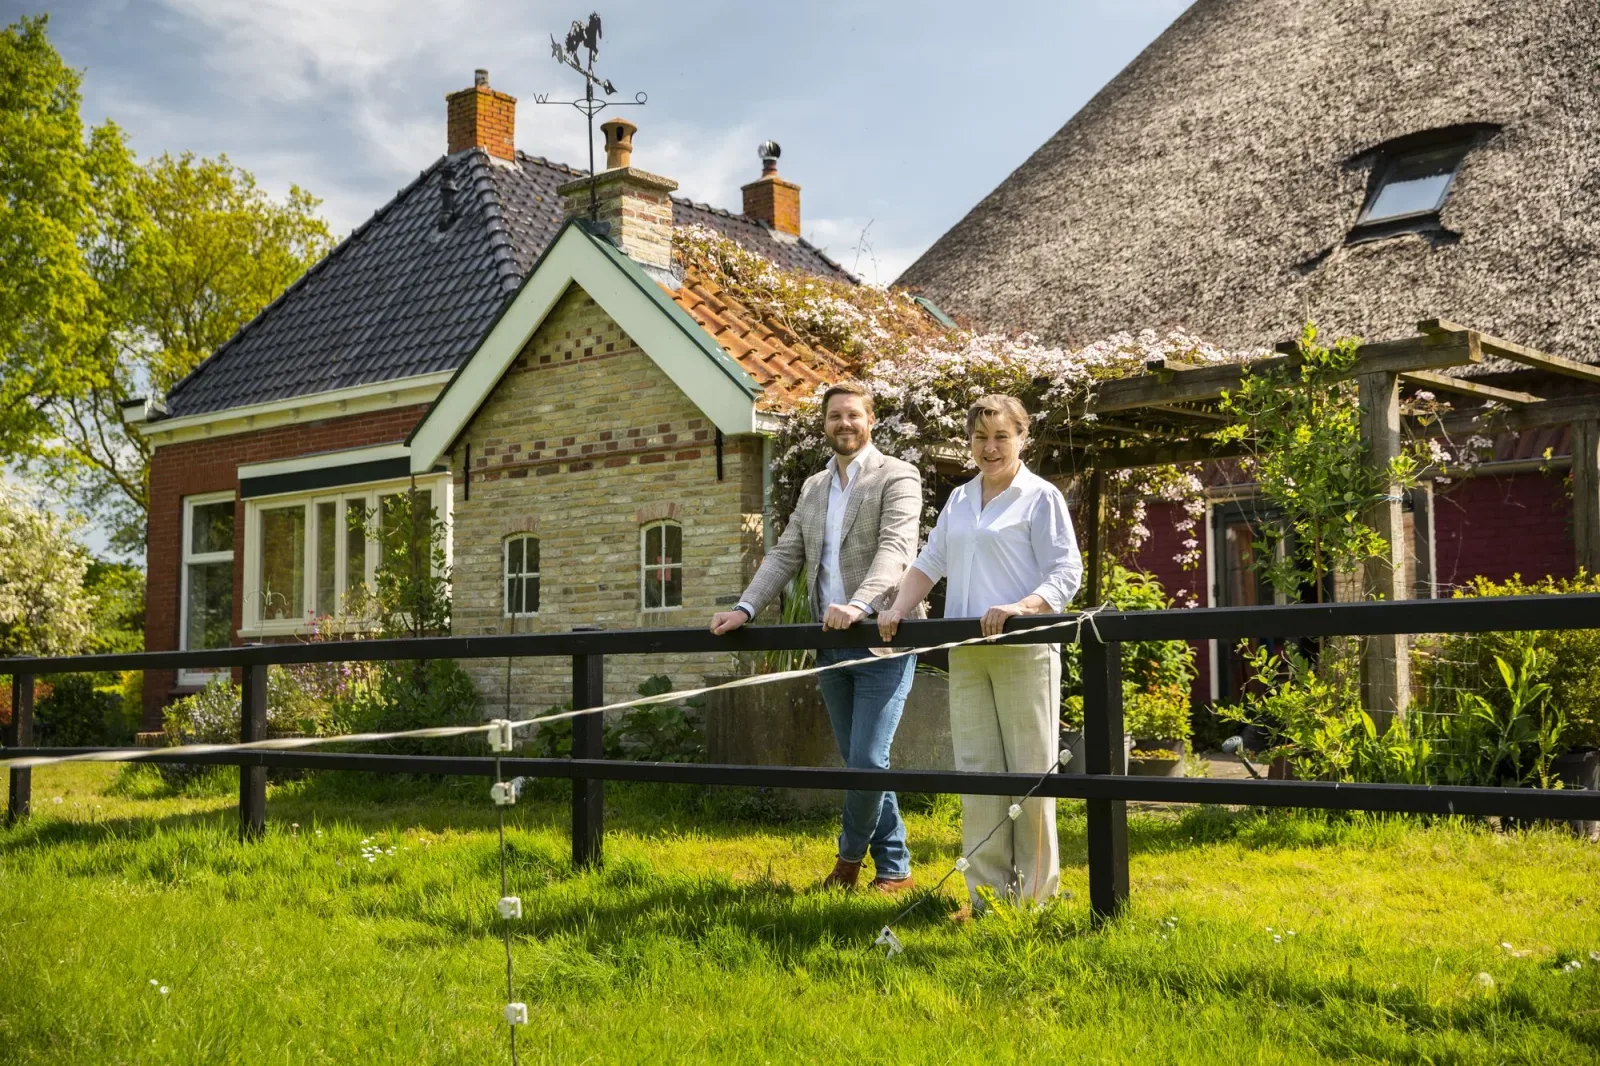
Mijn Buitenplaats Makelaardij & Hendriksma.nl
In Terwispel, Mijn Buitenplaats Makelaardij & Hendriksma.nl offers reliable and personal real estate services. We combine knowledge of the region with a customer-oriented approach to map out your wishes. Whether you are buying, selling or renting: we are ready for you with suitable solutions. We offer service in sales, purchase, rental and valuations. Our way of working is transparent and focused on your benefit, with expertise supporte...
Current housing stock
-

- Available
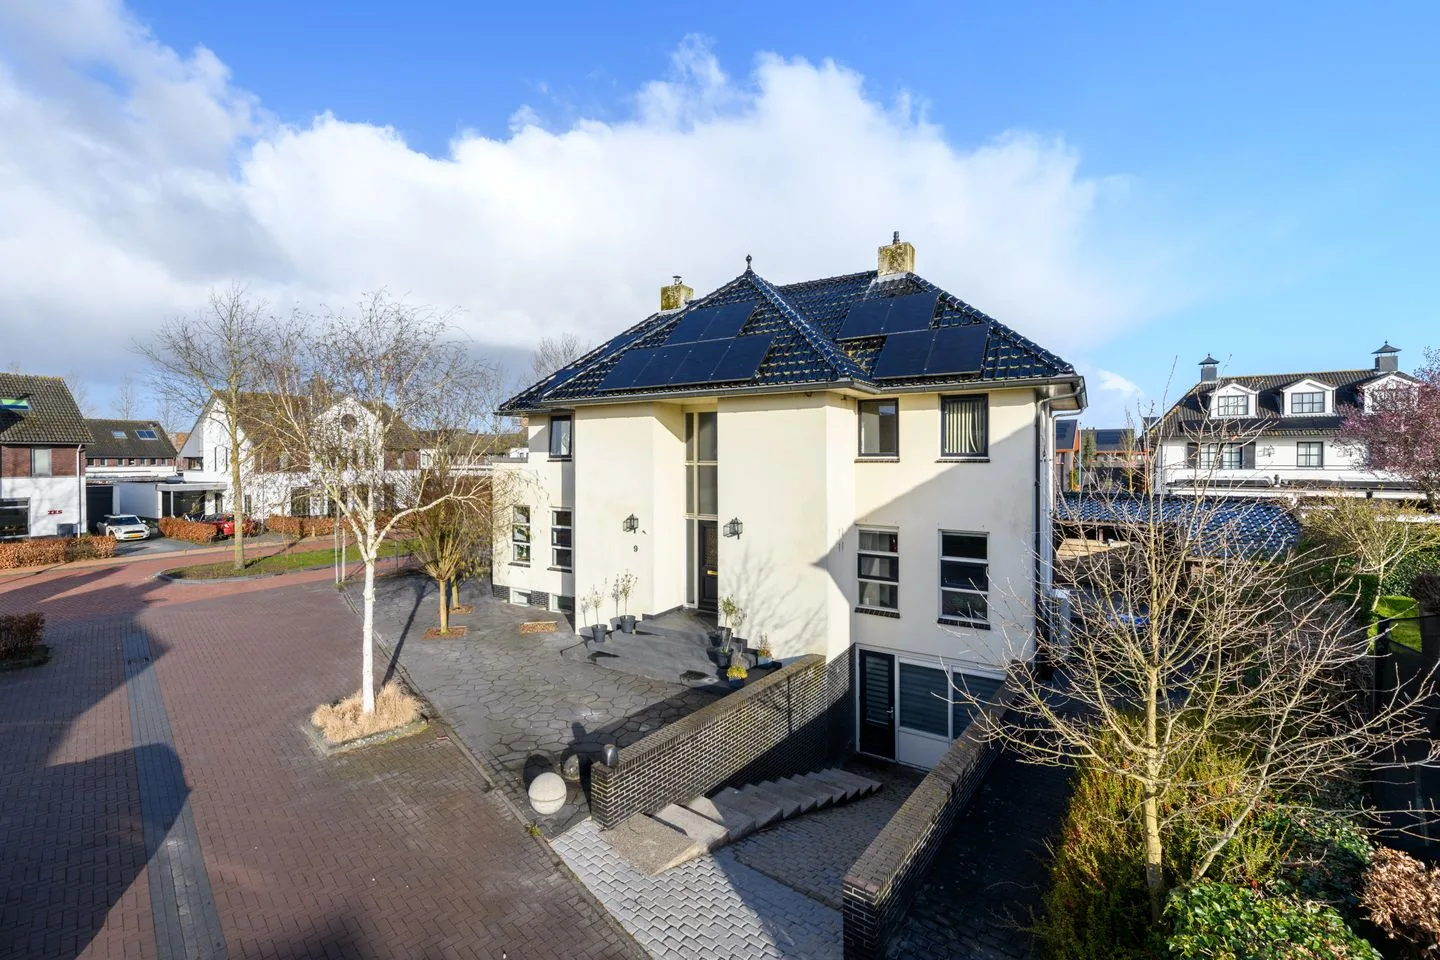
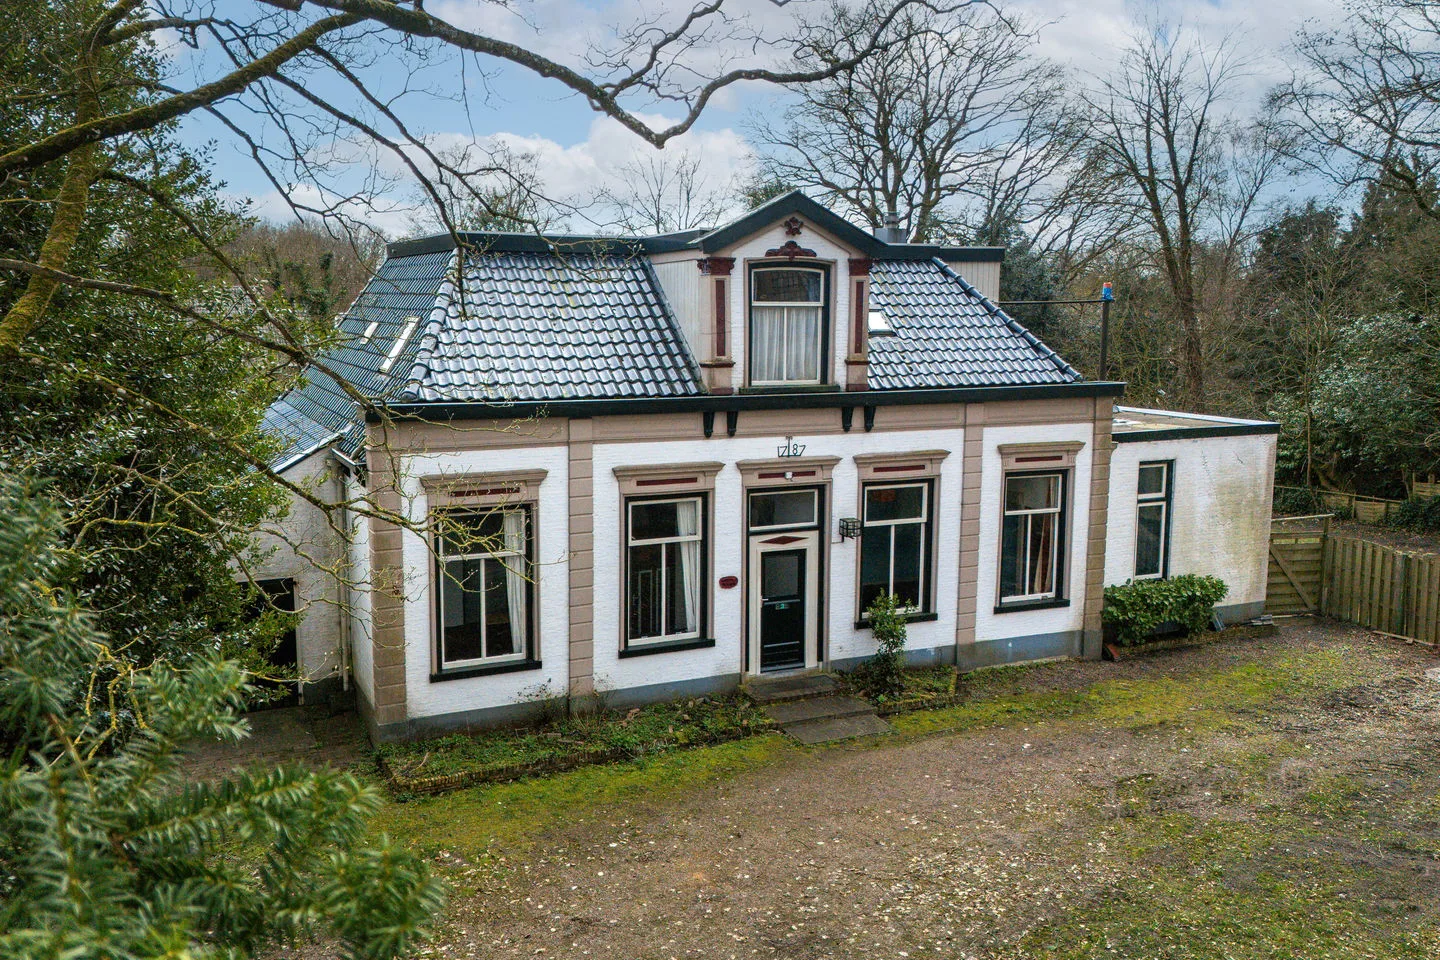
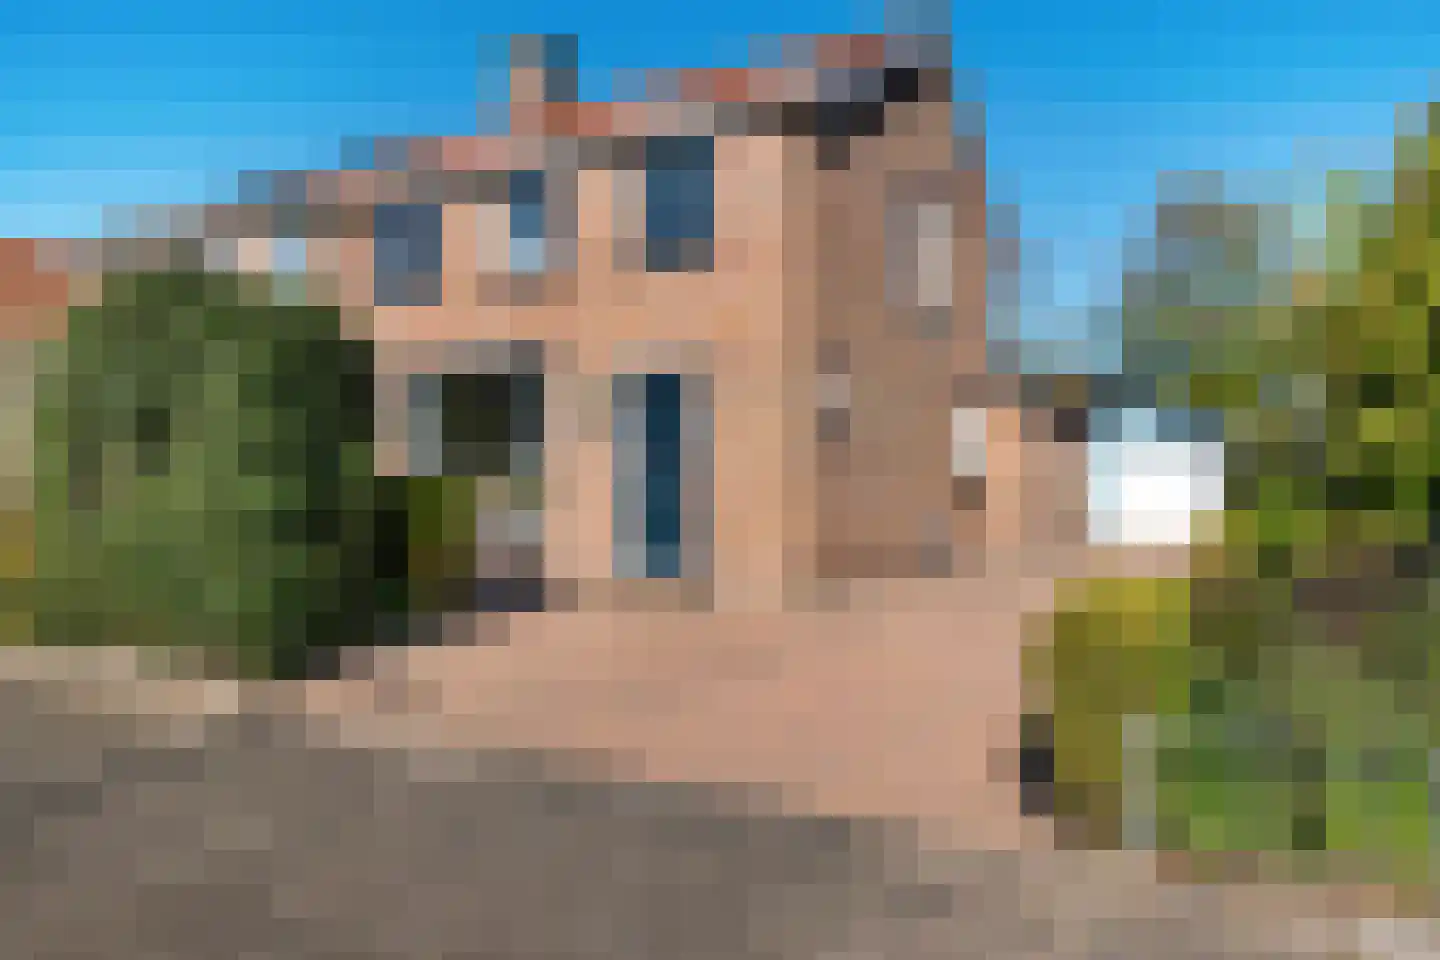
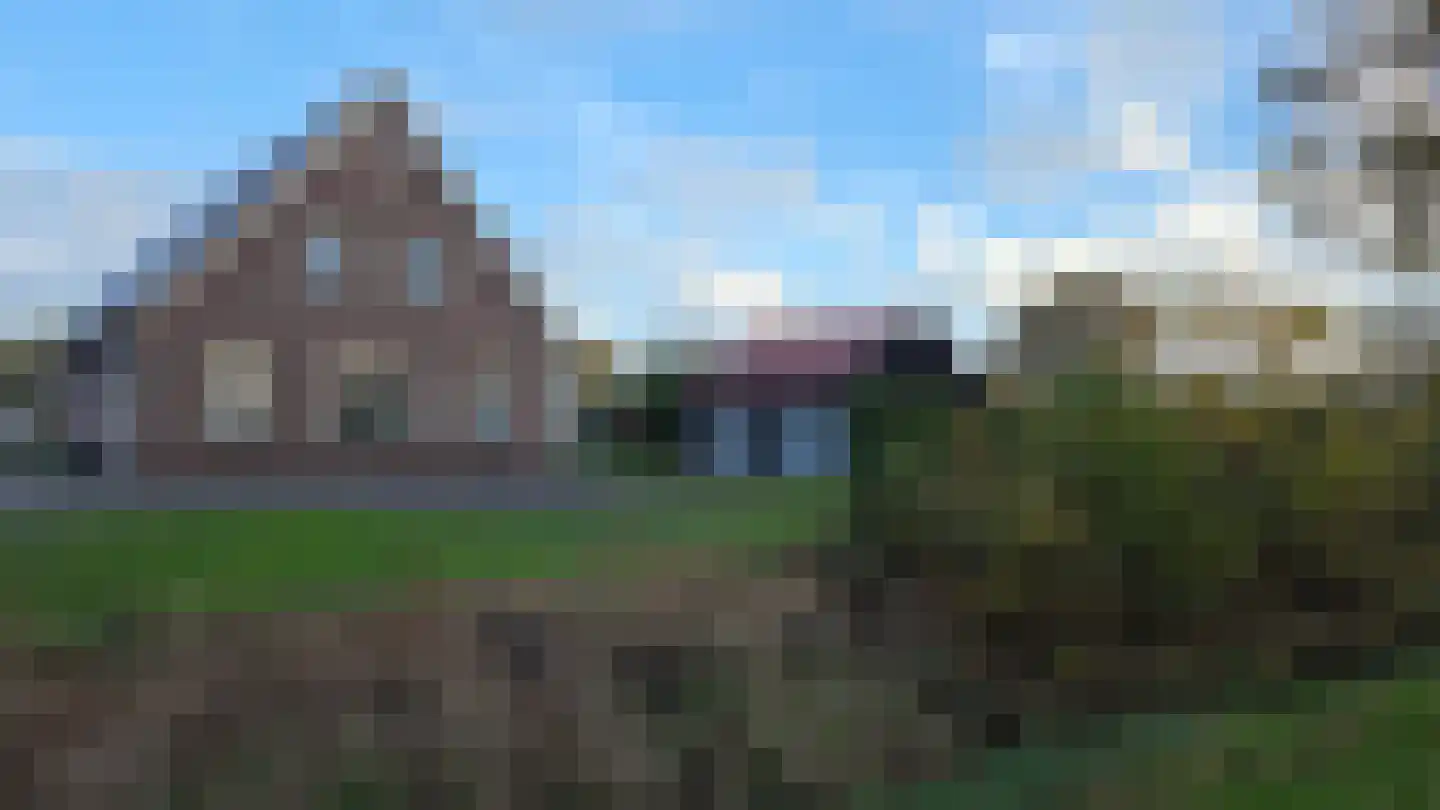
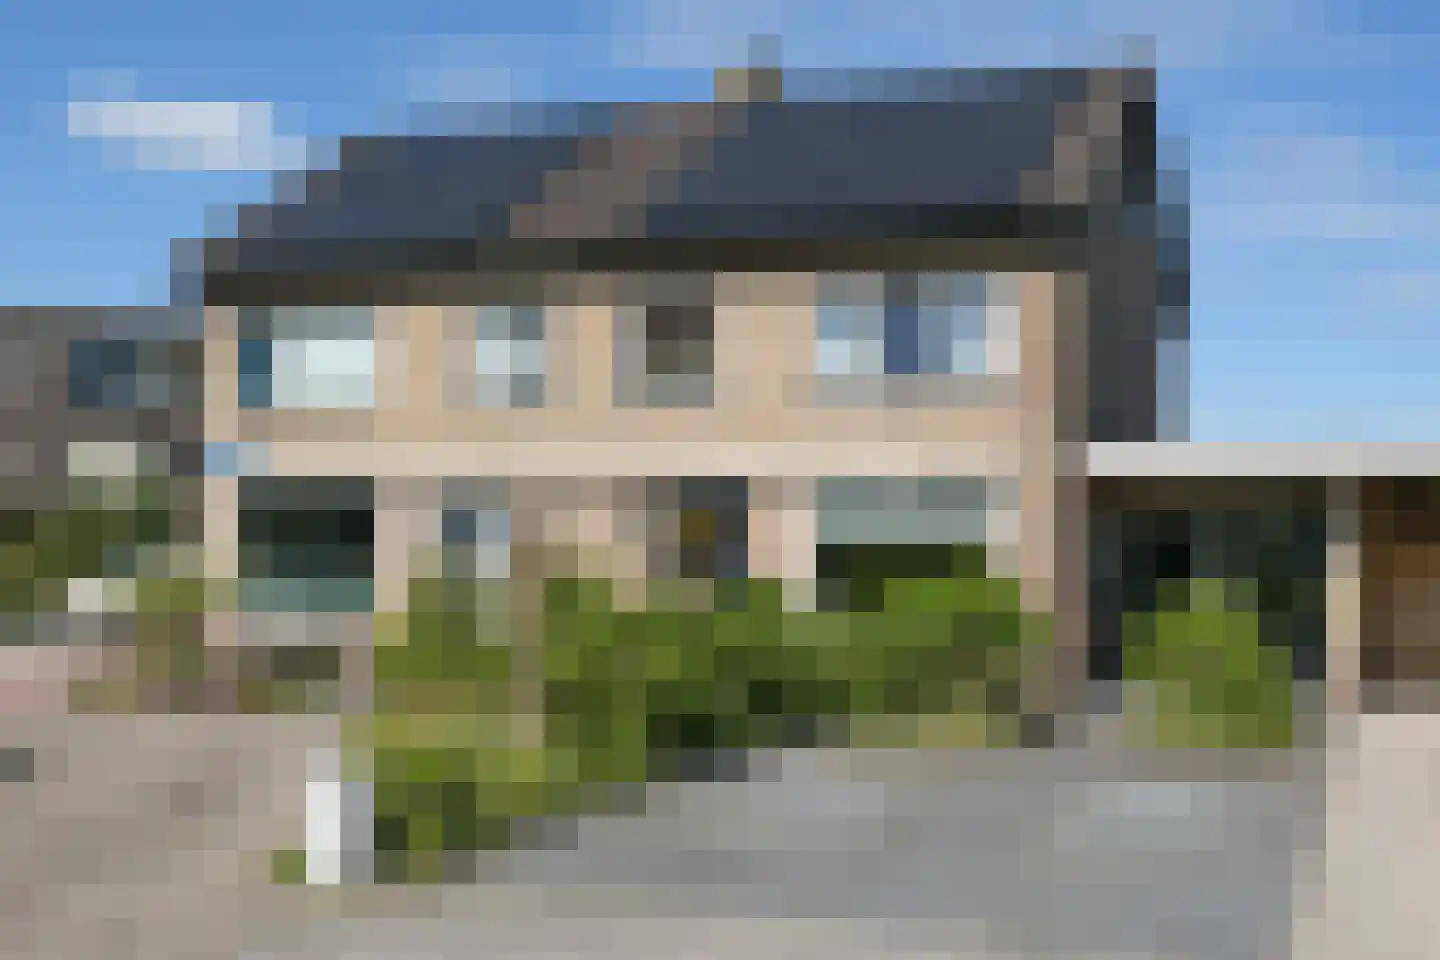
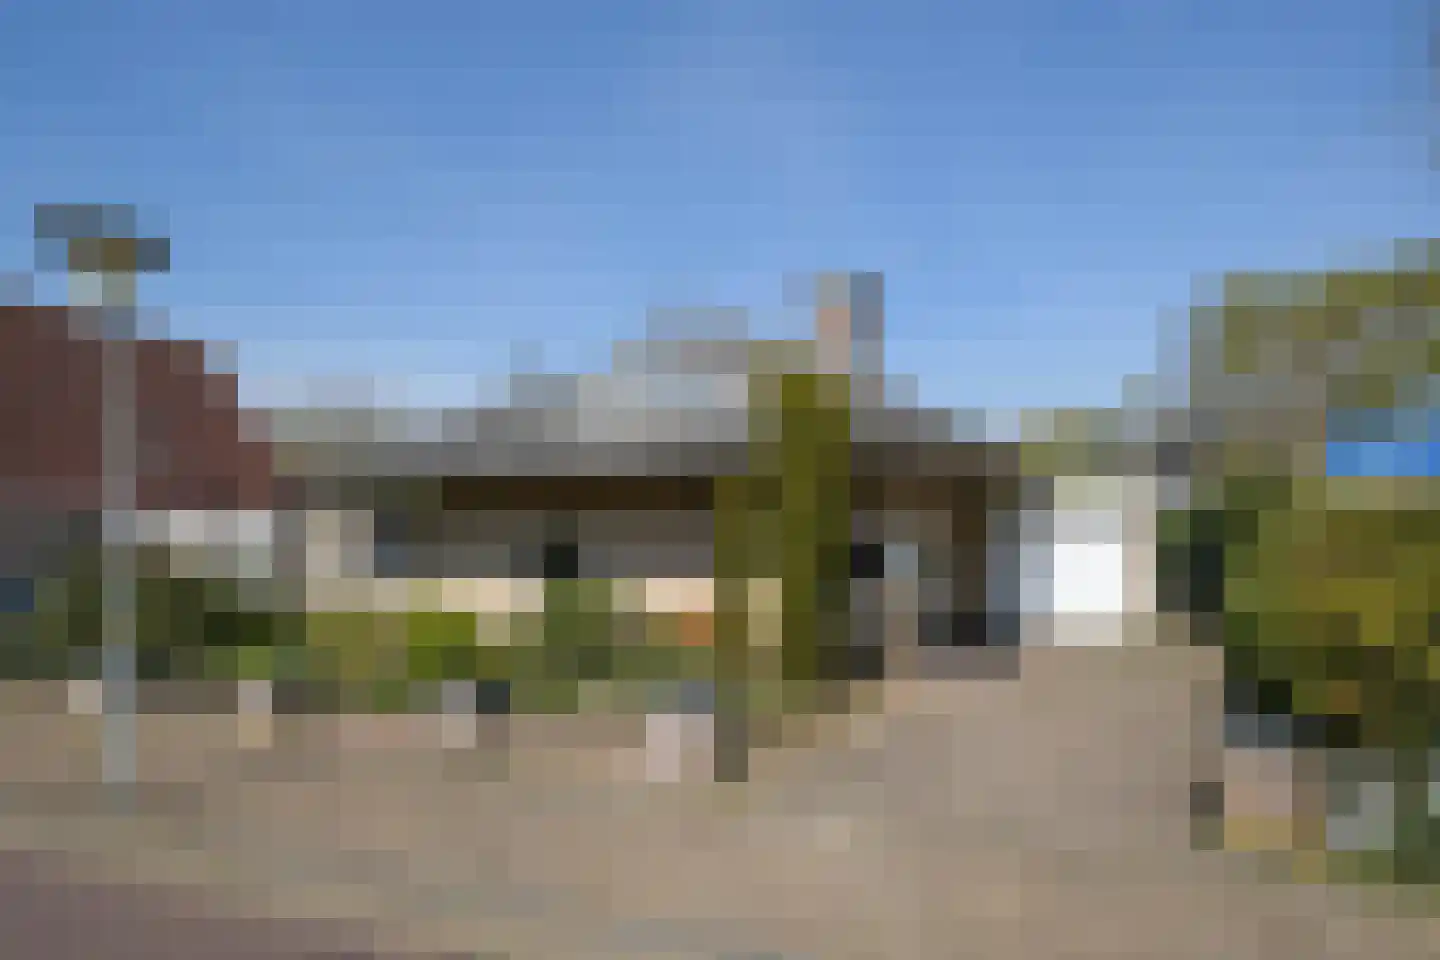
Riperwâlden 3
8406ET Tijnje
€ 669.000 k.k.
CSave as favorite- Living area
- 238 m²
- Land area
- 9970 m²
- Bedrooms
- 5
-
- Sold subject to confirmation
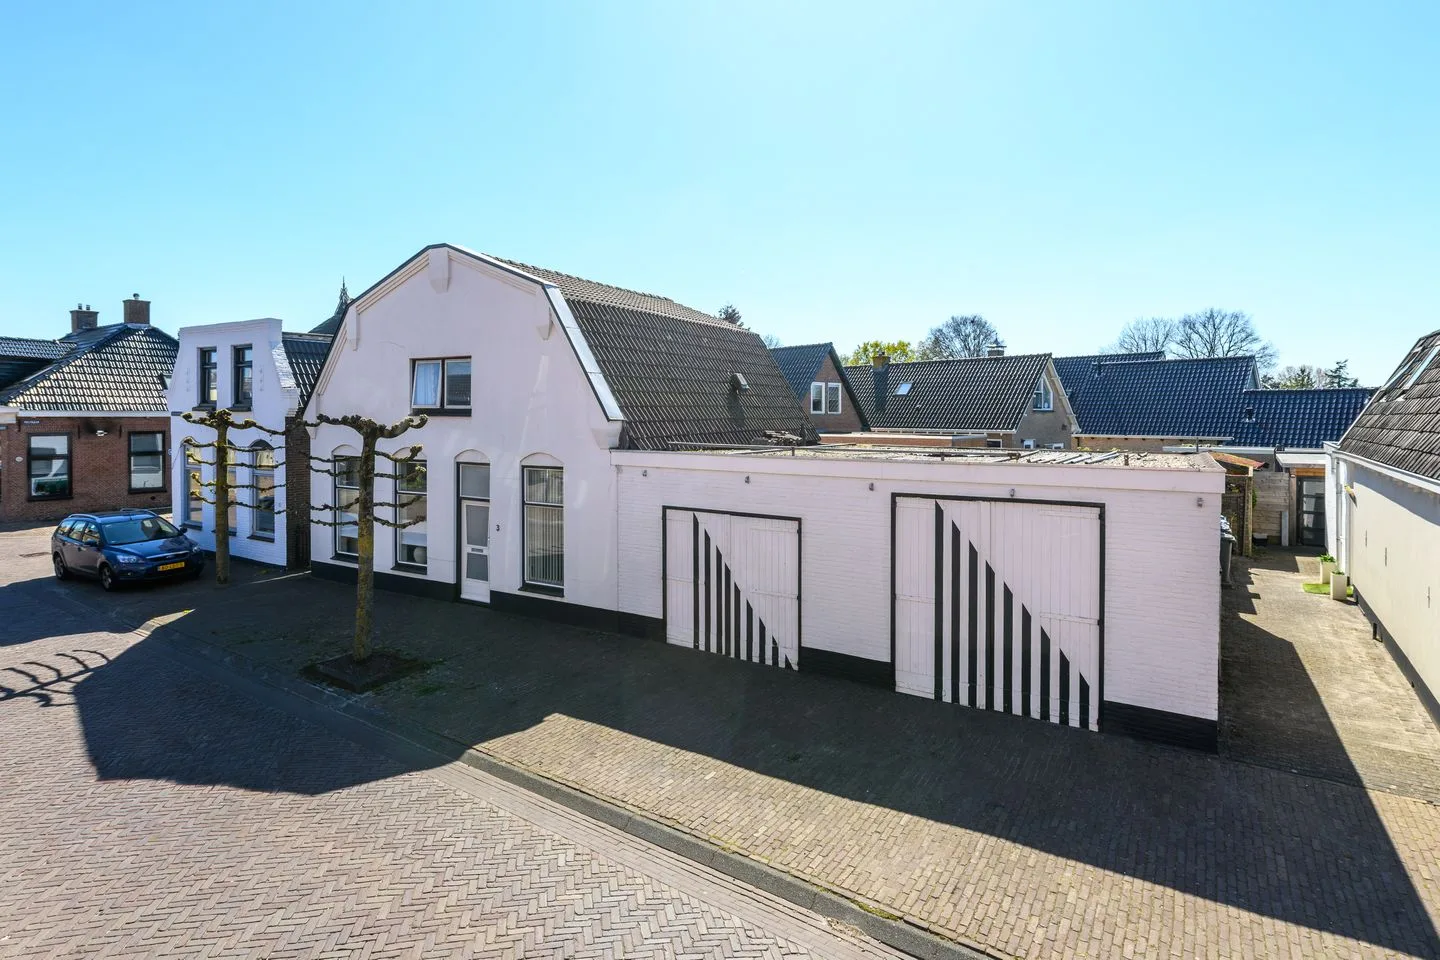
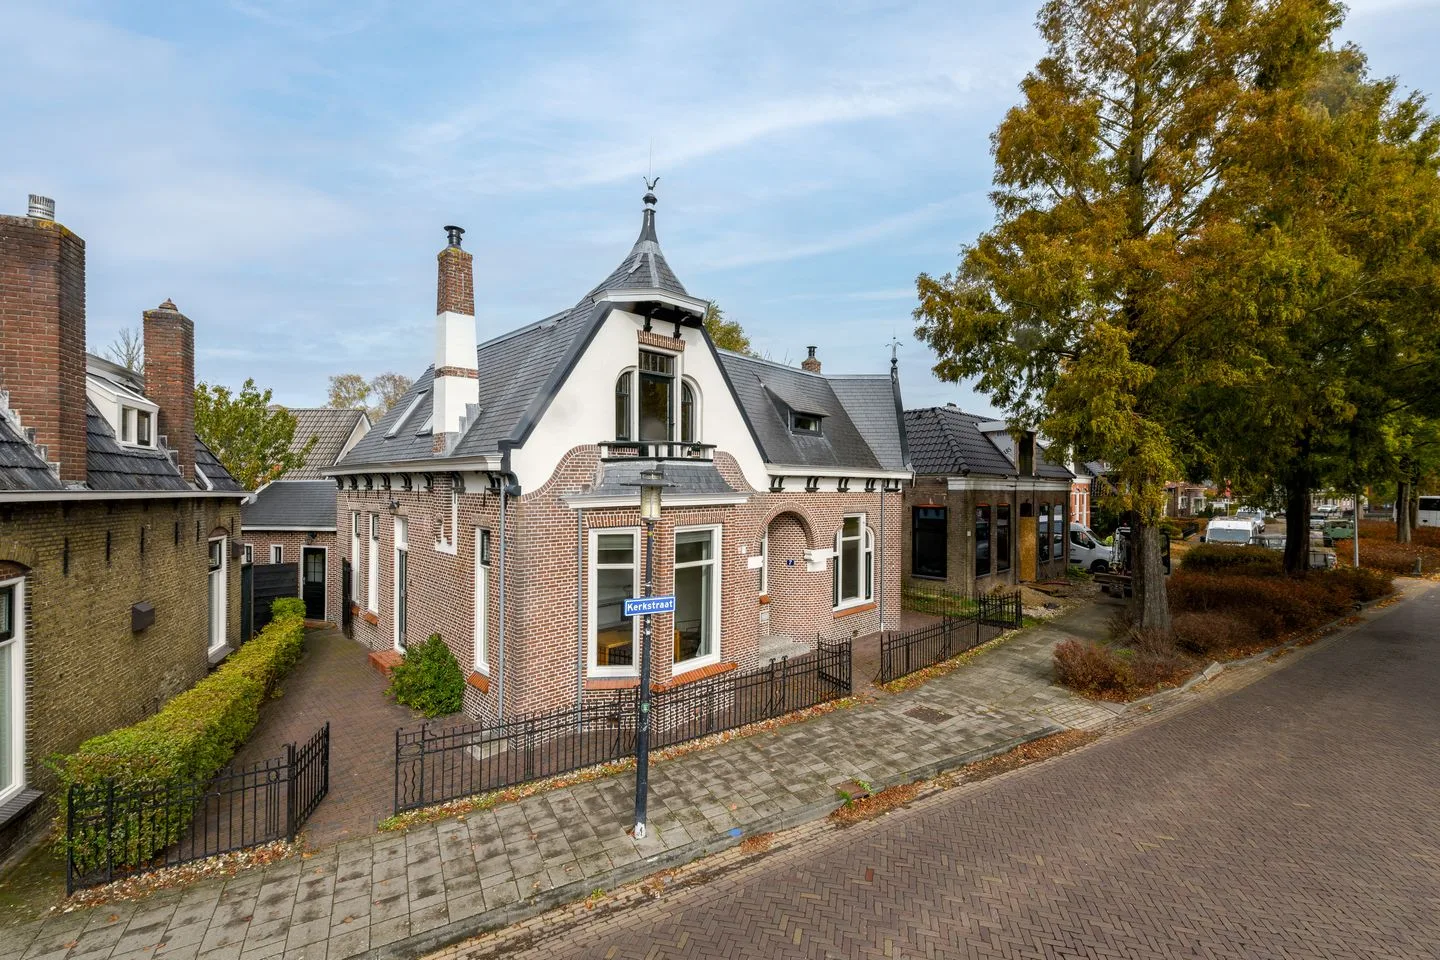
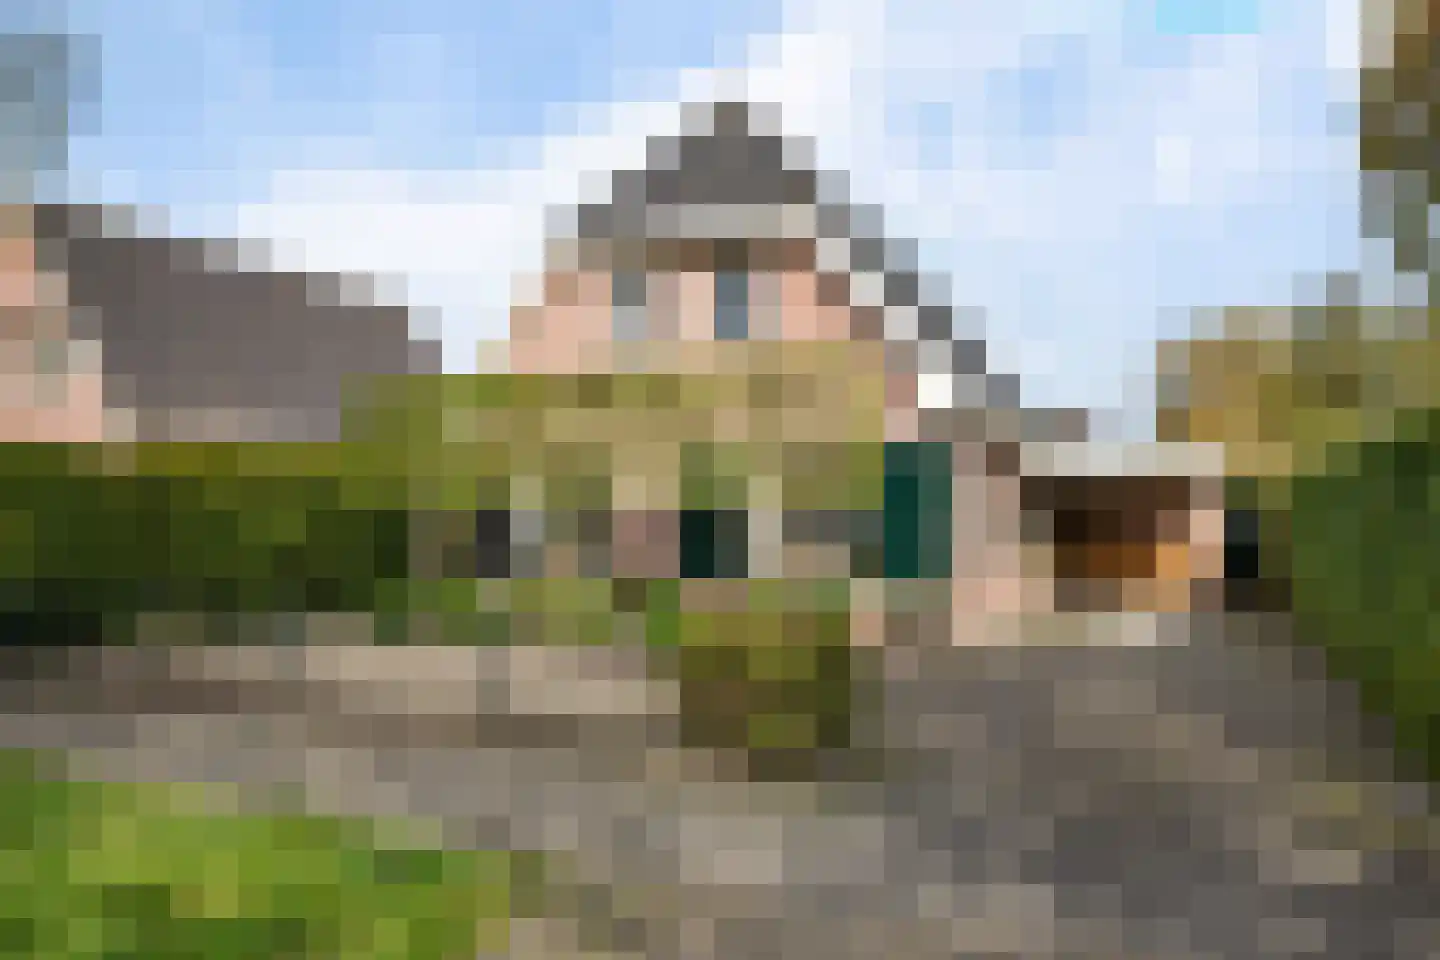
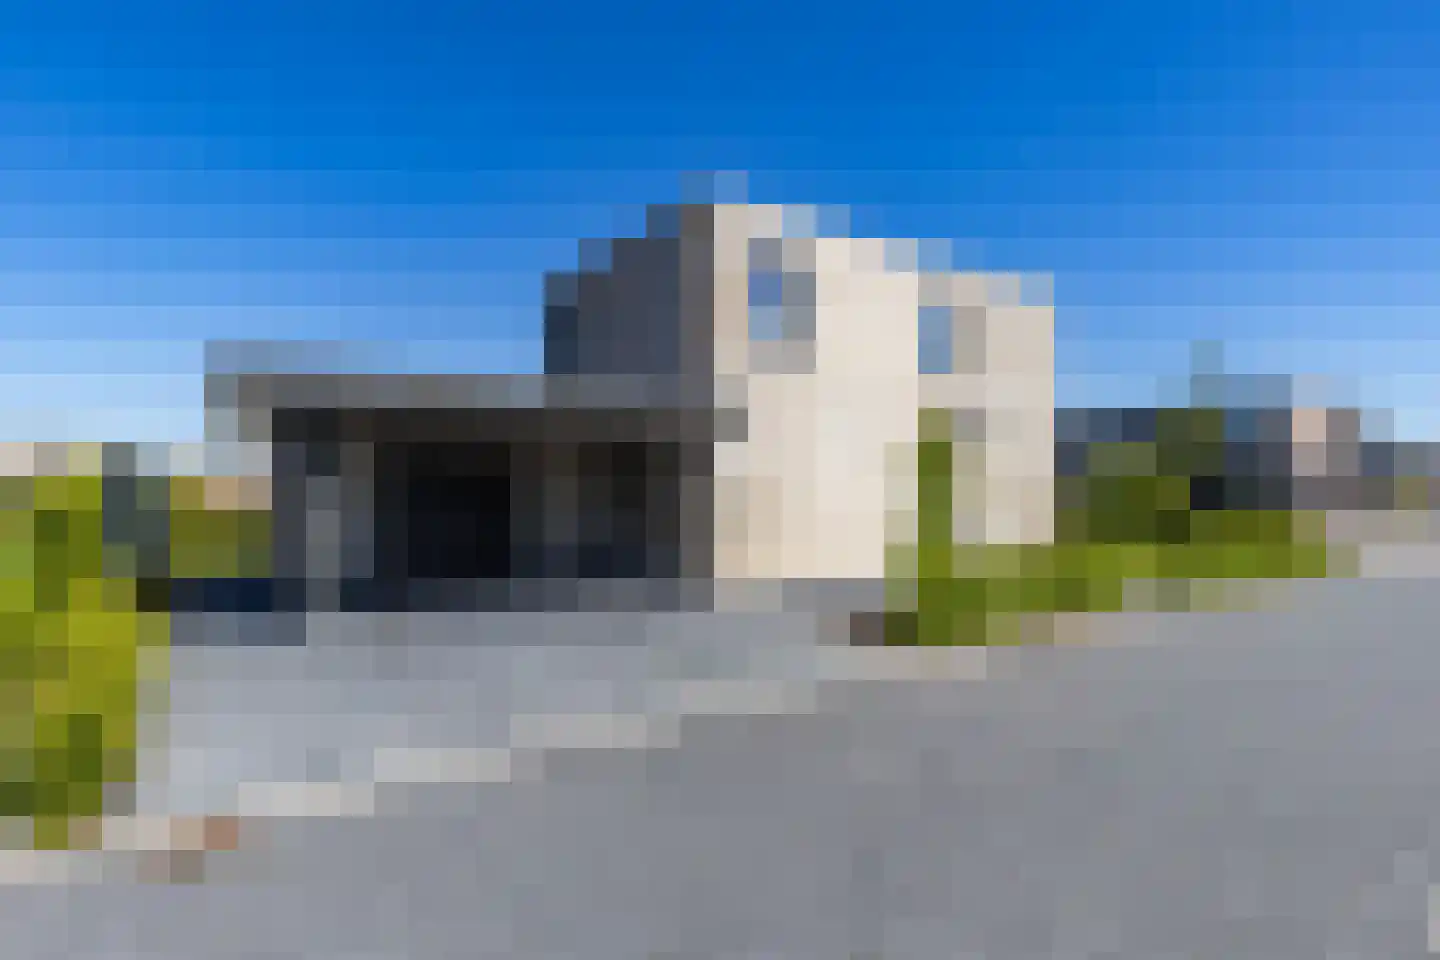
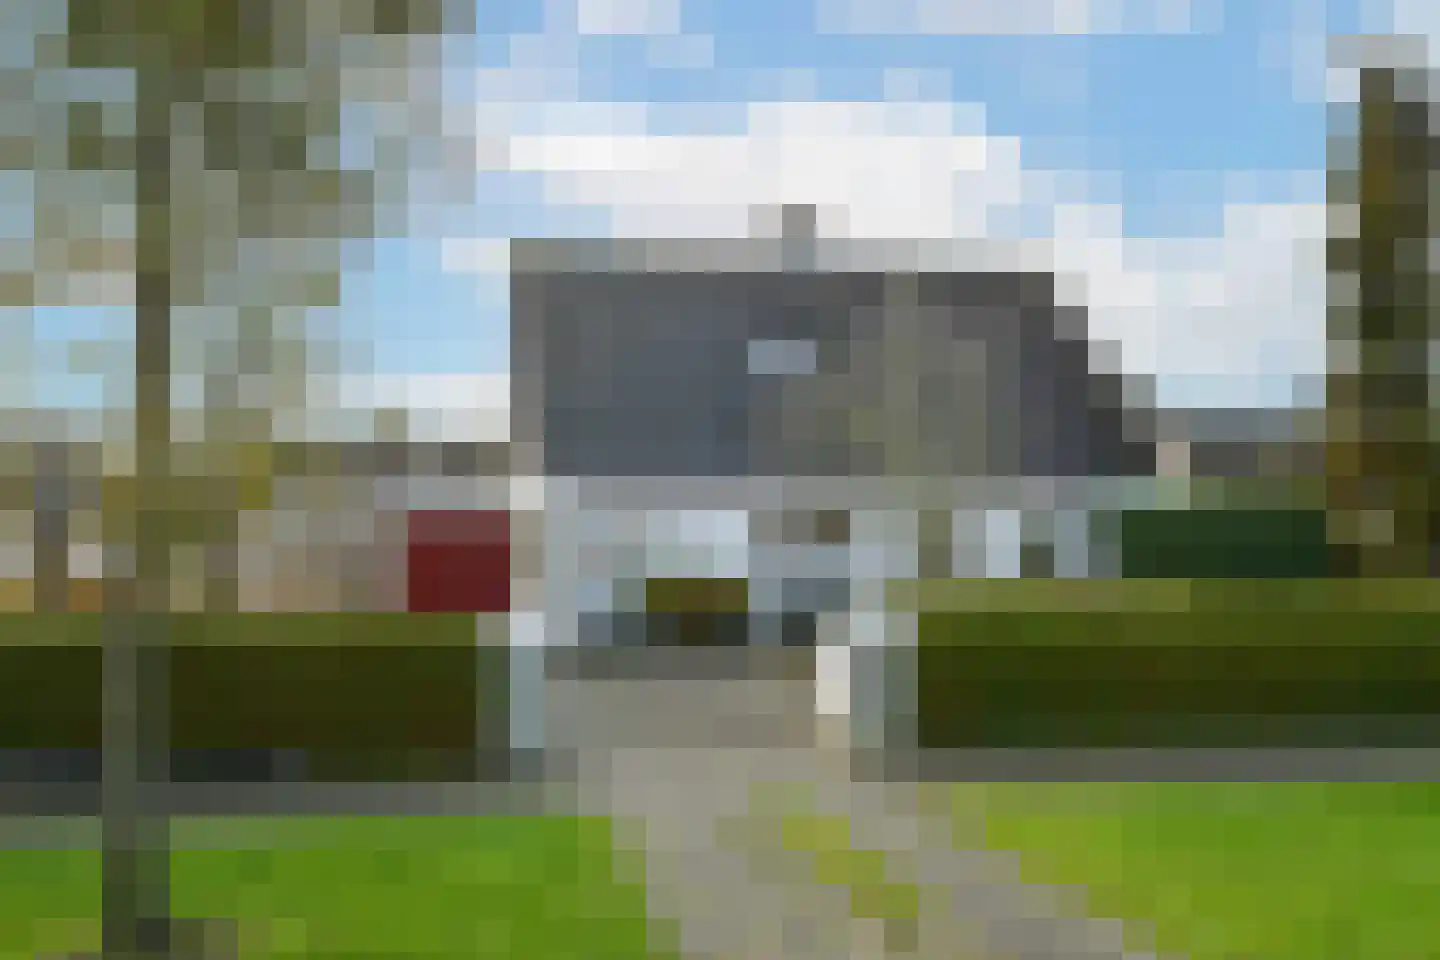
Achterom 16
8495JE Aldeboarn
€ 295.000 k.k.
€ 4.683/m²
GSave as favorite- Living area
- 63 m²
- Land area
- 209 m²
- Bedrooms
- 2
-
- Sold subject to confirmation
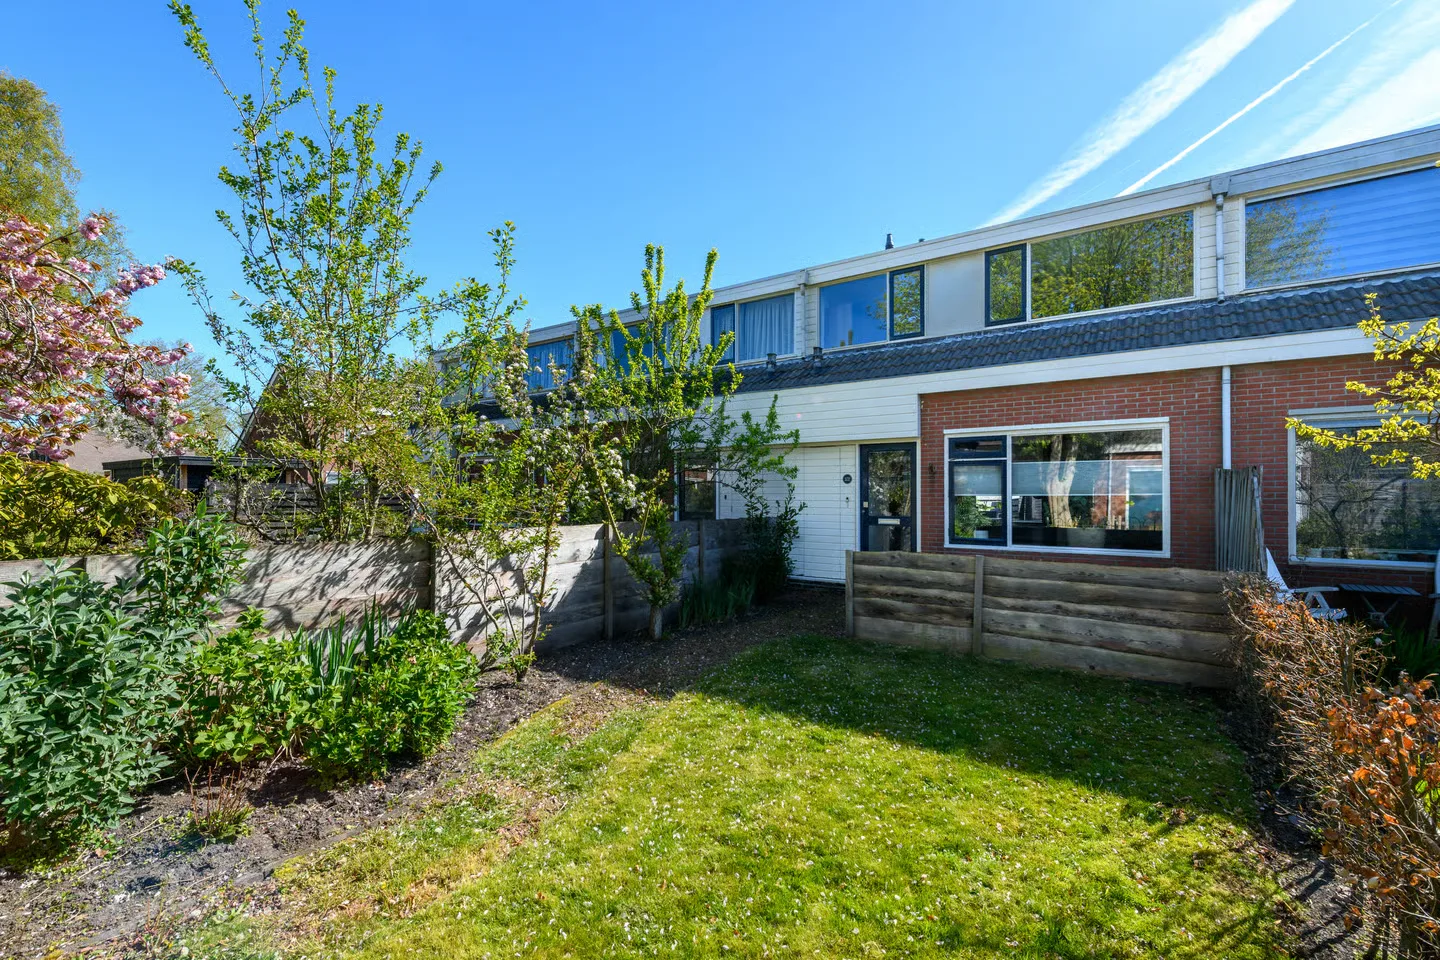
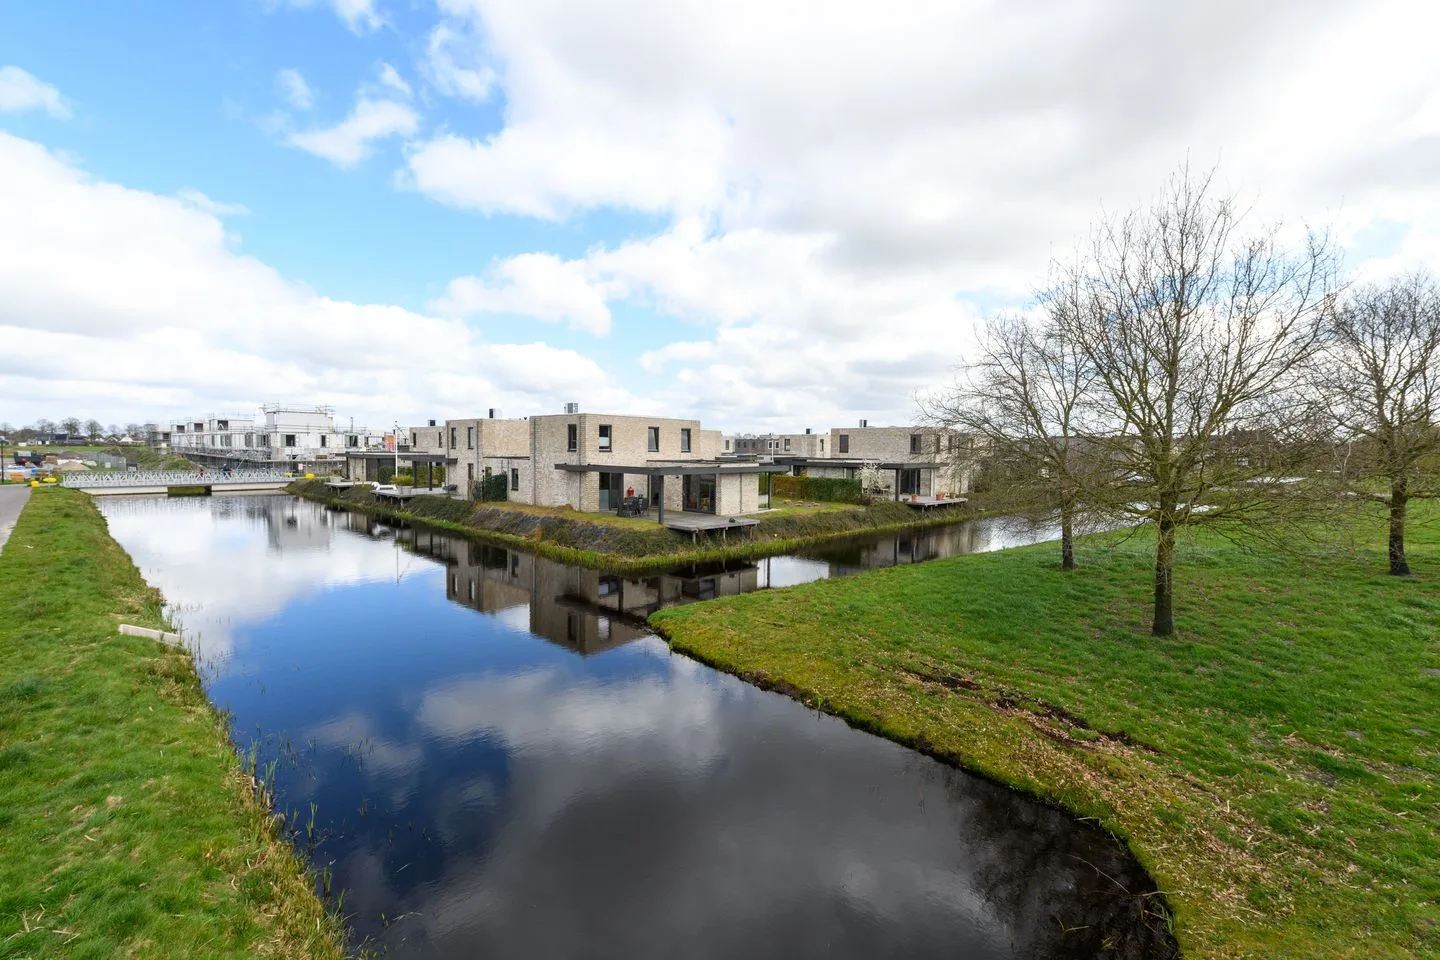
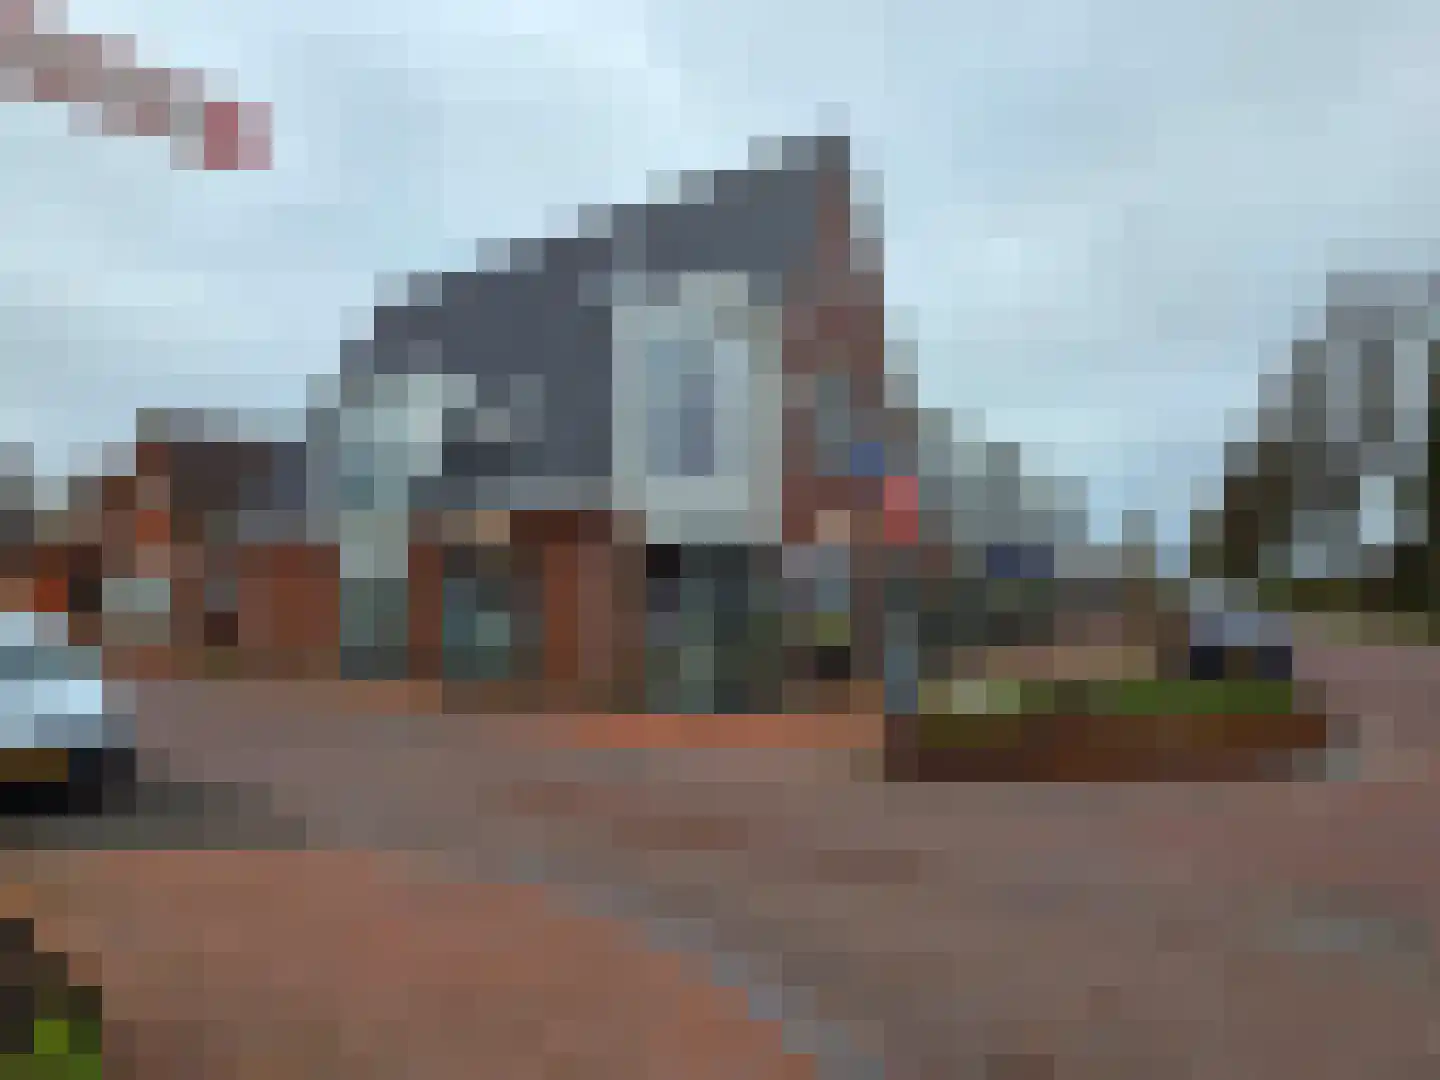
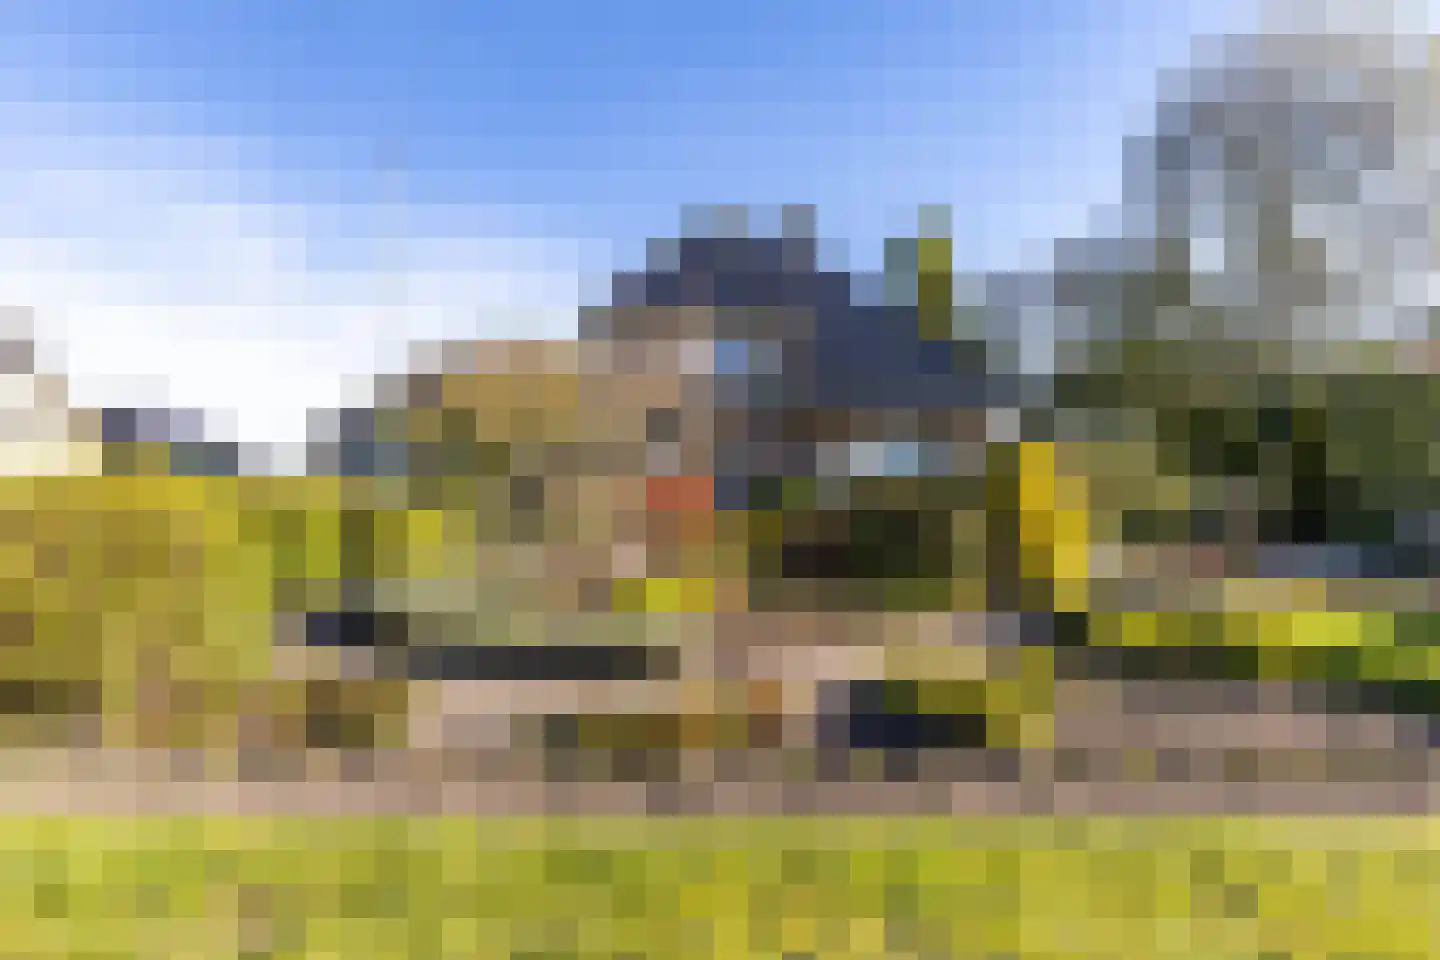
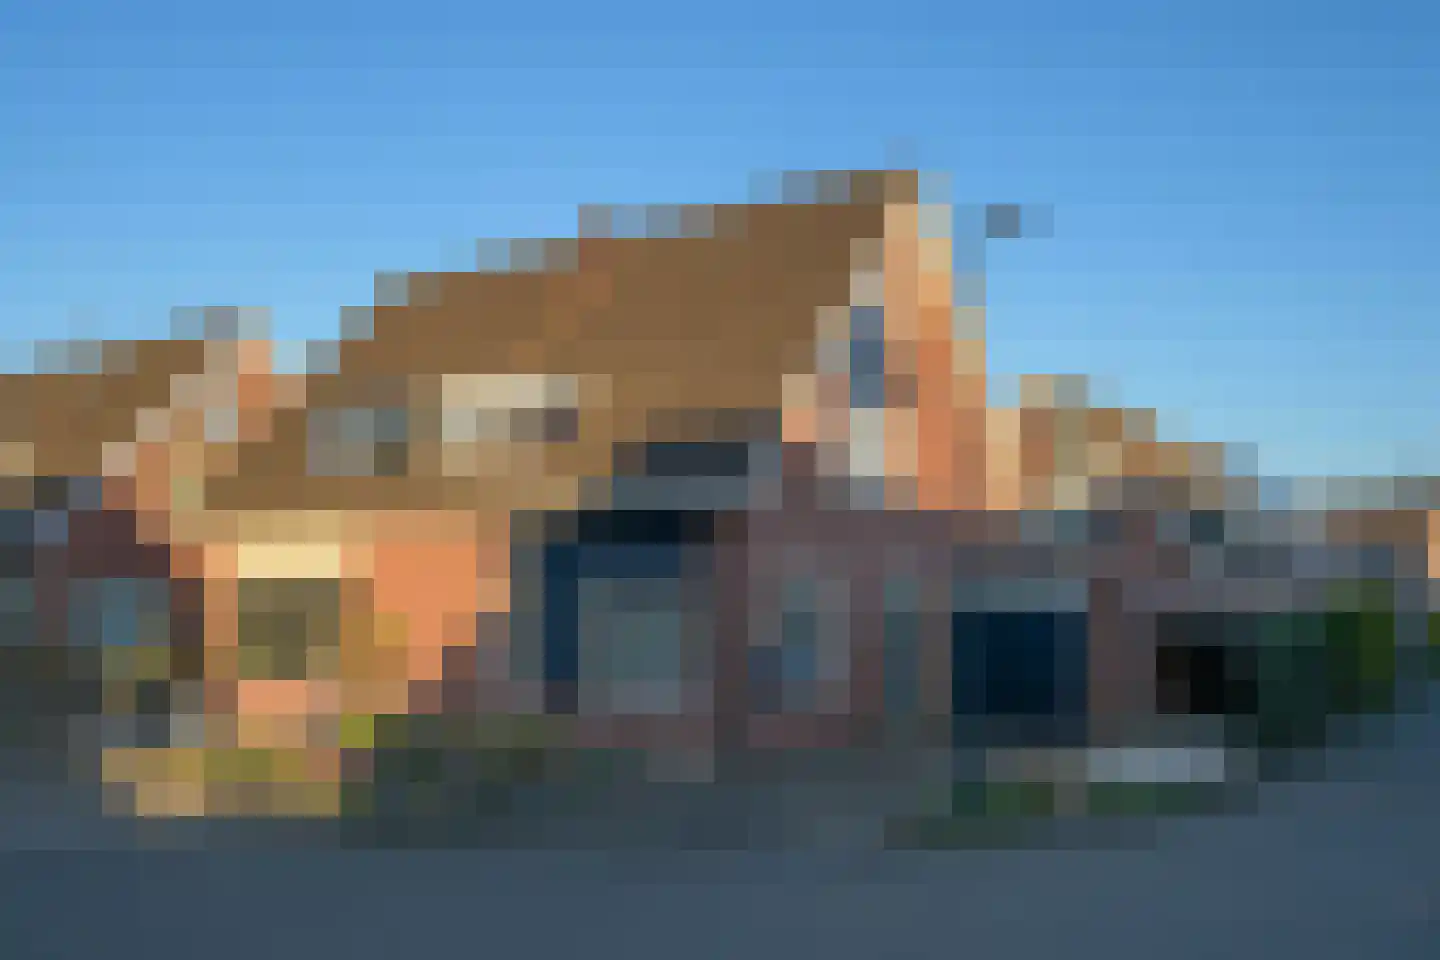
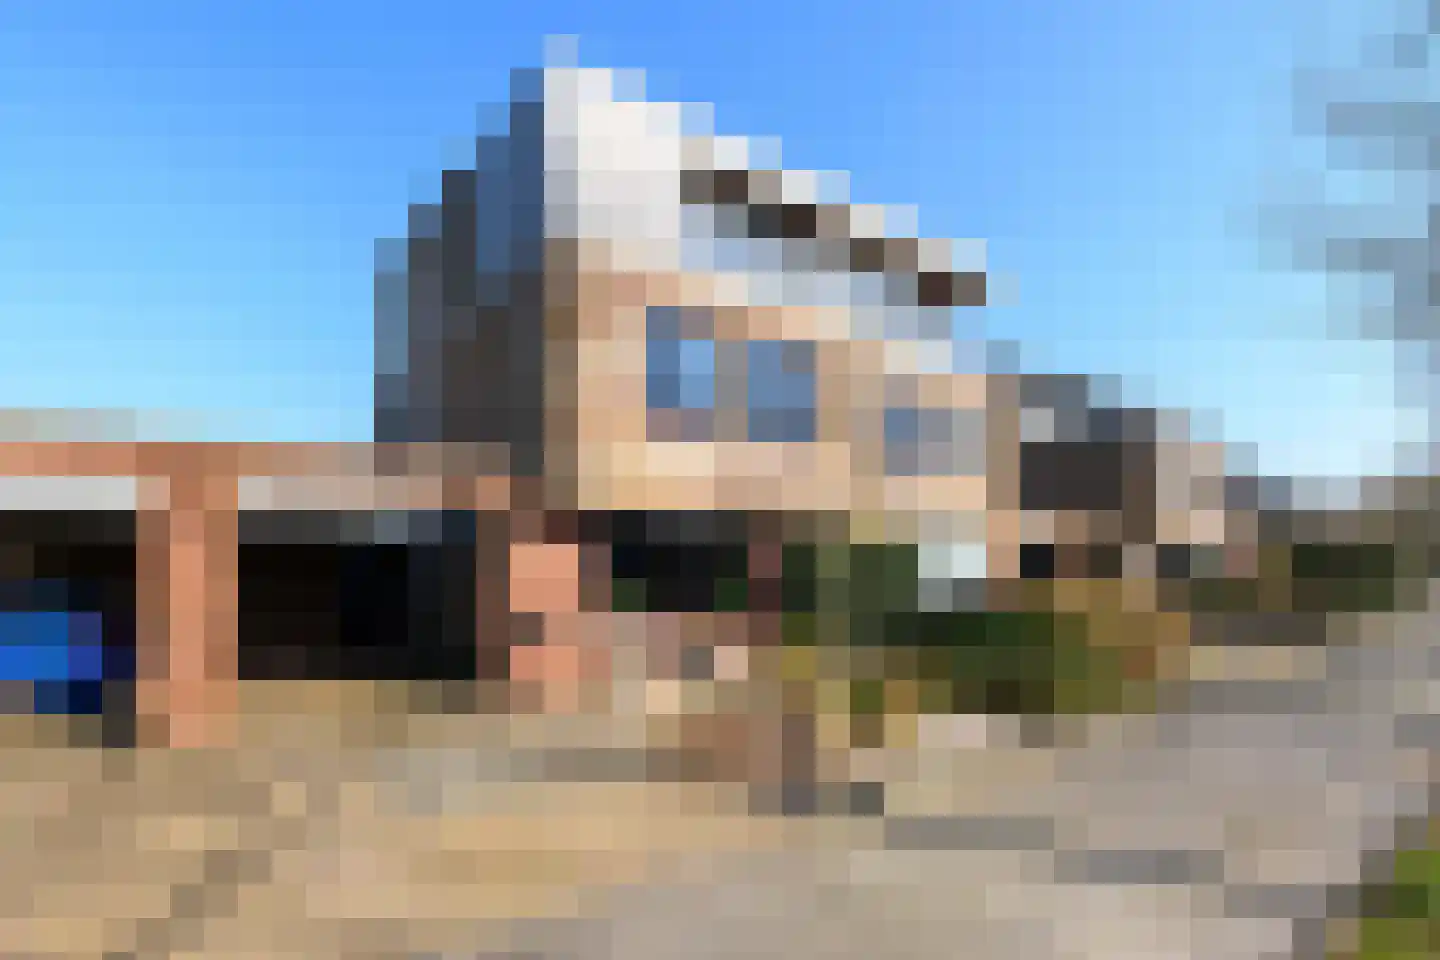
Roede 38
8447CC Heerenveen
€ 439.000 k.k.
€ 4.720/m²
BSave as favorite- Living area
- 93 m²
- Land area
- 252 m²
- Bedrooms
- 4
-

- Sold
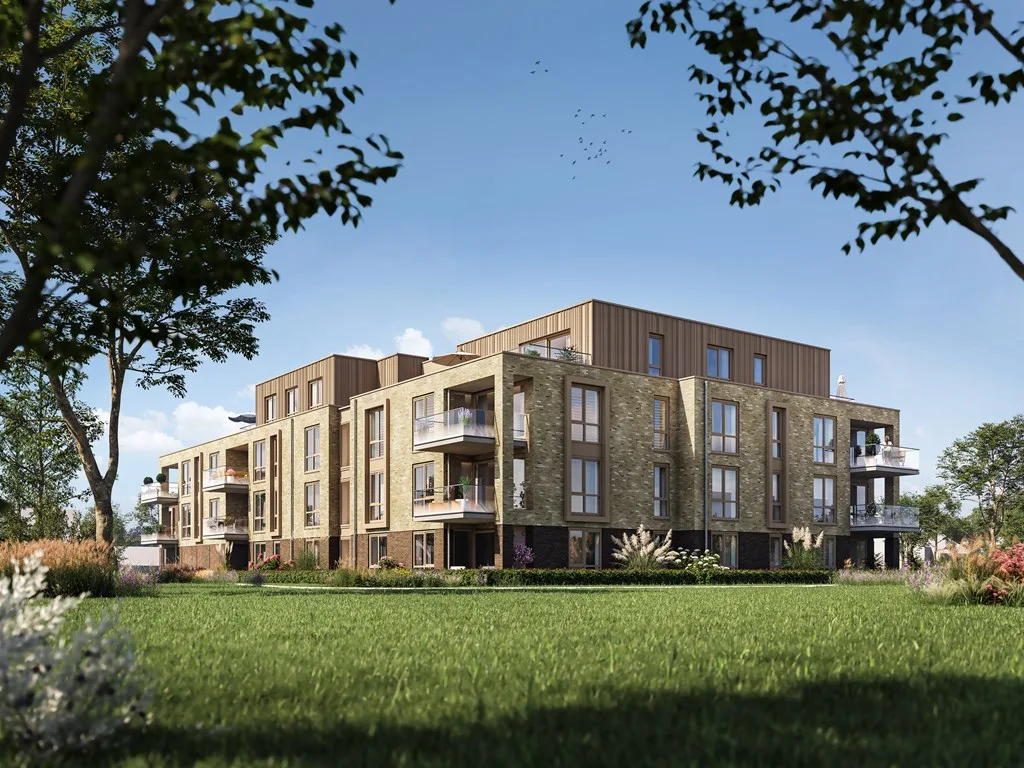
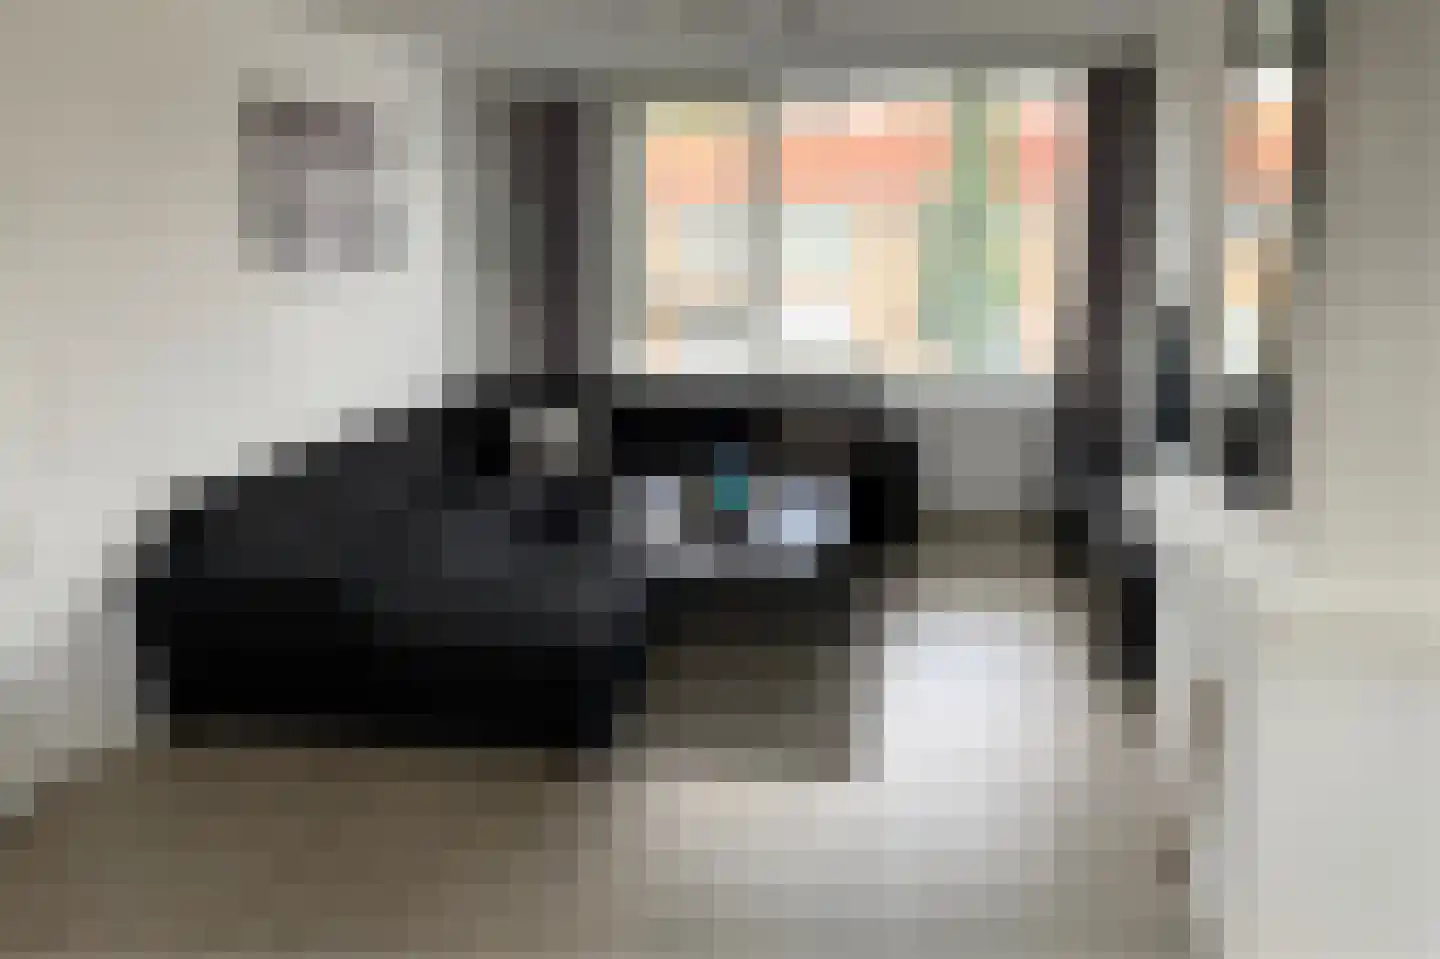
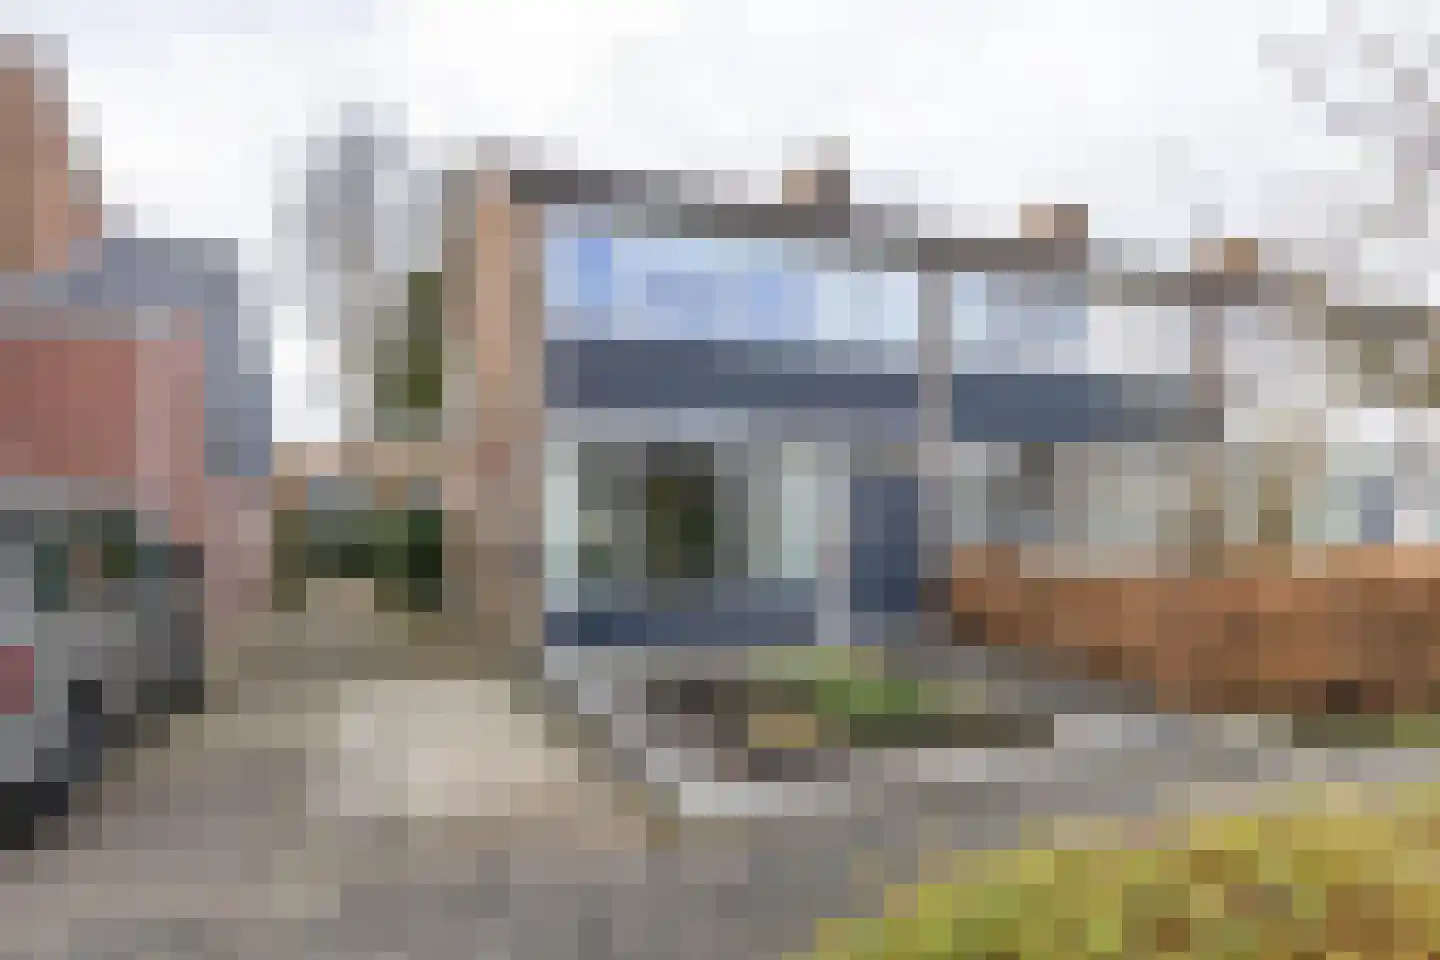
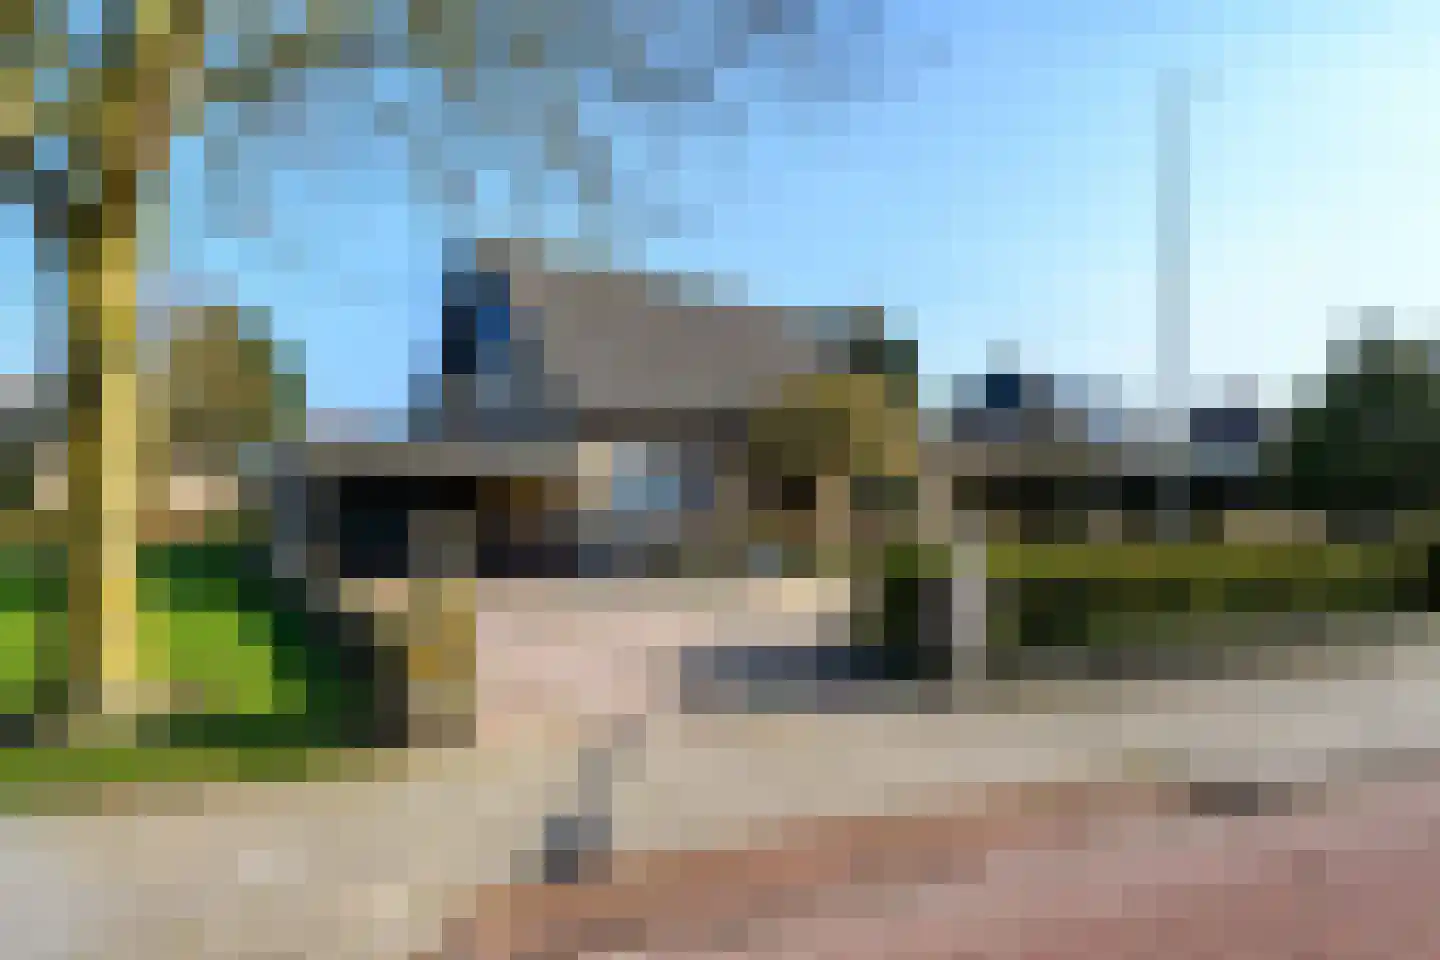
De Helling 36
8401TV Gorredijk
€ 225.000 k.k.
€ 2.500/m²
DSave as favorite- Living area
- 90 m²
- Land area
- 149 m²
- Bedrooms
- 3
-

- Sold
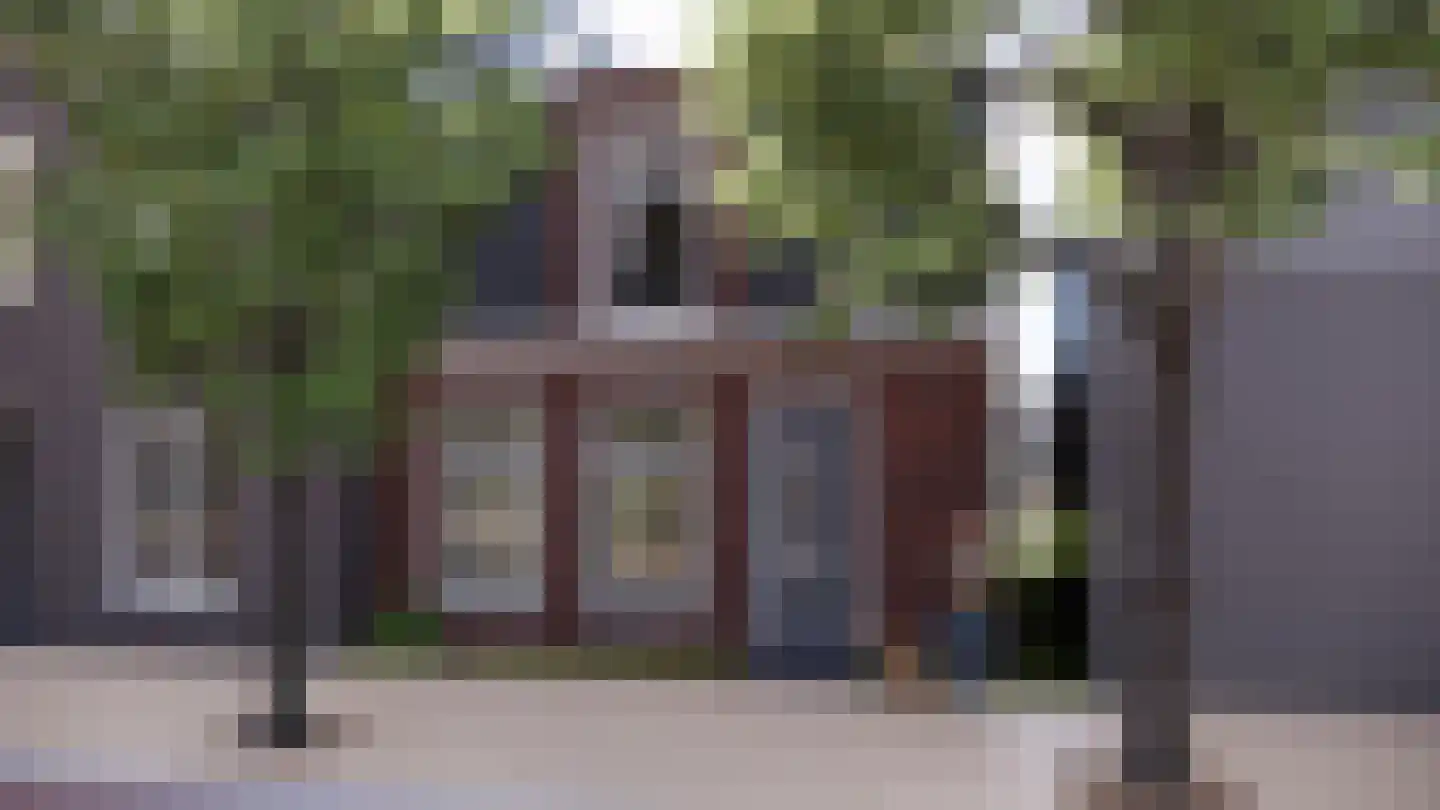
Compagnonsstrjitte 114
8401RW Gorredijk
€ 248.000 k.k.
€ 2.695/m²
CSave as favorite- Living area
- 92 m²
- Land area
- 175 m²
- Bedrooms
- 3
-

- Sold
Sieger van der Laanstraat 54
8442EB Heerenveen
€ 249.500 k.k.
€ 3.838/m²
DSave as favorite- Living area
- 65 m²
- Land area
- 146 m²
- Bedrooms
- 2
Reviews (51)
Review platforms
BronscoresTotal score
51 total reviews

51 reviews on Google
-
johannes bijstra
10Translated by AIFine collaboration in the sale of my middle house. He is driven, thinks along and makes sure everything is well organized. Always easy to reach and clear in communication. That gave confidence throughout the entire process. Sold with a nice result, so just very satisfied.
-
Wianda Witteveen
10Translated by AIFriendly, Sober and Honest. At least 3 words that stand out when it comes to real estate agents Beke and Jan-Douwe. We bought our new house through Mijnbuitenplaats and sold our current home within a very short period of 2 weeks. We are more than satisfied, honest people, highly knowledgeable and not just plain clear-headed but also know what to expect. A lot is taken care of for you and they understand how exciting such a period can be! We look back on this quite busy hectic period with a very good feeling but with Beke and Jan-Douwe we would do it all again! Thank you once again for everything! Arnoud and Wianda
-
Anja Drent
10Translated by AIBeke & Jan Douwe have advised us very professionally in the sale of our home. They are always available for questions or advice, they think along and know how to reassure you in a hectic exciting period. We can recommend them to everyone!
-
Joke Van Der Kooi
10Translated by AIDue to the good experiences with the sale of our previous house by Beke and Jan Douwe, the real estate agency Mijn Buitenplaats was again asked to handle the sale of a house that had to be sold due to a tragic accident from an estate. Although these realtors normally have beautiful houses in their portfolio, this house was of a completely different level. Moreover, there were sensitivities involved. It was nice again to reach a good (in multiple aspects) result through good internal cooperation. Underlying conditions for this: A lot of attention to honest work. Good internal communication. From a realistic pricing, let the market do its job further.
-
Maurice Van Hurck
10 -
Dennis van Schaik
10Translated by AISpaltenbrêge 2 in Terwispel was sold by Mijn Buitenplaats Makelaardij. We chose the real estate agent in Terwispel. Jan Douwe was literally and figuratively close. We are very satisfied with the guidance from the first contact to the transfer.
-
Anja de Roos
10Translated by AIBeke and Jan Douwe, what a great team. Professional, reliable, involved and above all genuinely interested in the ups and downs of people. For them, nothing is too much, they'll go through fire for you. A real estate agency where professionalism and humanity go hand in hand. Where do you find that nowadays? Well, just in Terwispel!
-
Ben Arend Reisman
10Translated by AIHonest real estate agents don't exist, they sometimes say. That statement can be thrown in the trash with this one! Beke and Jan-Douwe guided us exceptionally well for over a year in our search for a home! We searched almost all of Friesland and ultimately, thanks to them, were able to acquire our dream home. They saved us from quite a few serious mistakes on several occasions, and acted decisively at precisely the right moments. They really know the Frisian housing market inside and out, they recognize the pitfalls and point out things that a layman easily overlooks. Even though our search was long, their involvement remained high throughout the entire process. We greatly appreciated their personal approach! And not to be forgotten: a beautiful negotiation result, allowing us to install an even more beautiful floor! For us, it's clear: Beke and Jan-Douwe, you can definitely rely on them! So if you are looking for a real estate agent, look no further! Huge thanks for everything you have done!
-
Arnold Oosterbaan
10Translated by AIHow happy we are with Mijn Buitenplaats, also known as Beke and Jan Douwe! Not only did they help us find our dream home, which was really quite a challenge. In addition, they also helped us fantastically in marketing our current house. Beke is like a second mother, a kind and warm woman who has taken care of us. And Jan Douwe is like a hip brother who knows all the latest technical gadgets. A good combination of mother and son. We would recommend Beke and Jan Douwe to everyone and want to thank them again for everything. Arnold, Anouk & Nolan
-
Bente Mulder
10Translated by AIWe had a great experience with Mijn Buitenplaats Makelaardij! Nothing but praise for Jan Douwe and Beke Hendriksma. They understand their profession like no other. Mijn Buitenplaats Makelaardij takes care of everything from A to Z. From a very clear intake interview in which the full range of services is explained and all possibilities are discussed. To having highly accurate floor plans, beautiful photos and unique sales texts created that all do more than justice to the property. And finally, taking care of the viewings and the ultimate sales process. The contact was very pleasant and we really appreciated the feedback on every development. Our house has been presented in the best possible way. We are convinced that choosing Mijn Buitenplaats Makelaardij for the sale of our home was the best choice. We recommend Mijn Buitenplaats Makelaardij to everyone looking for a reliable and expert real estate agent. Jan Douwe and Beke, thank you again for everything! Geert and Bente
-
Francis Kegel
10Translated by AIReally pleasant collaboration with Beke and Jan-Douwe!
-
Peter Ruijter
10Translated by AIThe house of my deceased brother has now been sold with the mediation of Makelaardij Mijn Buitenplaats. From the first contact with this broker(s), I can only state that these people not only worked very professionally, but also created a warm bond with me. Professional through a great description, video, photos and drone images of the house. They were closely involved in the creation of the sale of the house and supported me with advice and action. Kudos to these brokers!!
-
Steffi Ruijter
10Translated by AI'Which real estate agent should I choose to sell the house of my deceased uncle? How can I choose the right person when I live 1500 km away abroad? How will that remote collaboration work and who can I really trust in that process?'... Just a small selection of my thoughts, which some may recognize when it comes to selling a house ;-) My father and I have spoken with several real estate agents, but Beke and Jan-Douwe were different from the very first moment. They made us feel, above all else, that they saw US, not the house, the sale or 'the Deal' at the end of the road. And this feeling turned out to be absolutely correct; Beke and Jan-Douwe are worth their weight in gold! They have the talent to connect with their clients. They made my father and me feel seen and heard about what is important to us. In my opinion, this is the most important thing in such a valuable process as selling a house. Both in the preparatory discussions and in every subsequent contact, we were taken step by step through the process. Beke and Jan-Douwe were ALWAYS perfectly prepared and took a huge amount of work (and worries) off our hands. A sale 'at a distance' from abroad can be a very tiring procedure, but thanks to the regular updates via WhatsApp (great reports of the various viewings, regular telephone contact about the next steps, checking and explaining the procedures again before anything was decided, etc...) it felt as if I were there myself and it was a very pleasant process. I am incredibly grateful to Beke and Jan-Douwe for the incredibly good, fast and highly professional work they have done. I couldn't have made a better choice, both professionally and personally you are simply TOP! I can truly wholeheartedly recommend working with Beke and Jan-Douwe and having them sell or buy your house. Beke and Jan-Douwe, THANK YOU VERY MUCH for everything !! :-)'
-
Gerda van der Vlies
10Translated by AIPurchasing a house, My Outside Place real estate agency - that is Beke and her son Jan Douwe - we asked to help us with the search (and purchase) of a house. We chose them because the presentation on the website gave us confidence that 'My Outside Place' is a professional and involved organization. During the purchasing process, we had the most contact with Beke and got to know her as truly involved and very adequate. Extra important for us because we were not familiar with the region. Her advice was our compass. Beke maintains contact in a friendly and professional manner, always reacting quickly and decisively. Beke investigates everything very accurately and provides direct feedback. She responds quickly to our messages and regularly called to give an update, which we found very pleasant. She does not only do what is necessary but helps and thinks along. Beke can switch well and quickly, which proves to be very effective in practice. The moment we saw ‘our’ house, Beke made sure she was immediately available to view it together with us. We had some doubts about structural issues, so Beke arranged a structural survey on very short notice. When it came to making an offer, her professional side shone through! We are very happy with her negotiations during the bidding process and the ultimate result. Beke has always listened well to us and used her expertise based on that. She always gave us the impression of being personally involved in a good final result. Without any doubt, we would choose her again if the opportunity arises! Fam. van Tilburg
-
Niesje Kooistra
10Translated by AIWe experienced the personal contact with Beke and Jan Douwe from Mijn Buitenplaats as very pleasant. The presentation of the house was perfect, the photos and film were great. And the professional guidance was more than good. Our house was sold within a week. Thank you Beke and Jan Douwe.
-
Lieneke Joustra
10Translated by AII bought my current home with the help of Beke, and now 6 years later I have sold this property again with Mijn Buitenplaats Makelaardij. They also helped me with the purchase of my new apartment. Beke and Jan Douwe are friendly, helpful people who will assist you with advice and action. If I ever move again, I will definitely call them again!!! Thank you very much for all your help.
-
Wiep Hoekstra
10 -
Akke Leeuwen
10Translated by AIVery satisfied with the sales support for our house. The communication with Beke and Jan Douwe is very good, fast and active. Until the last signature and final conversation, Beke arranged everything super well! No small print or afterwards ambiguities, everything clear and honest from the beginning, also towards the buyers!
-
Annemarie Dijkstra
10Translated by AISelling is a party with Beke & Jan Douwe! DNA My Outside Place Real Estate from our experience: Getting things done - Down-to-earth - Accurate Opportunity with My Outside Place!
-
Ruurd Veldhuis
10Translated by AIA fine realtor and expert in the field of rural living. I am very happy with the beautiful presentation both online and offline. Very friendly and quick follow-up.