Vastiva
Vastiva is een makelaarskantoor in Barneveld dat zich opstelt als betrouwbare partner voor alle vastgoedbehoeften. In een regio waar wonen en wonen in de natuur centraal staan, biedt Vastiva persoonlijk advies en gedetailleerde kennis van de lokale markt. Met diensten als verkoop, verhuur, financieel advies, aankoop en taxaties staat Vastiva voor een breed aanbod dat zowel particulieren als professionals aanspreekt. Het kantoor werkt tr...
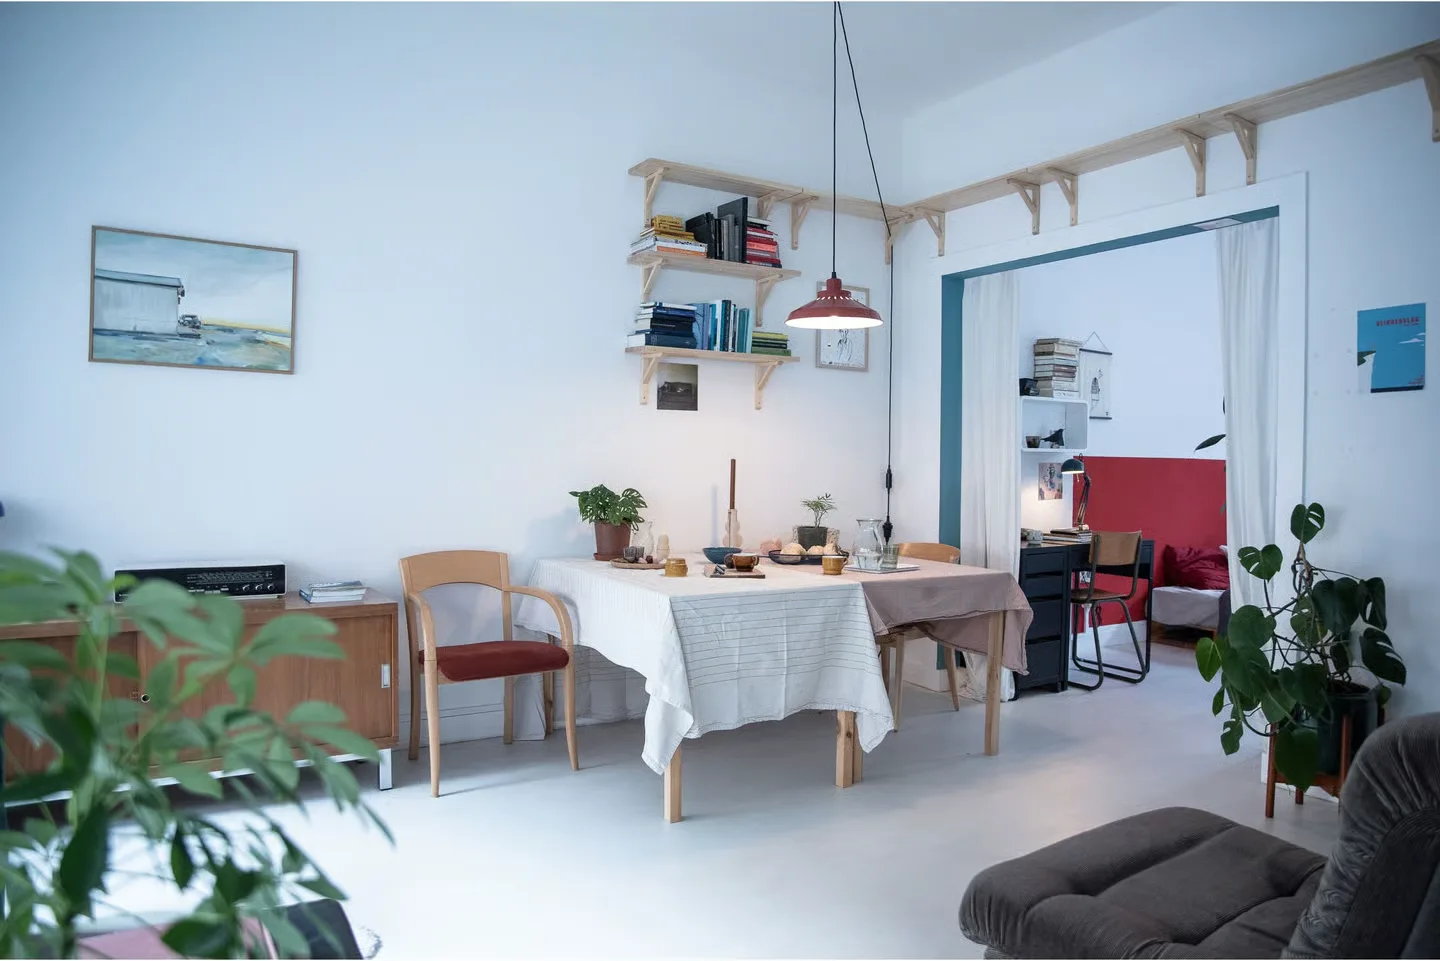
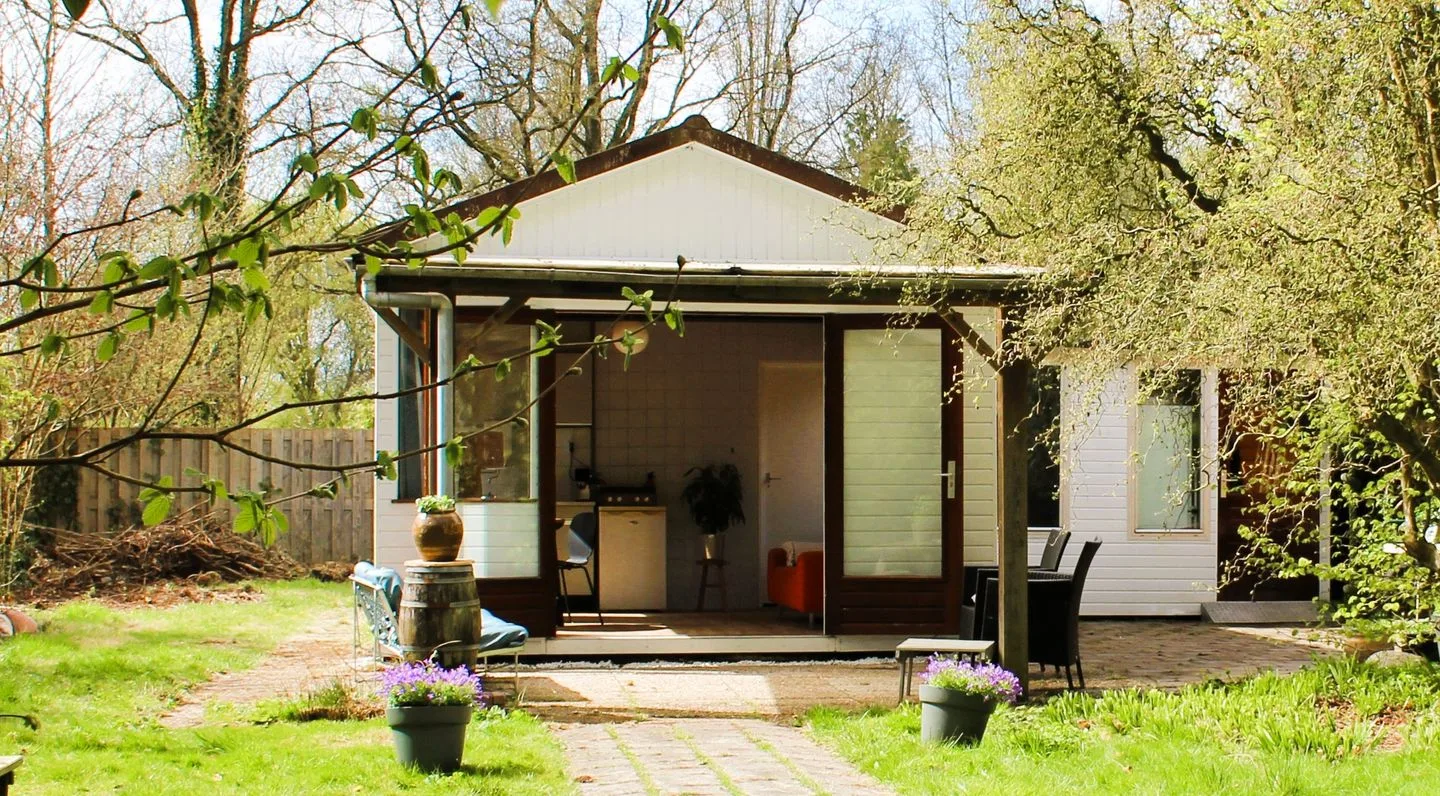
Current housing stock
-
- Available
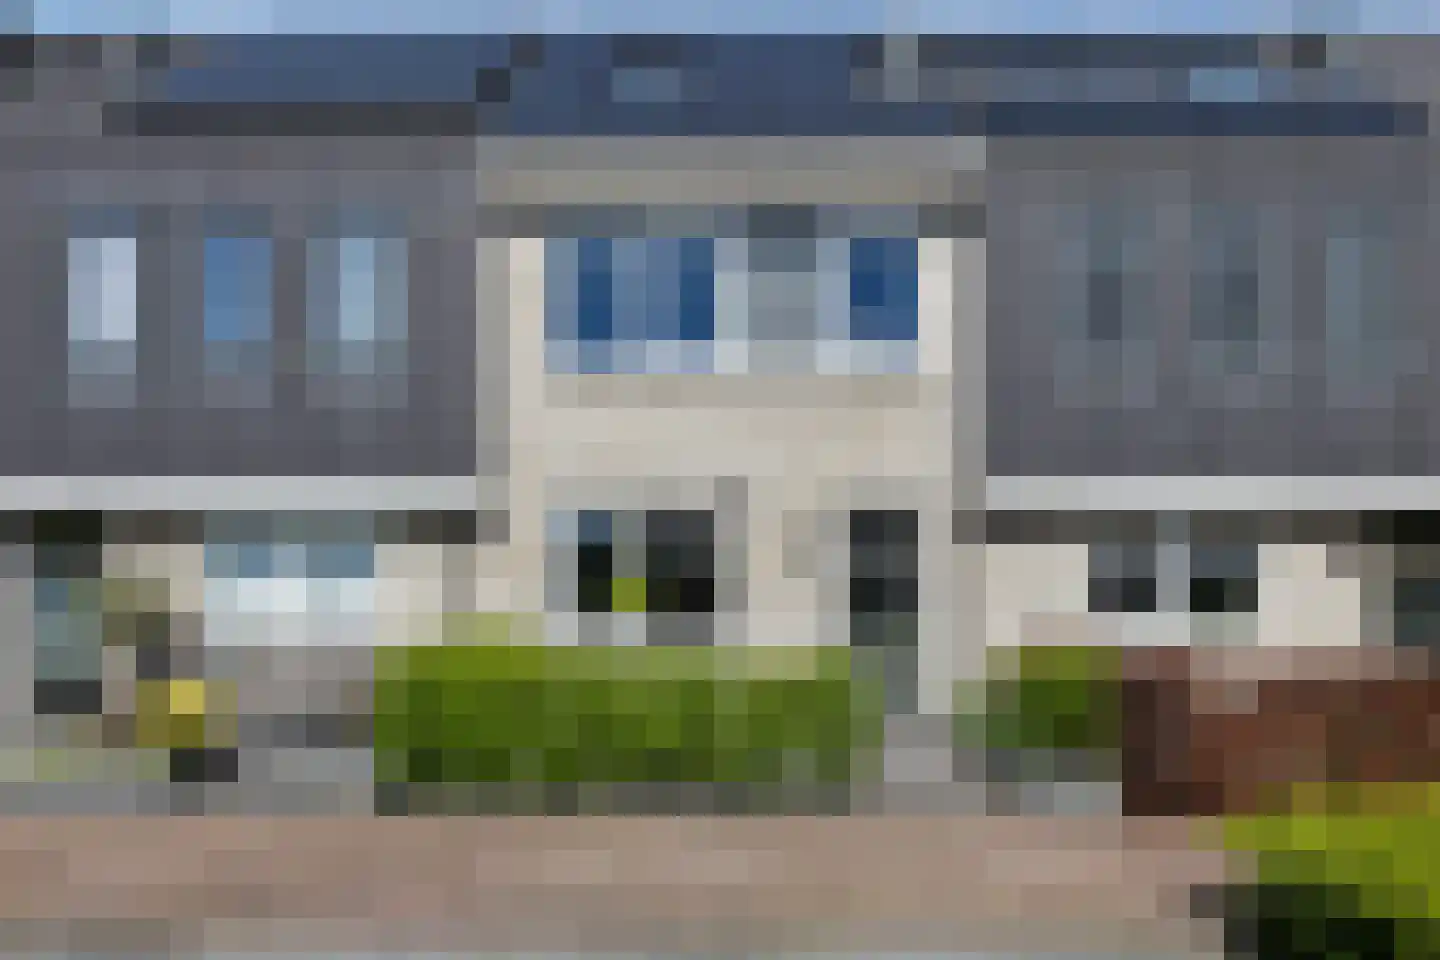
Gerbrandtslaan 31 G004
1871AP Schoorl
€ 159.500 k.k.
Save as favorite- Living area
- 32 m²
- Land area
- 190 m²
- Bedrooms
- 2
-
- Available
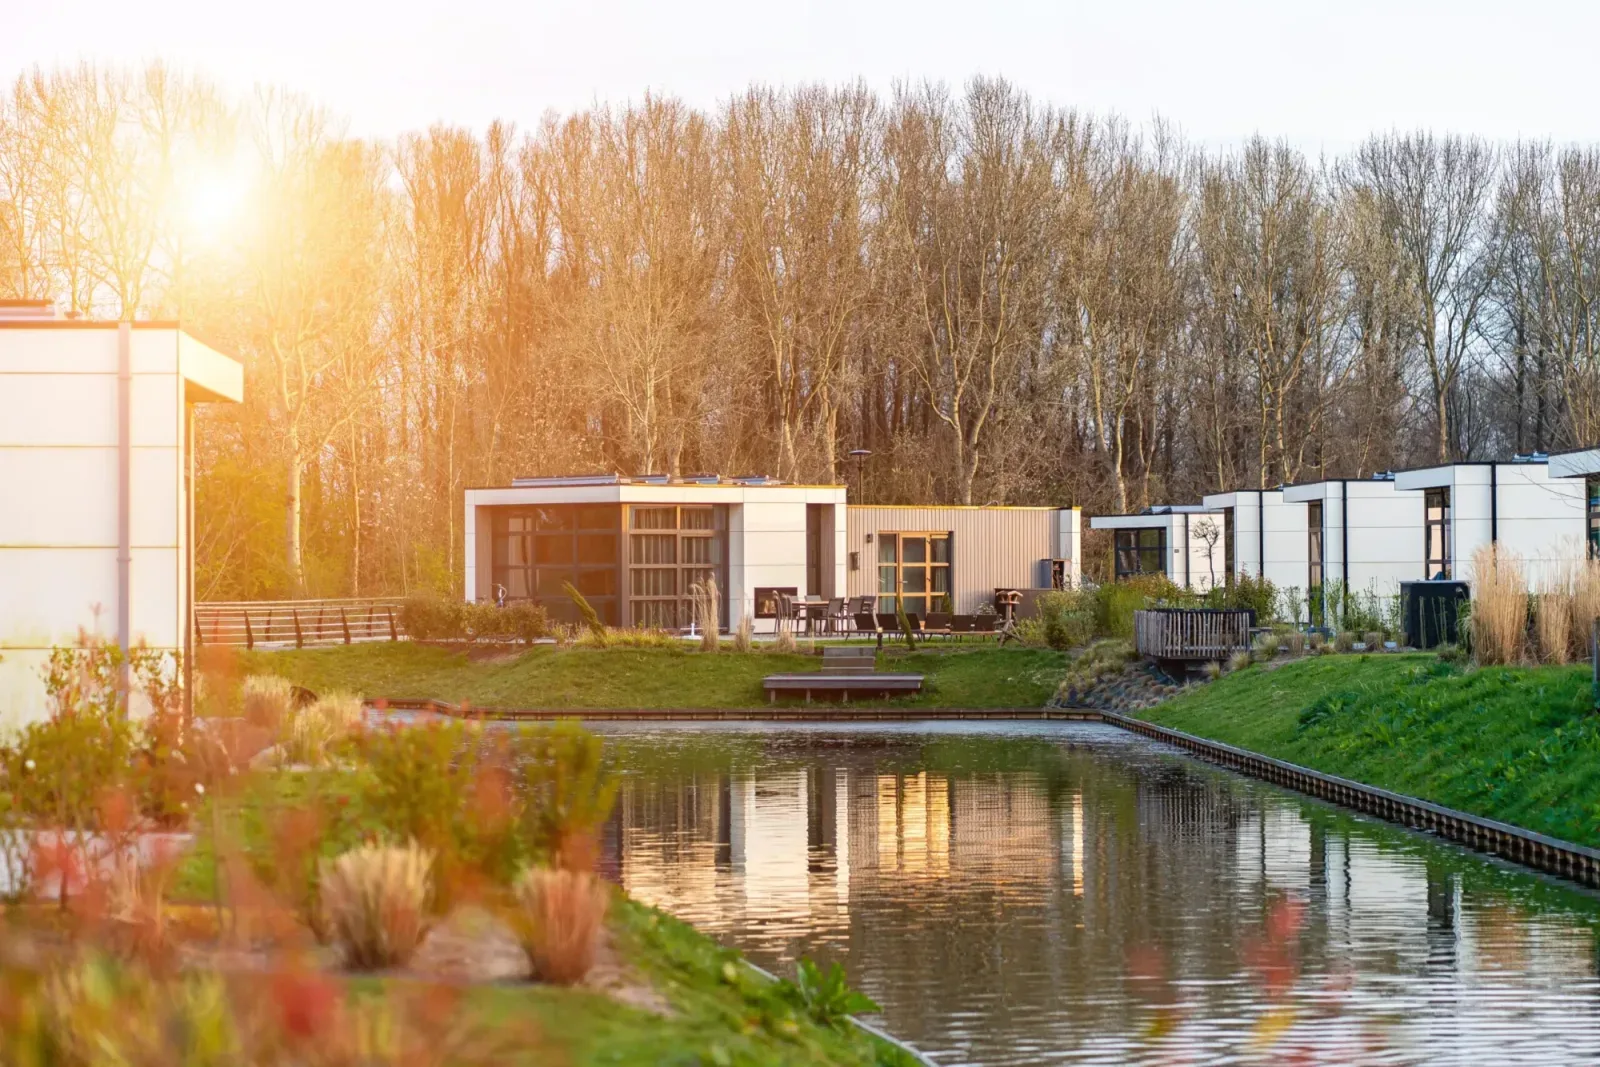
Eerdmanserve 22
7461GR Rijssen
€ 425.000 k.k.
ASave as favorite- Living area
- 102 m²
- Land area
- 228 m²
- Bedrooms
- 1
-

- Available
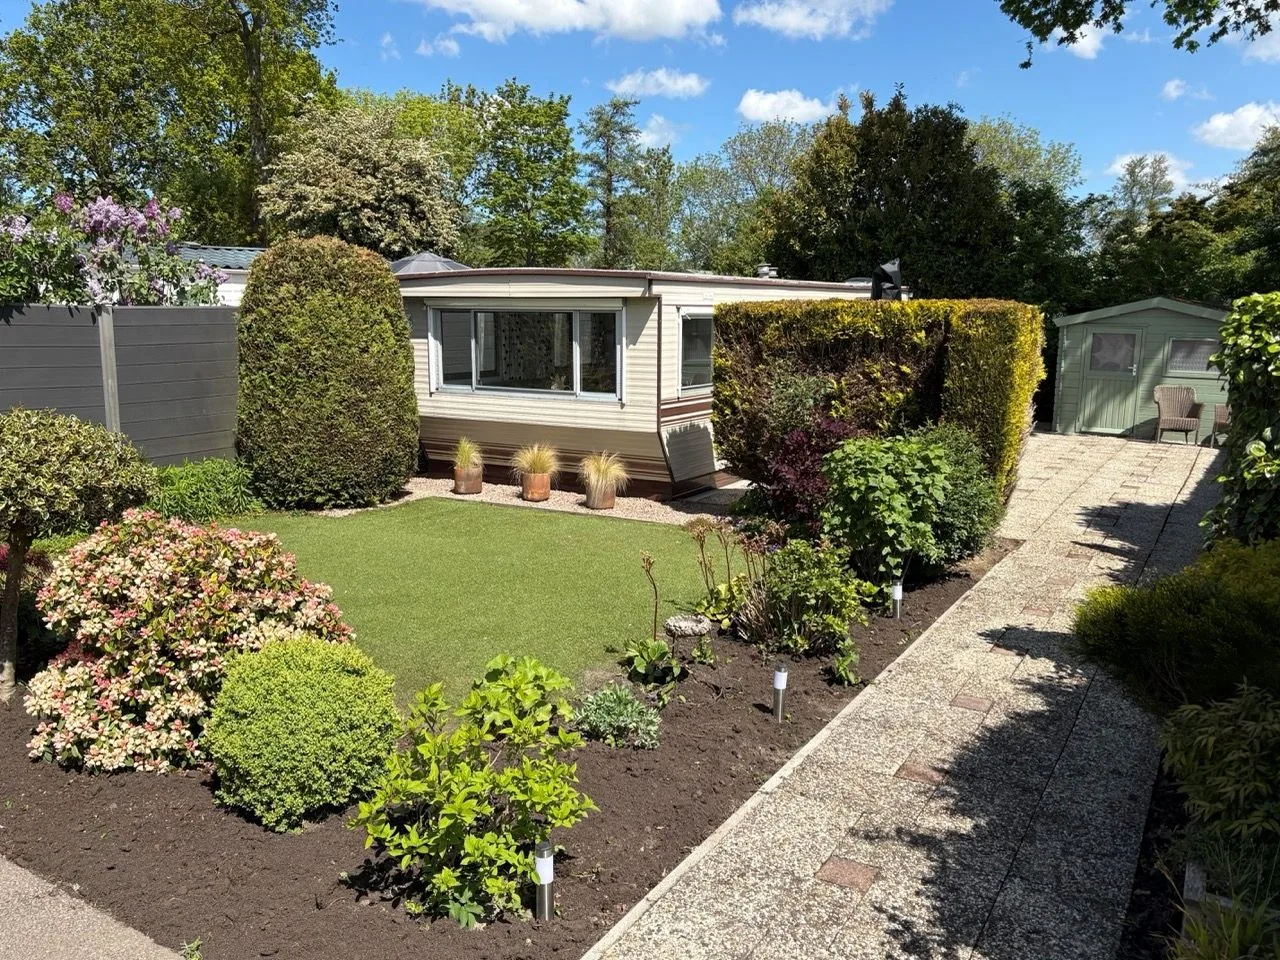
Maasdijk
5307HN Poederoijen
€ 321.000 k.k.
Save as favorite- Living area
- —
- Land area
- 16050 m²
- Bedrooms
- —
-
- Available
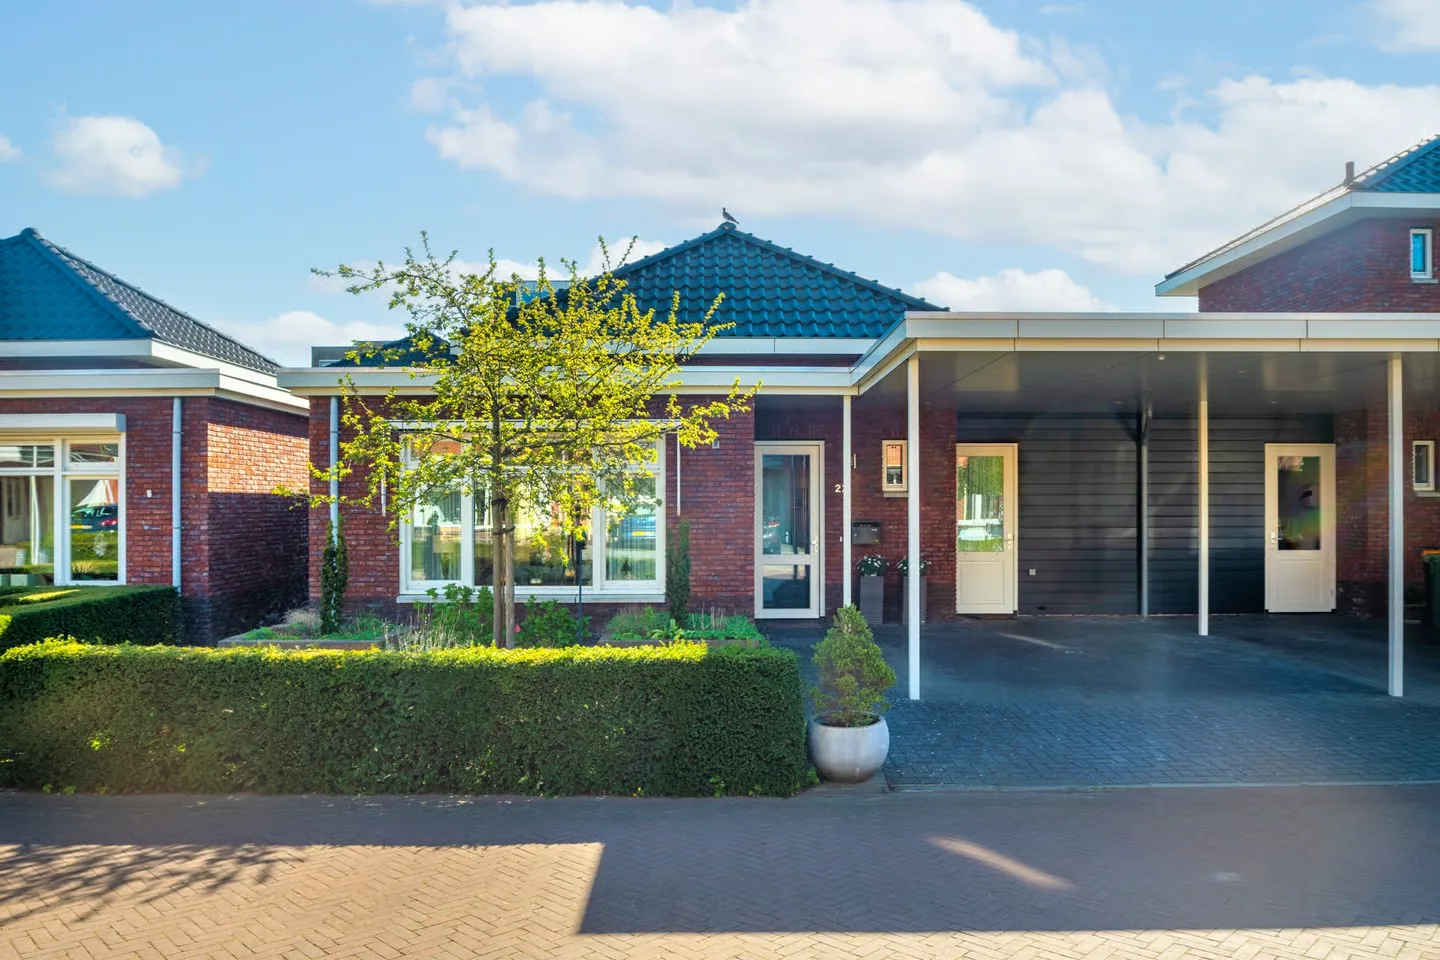
Sint Jacobstraat 21 B
6211LA Maastricht
€ 359.000 k.k.
Save as favorite- Living area
- 52 m²
- Land area
- —
- Bedrooms
- 1
-
- Available
Campinglaan 3 223
9727KH Groningen
€ 97.500 k.k.
Save as favorite- Living area
- 45 m²
- Land area
- 360 m²
- Bedrooms
- 2
-
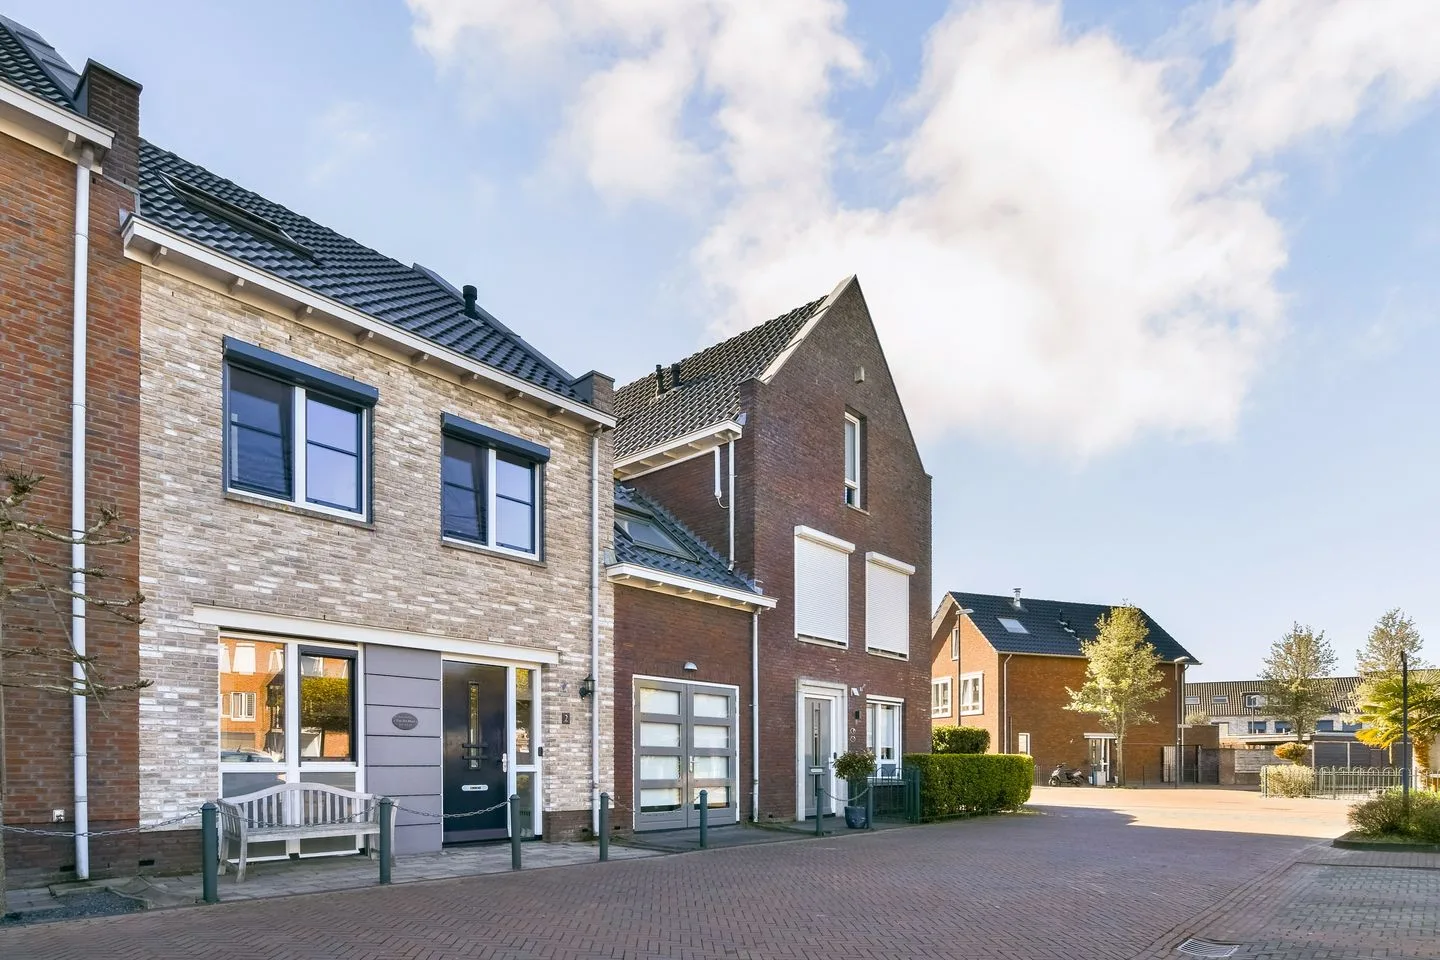
- Available
Geerkampen 2
3751JE Bunschoten-Spakenburg
€ 565.000 k.k.
€ 4.346/m²
A+Save as favorite- Living area
- 130 m²
- Land area
- 165 m²
- Bedrooms
- 5
Reviews (31)
Review platforms
BronscoresTotal score
31 total reviews

Funda
16 reviews on Funda

15 reviews on Google
-
Kornalijnhorst 312
9Translated by AIEverything went smoothly, even having my home viewed by myself. This real estate agent has handled all the Funda placements for me perfectly.
-
Juliana van Stolberglaan 233
9Translated by AII found that Gijs had smooth and fast communication. Actions were well followed up. In the end, the apartment was only on Funda for 5 weeks. The advice to not offer 2150 but under 2000 euros was good because more in line with the market. I would definitely recommend Gijs to others.
-
Barneveldsestraat 49
10Translated by AIVery well handled, tips and good communication. With the previous real estate agent it was completely different. And Vastiva has quickly and well arranged it. Thank you very much top real estate agent!
-
Arthur van Schendelstraat 703
10Translated by AITop online real estate agent! Everything went super smooth and clear. Always quick response, no complicated stuff and everything was well explained. You know exactly where you stand. The house was quickly online with good photos and the guidance was really nice from start to finish. Definitely a recommendation if you're looking for a reliable and modern real estate agent!
-
Tunnelweg 4 A
10Translated by AIThe contact went smoothly and the advertisement was placed effortlessly and professionally. Definitely a recommendation.
-
Da Costakade 115
10Translated by AIHighly recommended real estate agent, low cost and also brings valuable insights to the fore and smooth service.
-
Barneveldsestraat 49 B027
10Translated by AIXander has super helped us and the chalet was sold quickly. More viewings than we thought and a nice price in a week everything arranged. They said that it was a bad time to sell in December but fortunately that has not been our experience. Super and Xander, very very thank you!
-
Mozartweg 32 A
10Translated by AIEverything perfectly arranged, and super advice. Definitely recommend Vastiva as a real estate agent. I will definitely contact again.
-
Robert Josephstraat 43
10Translated by AIVery pleasant and successful. I recommend everyone to put your house for sale with Guido. I was 2 houses within 3 weeks sold for a very high price. Guido, thank you!!!
-
Een funda gebruiker
10Translated by AIIt was easy and good communicating with my agent. I wanted a perfect advertisement. The real estate agent was fully supportive. He was always willing to cooperate. Selling a house in France is currently very difficult due to the poor housing market. With Vastiva, I miraculously managed within half a year.
-
Hoofdstraat 157 C
10Translated by AIThe entire process was super fast and smooth. Everything was clearly communicated and well followed up, really pleasant to work together like this!
-
Mardyk 3 C7
10Translated by AIVery pleasant real estate agent who responded quickly and advised us well in our sales process, heartfelt then Guido!
-
Mariahof 7
10Translated by AIGuido has helped us very well to make our apartment visible online for rent. Good advice and quick response to questions. We have already been able to find nice tenants.
-
Albert Fraanje
10 -
Fatimaplein 39
9Translated by AIThe contact was quick and correct. The order was picked up very quickly and processed correctly. Also, questions in between and afterwards were answered quickly and correctly. There is absolutely nothing to criticize about the service.
-
Milletstraat 56 2
10Translated by AIThe contact and communication went excellently. Guido switches quickly, thinks with you and is also available to talk to you outside of working hours / days. Will definitely recommend everyone.
-
Stadionkade 17 1
8Translated by AIOur contact with Guido went very smoothly and friendly. He is quick to respond and answer questions. Professional and pleasure to work with. Will collaborate again with Guido next time.
-
Gerdien Mulder
10 -
Nico postema
10 -
Hans de Vries
10