Midden Nederland Makelaars B.V. - Nijkerk

Midden Nederland Makelaars is one of the largest real estate agencies in the Gelderse Vallei and on the North-West Veluwe. With six locations and a team of NVM real estate agents, certified appraisers and support staff we help dozens of people in the region every year with buying, selling, renting or appraising a home. Our employees live in the area themselves, so we have a good understanding of the local situation and community life. W...
Current housing stock
-

- Available
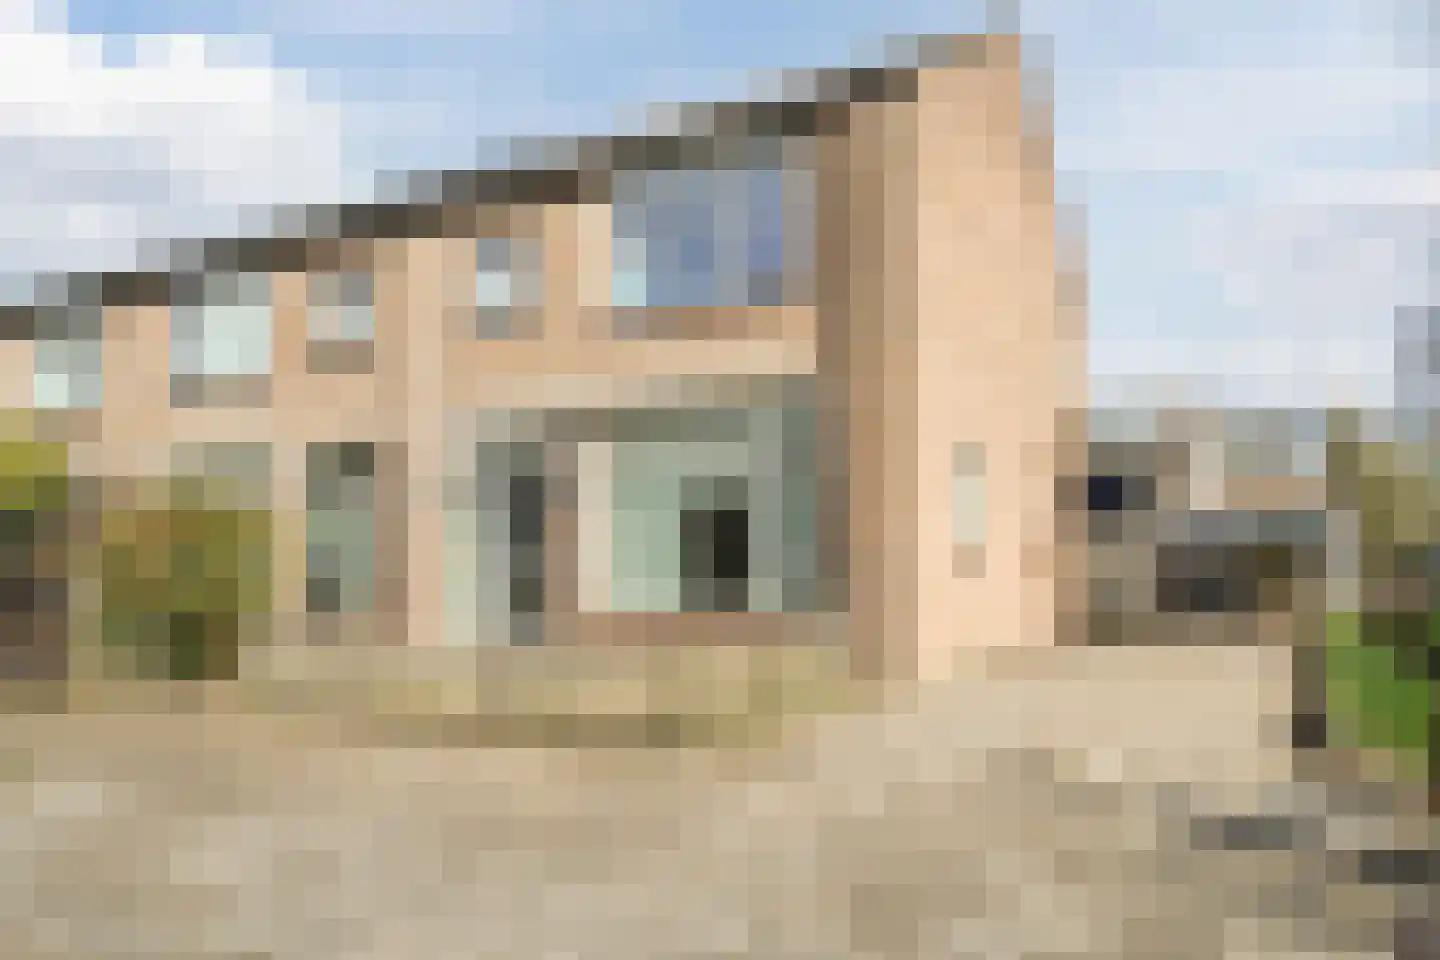
Sparreboomstraat 5
3862DE Nijkerk
€ 495.000 k.k.
ASave as favorite- Living area
- 86 m²
- Land area
- —
- Bedrooms
- 2
-

- Available
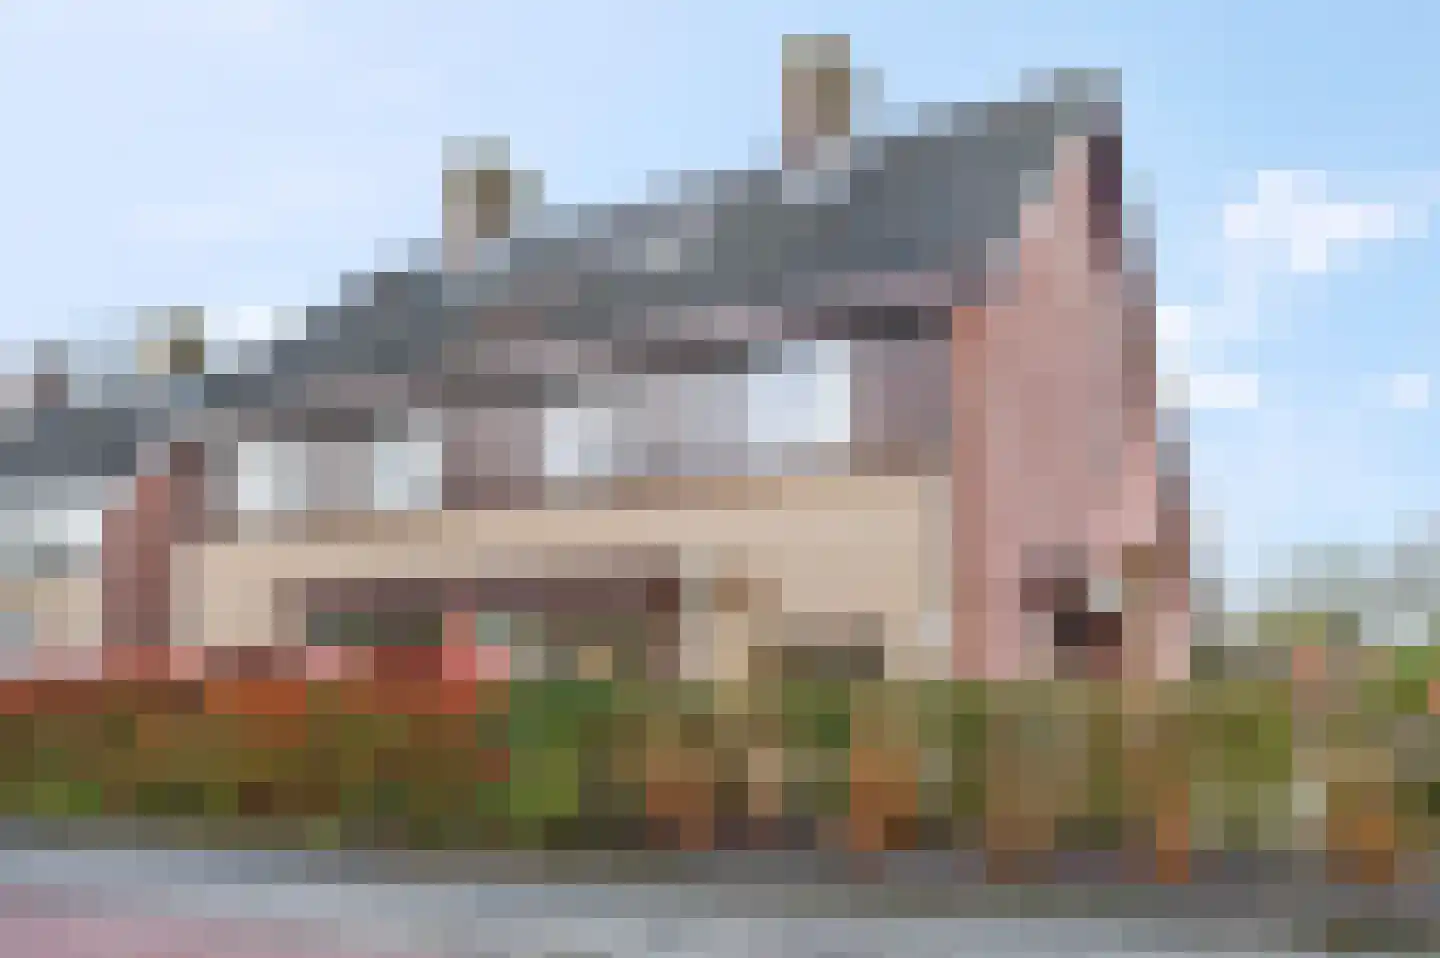
Singel 17 a
3861AD Nijkerk
€ 495.000 k.k.
CSave as favorite- Living area
- 148 m²
- Land area
- —
- Bedrooms
- 4
-

- Available
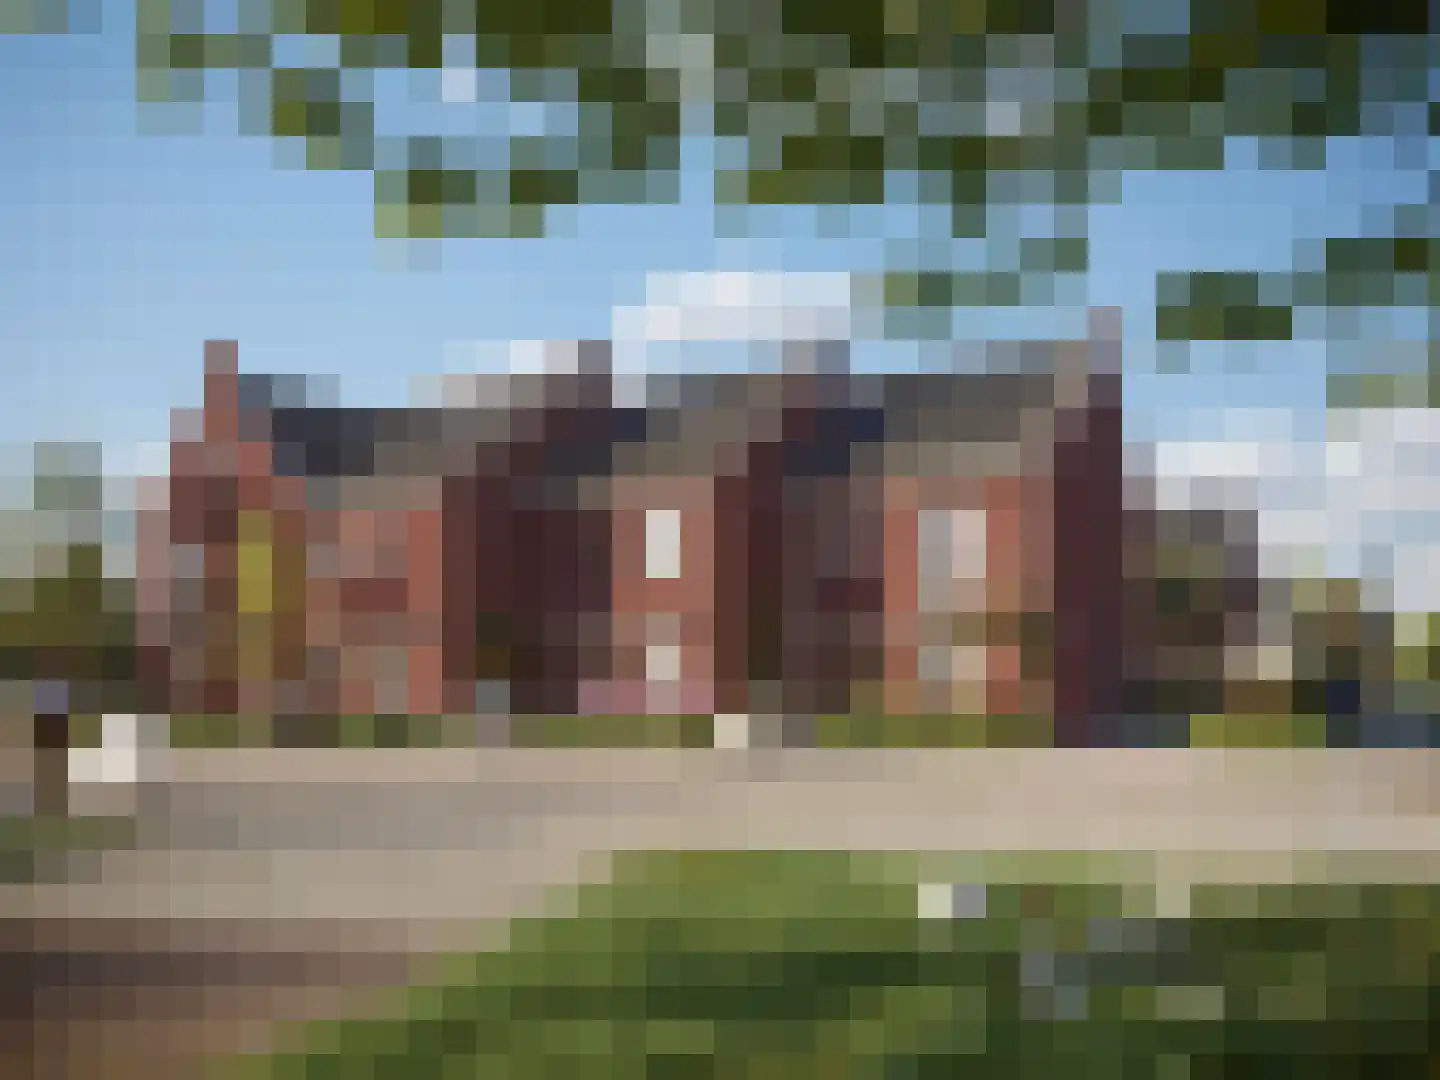
Catamaran 3
3863TE Nijkerk
€ 895.000 k.k.
€ 6.780/m²
BSave as favorite- Living area
- 132 m²
- Land area
- 459 m²
- Bedrooms
- 3
-
- Available
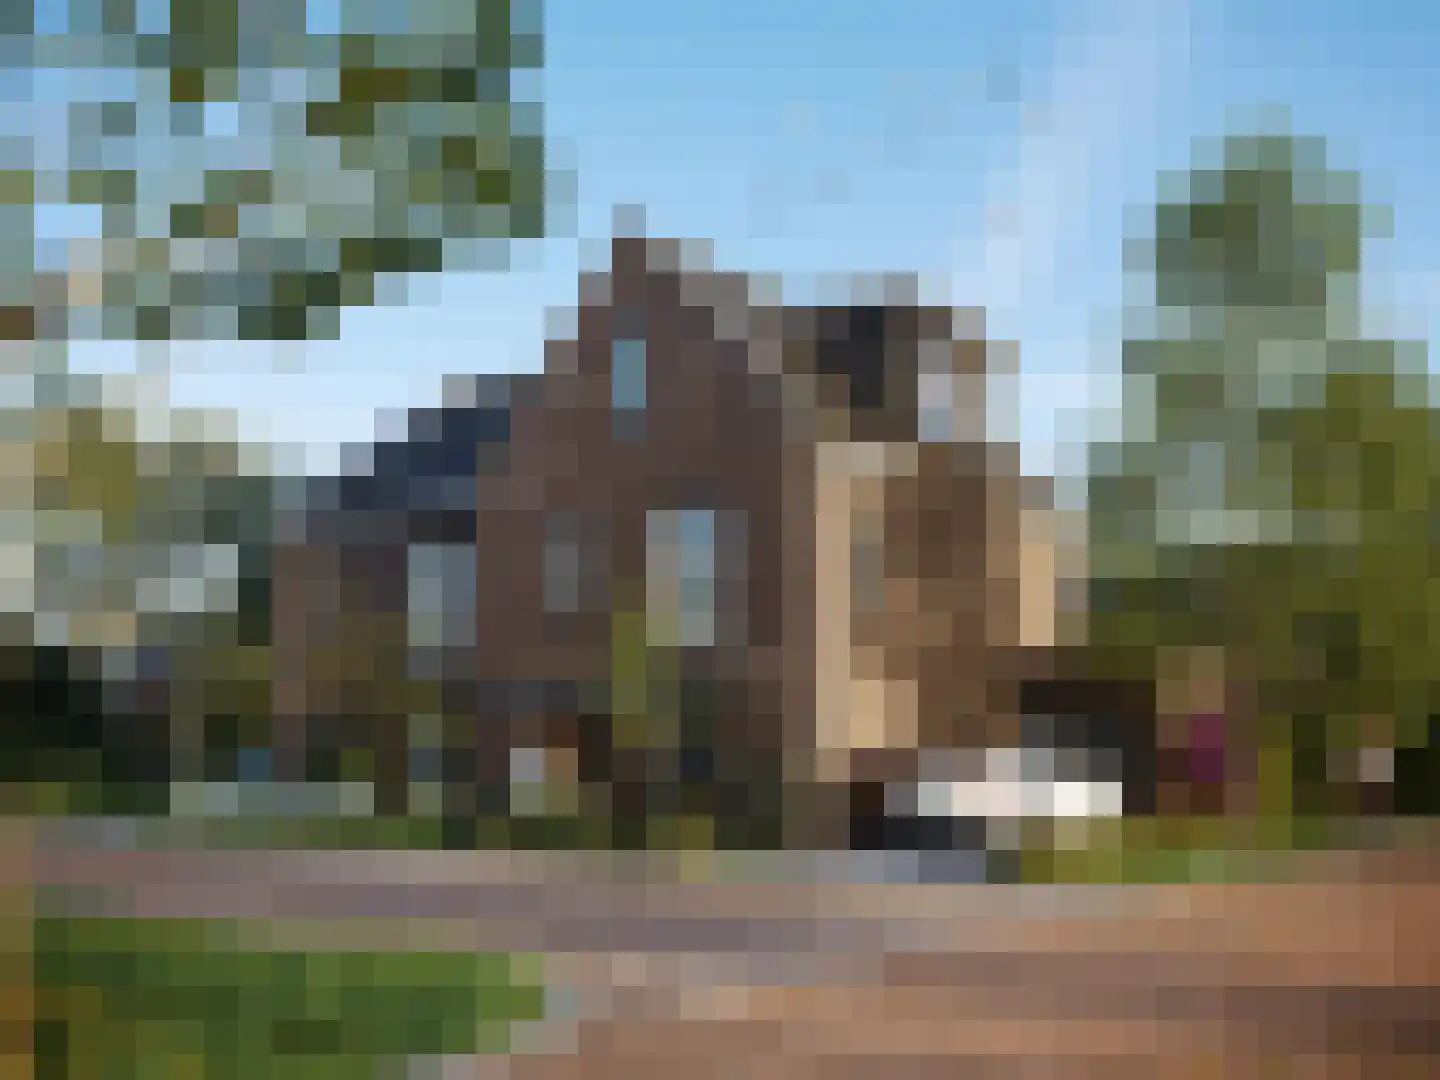
Laakweg 18
3864LC Nijkerkerveen
€ 625.000 ,-
€ 4.808/m²
A++++Save as favorite- Living area
- 130 m²
- Land area
- 215 m²
- Bedrooms
- 3
-
- Available
Laakweg 4
3864LC Nijkerkerveen
€ 785.000 ,-
€ 5.414/m²
A++++Save as favorite- Living area
- 145 m²
- Land area
- 268 m²
- Bedrooms
- 3
-

- Available
Laakweg 8
3864LC Nijkerkerveen
€ 680.000 ,-
€ 5.231/m²
A++++Save as favorite- Living area
- 130 m²
- Land area
- 308 m²
- Bedrooms
- 3
Reviews (86)
Review platforms
BronscoresTotal score
86 total reviews

Funda
38 reviews on Funda

48 reviews on Google
-
Watergoorweg 38
8Makelaar is top! Goede hulp en begeleiding bij alles. Konden alles vragen en we werden overal goed van op de hoogte gehouden.
-
erik dokter
10Translated by AIRecently we sold our home through Midden Nederland Makelaars in Nijkerk. The sale went very smoothly. Harm Jan and his team have supported us fantastically in the sale, fully relieved us and were always pleasant to talk to. At every moment they kept us informed of all developments. In short, we are very happy and wholeheartedly recommend Harm Jan and his team for the sale of your home!
-
Benno Kamminga
10Translated by AIWell and clearly helped. Questions were quickly answered and all documents were clearly gone through with us.
-
Aardbei 11
9Translated by AIFine Personal guidance, you can discuss at any time. And good explanation where they take time for it. Very nice people!
-
Wittenburg 112
9Translated by AIPersonal and clear communication, advises and leaves room for personal choices. The involvement of employees at the office is great.
-
Asserhof 13
10Translated by AIFriendly and knowledgeable staff who keep you well informed throughout the process. Daily updates, in short, we are very satisfied.
-
Rene Van Kommer
10Translated by AIClear in communication and always available. Extremely satisfied with the guidance and would definitely choose this real estate agent again!
-
Lotte Wolters
10Translated by AIVery clear and nicely helped!
-
majella kaihatu
10Translated by AIVery friendly but above all knowledgeable staff. Think actively and proactively and certainly co-determined for us to buy the house
-
Gerco Hogeveen
10Translated by AIVery satisfied with the guidance during the purchase of my new build home. I was clearly informed, professionally advised and always taken seriously throughout the entire process. Thanks to the involvement, expertise and quick communication I felt secure at every step I took. I look back on the cooperation with a lot of satisfaction and can wholeheartedly recommend this real estate agent.
-
Sven van den Akker
10Translated by AIWe are extremely happy with the support during the process of our new build home. From the first contact until completion we were well supported, also enough time was invested in the entire process. This way everything was clearly explained and it wasn't just a formal conversation, which we found very nice when taking such a big step. Thank you for the beautiful memory that we took with us from our last conversation!
-
De Boomgaard 39
9Translated by AIA strong collaboration within and with the MNM team, where we were quickly and professionally helped in the sale of our house. The communication was fast, transparent and clear. In the Nijkerk region, this team is certainly a recommendation!
-
Meinsstraat 54
9Translated by AIVery well assisted. Friendly and well assisted. Quality is good and high. We are satisfied customers.
-
Schoener 1
10Translated by AIA pleasant and professional approach. This applies to the entire team. The staff were always immediately aware of what was happening. That felt very confidential.
-
Corlaerstraat 37
9Translated by AIWell guided and accessible throughout the entire sales & purchase process. Expert with humor, a combination that I really appreciated.
-
Erik Simon
10Translated by AIGreat help with the purchase of our home
-
Johan de Boer
10Translated by AIMidden Nederland Makelaars Nijkerk has helped us very involved and with enthusiasm and patience to make a purchase decision in the new build project Fiore Phase 1 on the Doornsteeg. All our questions were adequately answered by the team, if necessary after extra inquiry with the project developer. Thanks to Laura, Annemiek and Harm-Jan.
-
Everdien van Veluw
10Translated by AIThe Team of Central Netherlands has particularly well helped us.
-
S. van Wieren
10 -
Braam 14
9Translated by AIThe contact with Harm-jan went smoothly. During the sales process we were kept informed by the team via telephone and email. After each viewing a clear summary of how it went. We found the cooperation and communication excellent.