Bij Kooijman Makelaardij geloven we in een moderne, persoonlijke aanpak die verder gaat dan het traditionele makelen. We kijken naar de klant als een individu en passen ons aan om het beste resultaat te behalen. Ons team bestaat uit specialisten op hun gebied, van makelaars en taxateurs tot marketingdeskundigen en binnendienstmedewerkers. Ieder lid draagt bij aan een succesvolle samenwerking. Onze benadering is gericht op kwaliteit en b...
Current housing stock
-
- Available
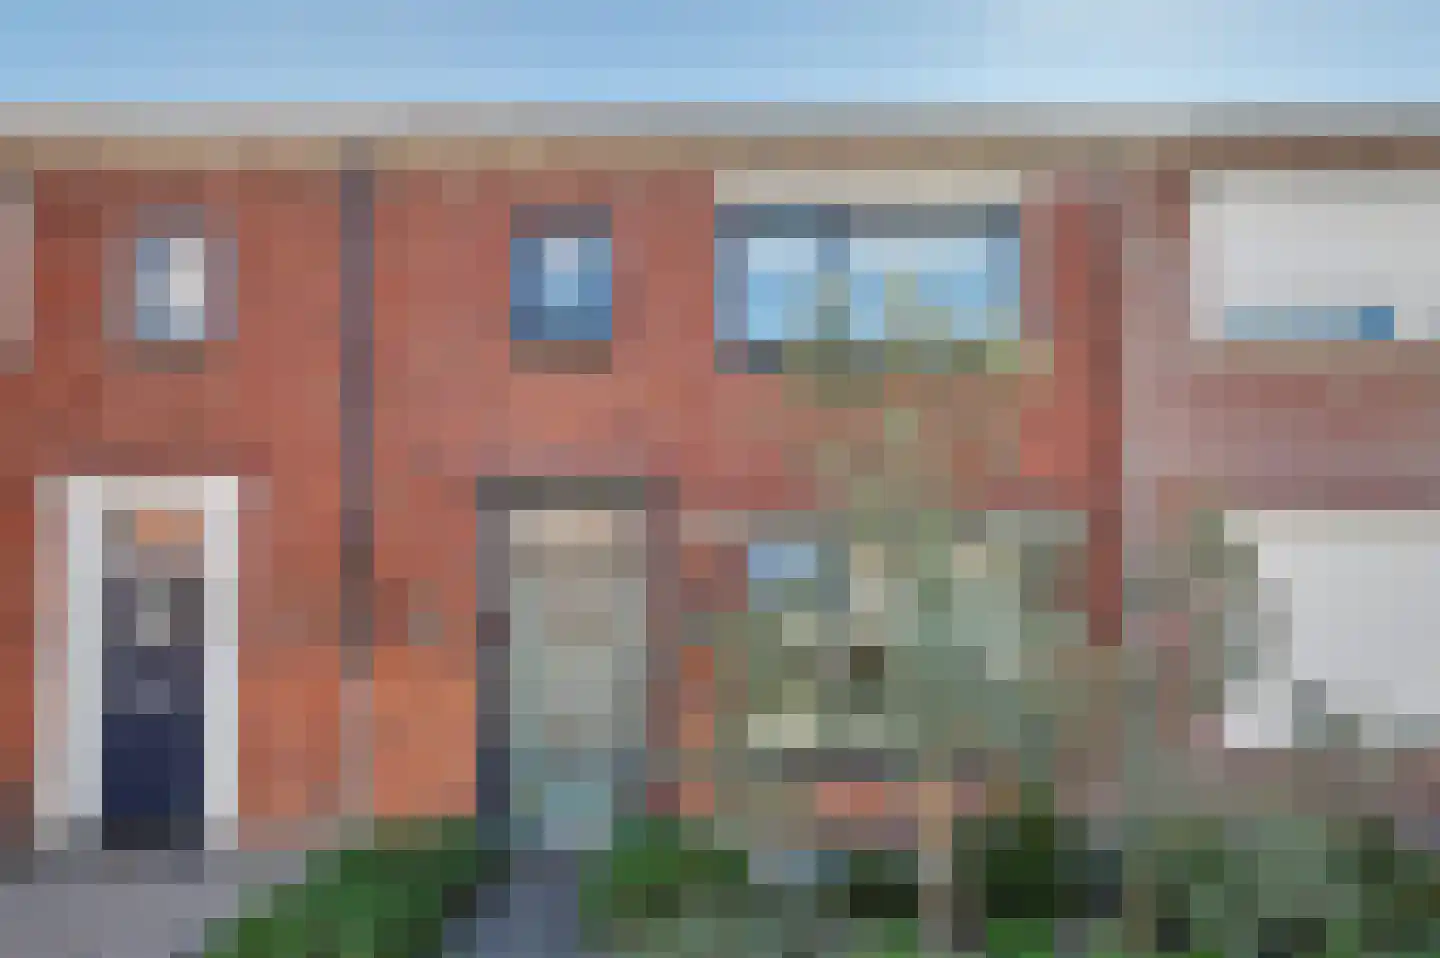
Lijsterbesstraat 14
4306AP Nieuwerkerk
€ 290.000 k.k.
€ 3.333/m²
CSave as favorite- Living area
- 87 m²
- Land area
- 252 m²
- Bedrooms
- 4
-

- Available
Plantage 27
4311AD Bruinisse
€ 140.000 k.k.
Save as favorite- Living area
- 37 m²
- Land area
- 193 m²
- Bedrooms
- 2
-
- Available
Noordstraat 4 G01
4315AT Dreischor
€ 79.000 k.k.
Save as favorite- Living area
- —
- Land area
- 62 m²
- Bedrooms
- —
-
- Available
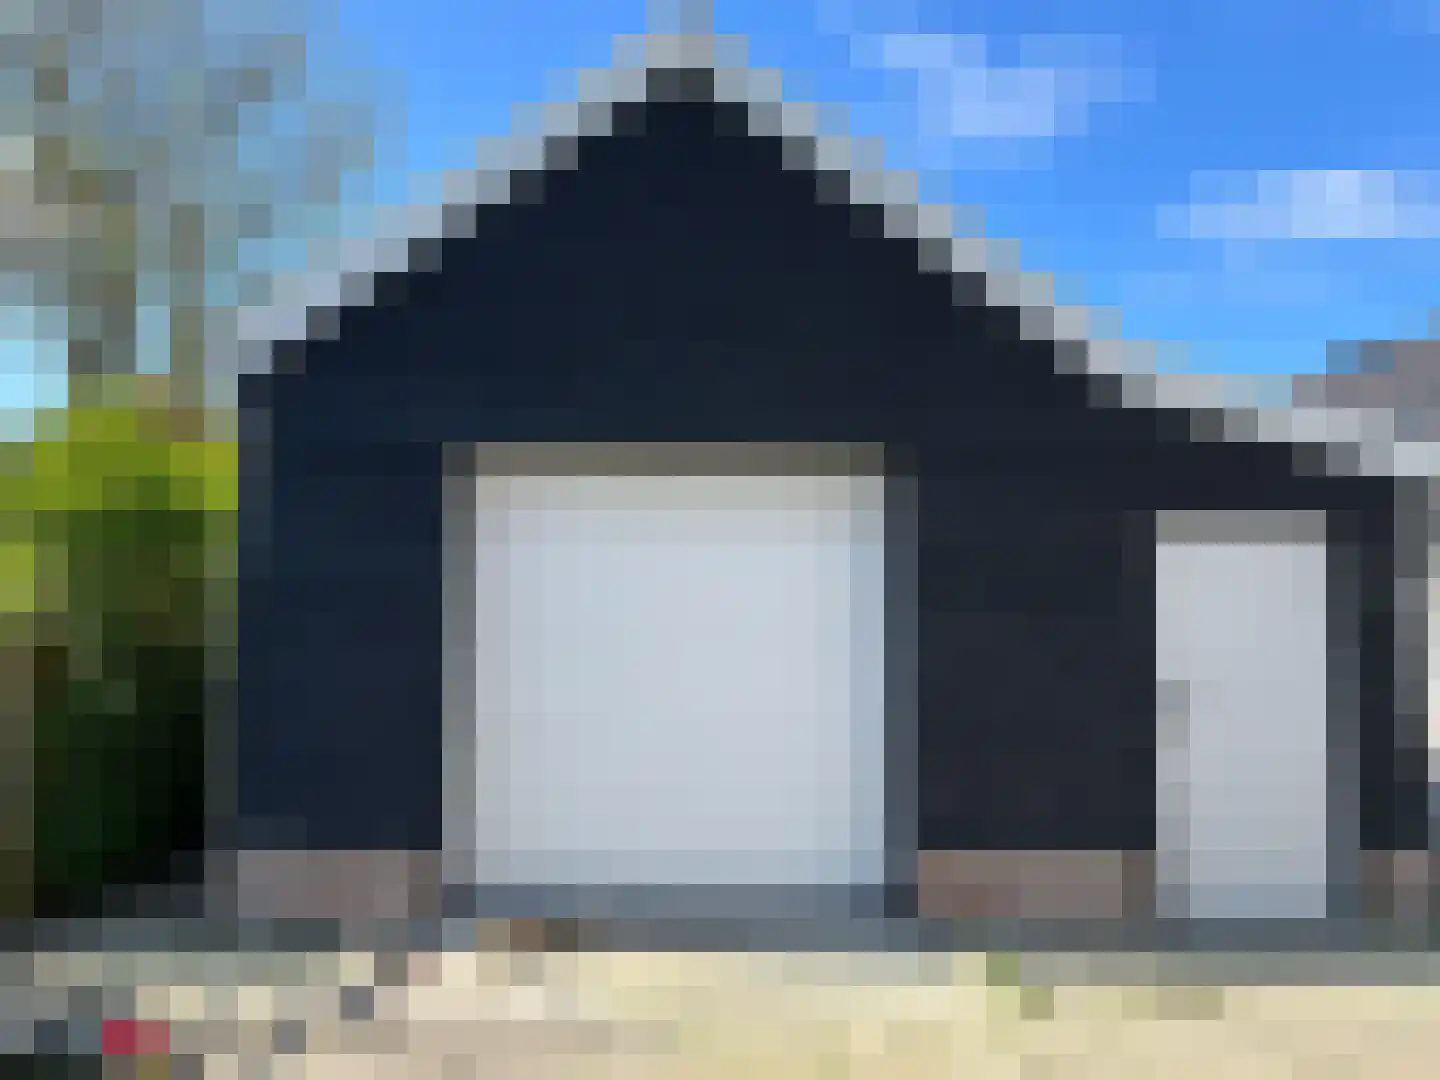
Tuinstraat 3
4306BX Nieuwerkerk
€ 345.000 k.k.
€ 2.924/m²
A+Save as favorite- Living area
- 118 m²
- Land area
- 131 m²
- Bedrooms
- 4
-

- Available
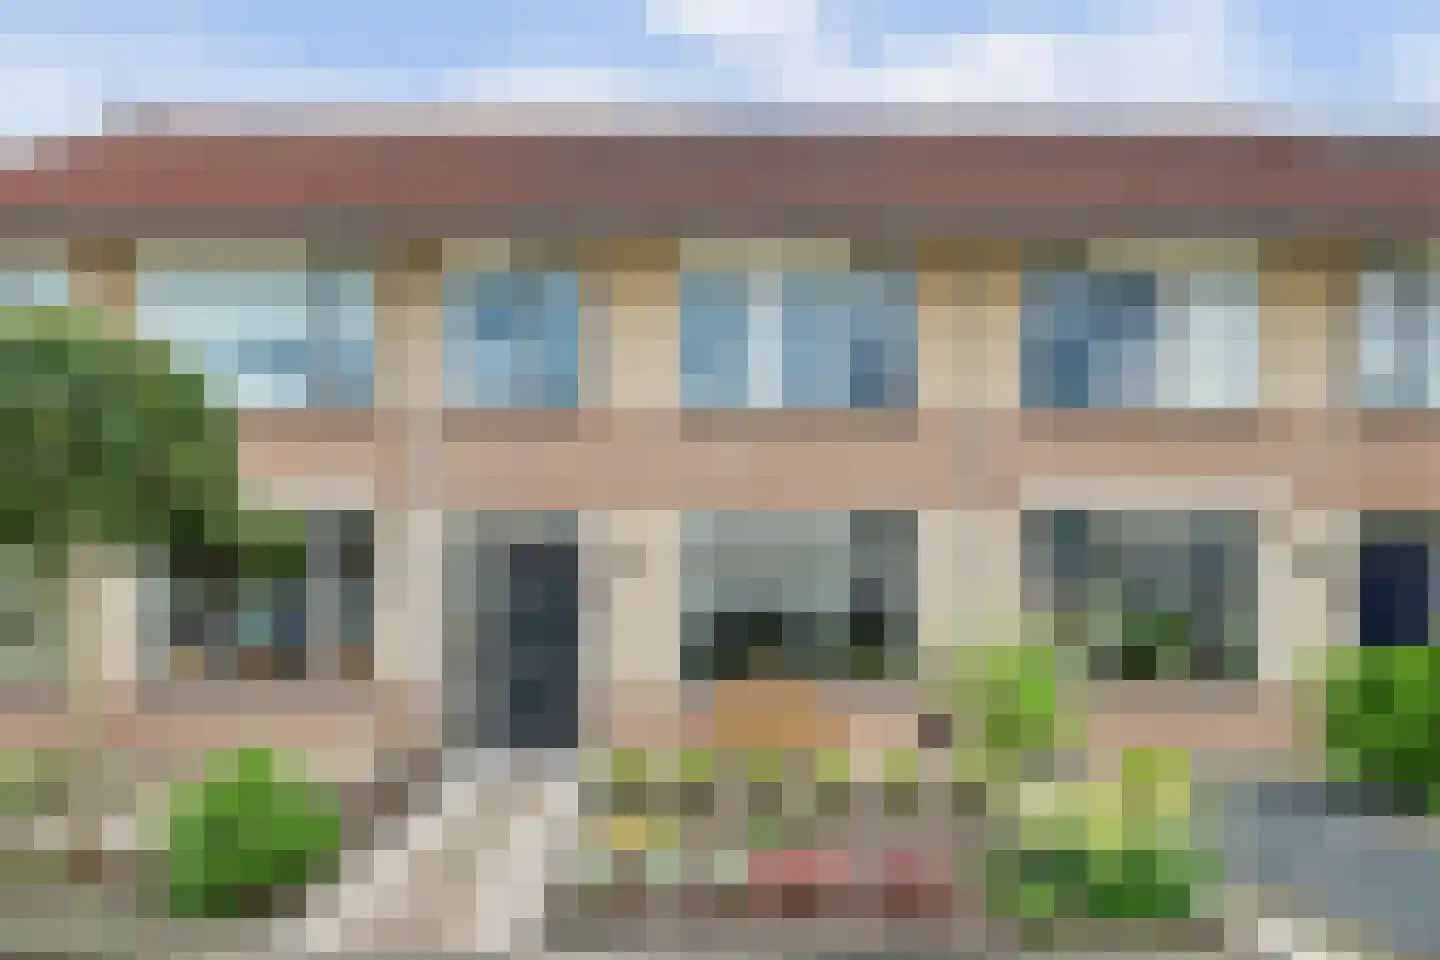
Ring 41
4305AG Ouwerkerk
€ 599.500 k.k.
€ 2.584/m²
DSave as favorite- Living area
- 232 m²
- Land area
- 193 m²
- Bedrooms
- 7
-

- Available
Oostweg 2 0046
4305NA Ouwerkerk
€ 349.000 k.k.
FSave as favorite- Living area
- 80 m²
- Land area
- 828 m²
- Bedrooms
- 2
Reviews (35)
Review platforms
BronscoresTotal score
35 total reviews

Funda
16 reviews on Funda

19 reviews on Google
-
Wouter Pieper
10Aangename ontmoeting tijdens onze bezichtiging. Tijdens onze zoektocht verschillende makelaars ontmoet, en Kooijman stak er met vlag en wimpel bovenuit. Dus zeker een aanrader, mocht je een makelaar zoeken
-
Zuiddijk 9
9Professioneel, rustig maar doortastend, open en eerlijk. Zet een stap extra en geeft een vertrouwd gevoel.
-
Burgemeester Hagelaan 16
9Translated by AIEverything went smoothly. Very nice cooperation. House sold quickly.
-
Vloedstraat 3
8Translated by AIChristian Koster of Makelaardij Kooijman is a quiet, customer-friendly real estate agent. He helps you with advice and support, but also the ladies in the office give clear answers immediately. I have absolutely no regrets about having chosen this real estate agent.
-
Kievitlaan 7
9Translated by AIInitially, the expectations, considering Christian's young age, were not very high. But that proved completely wrong! The contact went smoothly and effortlessly, with short lines and expert advice as you would expect from a good real estate agent. Compliments and thanks!
-
Plataanstraat 10
5Translated by AIWas great! Would not know further explanation. Was just good. Know nothing else to say, helped well.
-
Koningin Julianastraat 14
9Translated by AIThe contact was pleasant and enjoyable from start to finish. Professional and competent. My house was sold very quickly. Definitely a recommendation for Kooijman real estate.
-
Julianastraat 25
8Translated by AIcontact with the person who guided the sale was minimal, but everything from the office went excellently.
-
Erling Steenstraat 11
9Translated by AIEverything to our wishes. Pleasant moments of contact. Good advice and guidance during the sale of our home.
-
Sandströmstraat 14
9Translated by AIThe contact was good, I received good information, the realtor helped me everywhere, I would recommend Kooiman Makelaars to everyone.
-
Ooststraat 28
10Translated by AIWe are very satisfied and well guided during the sale. Fast and good communication with both the real estate agent and assistant. We recommend this real estate agent to everyone who wants to sell a home.
-
Frederikstraat 2 a
9Translated by AIExcellent real estate agent that I can wholeheartedly recommend to anyone looking for a home. Good contacts also via email and app.
-
Burgemeester van Eetenstraat 15
10Translated by AIThe sale of the house went smoothly! We were well helped and guided in the sale of the property, the real estate agent and assistant were always ready for us
-
Bogaardstraat 2
10Translated by AIFrom A to Z everything is in order. Real estate agent Bart has an enormous knowledge of the market. In 3 weeks from being offered for sale to the notary. Hats off to Kooijman real estate agency.
-
Poststraat 26
8Translated by AIExcellent real estate agent. A bit expensive in relation to the work. Strategy was good. The explanation and consultation were also good.
-
Akker 17
9Translated by AIThe entire process went super fast. Good communication and pleasant interactions. From the first contact to the handover in less than 3 months.
-
Korenbloemstraat 1
10Translated by AIEverything went smoothly and seamlessly, some other things also went through the realtor because I wasn't present there. And they had the key.
-
Remco S
10Translated by AIDue to the mortgage granting for a second home, I needed an appraisal of my house on short notice. After submitting a request via the website, I had contact with Leander from Kooijman Makelaardij. An ambitious real estate agent/appraiser who communicated well and quickly. Of course, he had the expertise you would expect; he was realistic and kept his appointments. The appraisal was carried out the next day and the appraisal report was emailed within 48 hours. Excellent, satisfied and recommendable.
-
Adriënne Blok
10Translated by AILeander helped me in my search for a house in Zierikzee. He is very knowledgeable about the market in Schouwen-Duiveland, enthusiastic and expert, gives clear and concrete advice and thinks along with you. He is always willing to go to viewings, flexible and takes all the time. He is accessible and keeps his appointments. Leander translated my wishes into a concrete home, which I am incredibly happy with.
-
margreet de reus
2