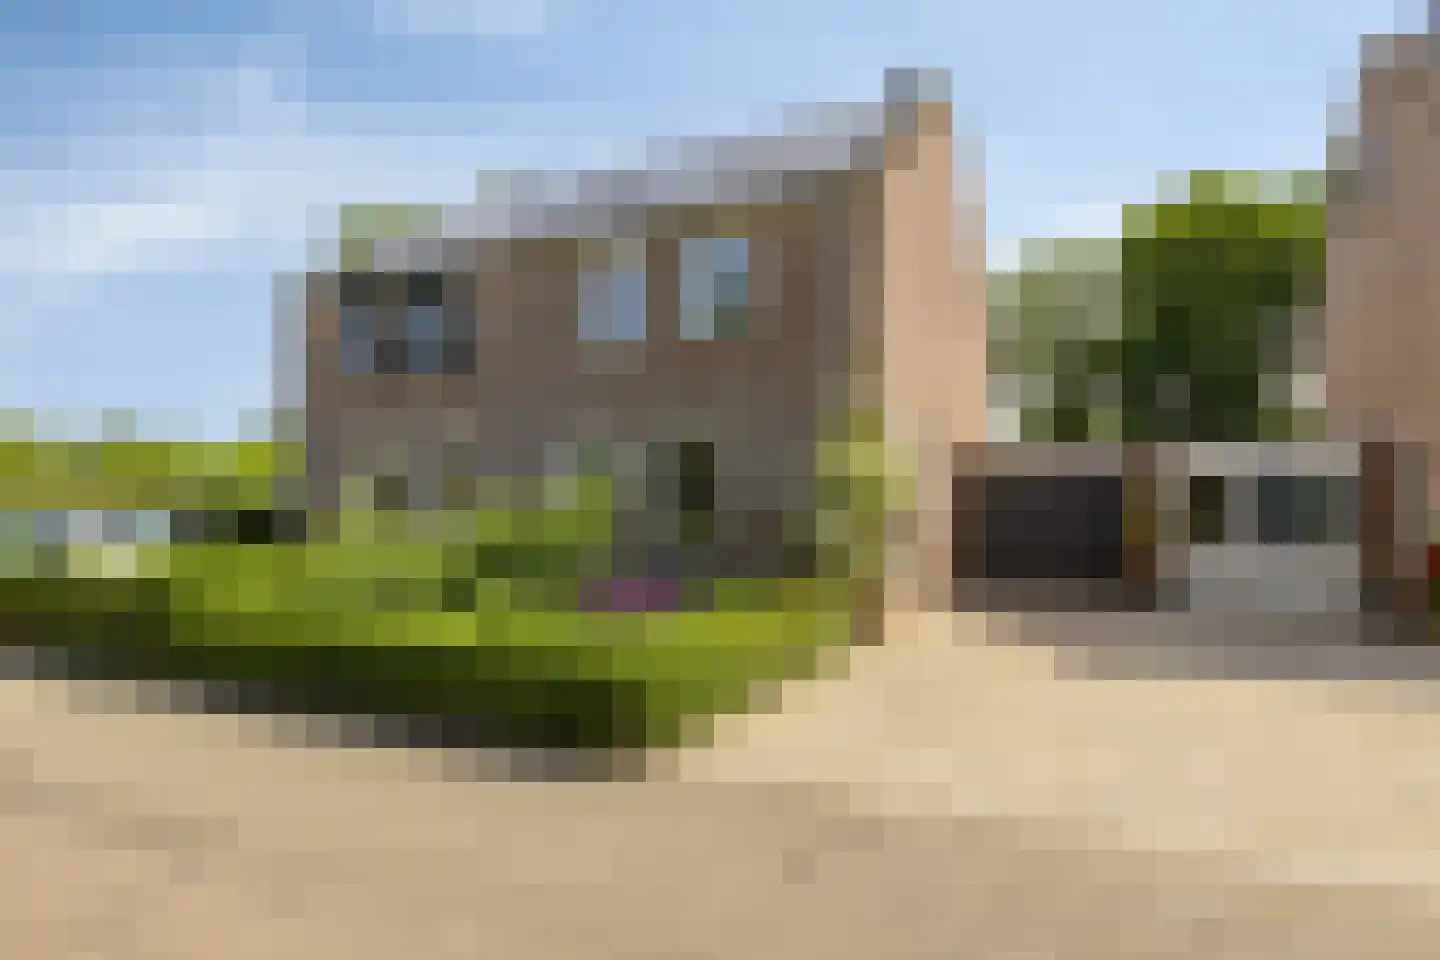
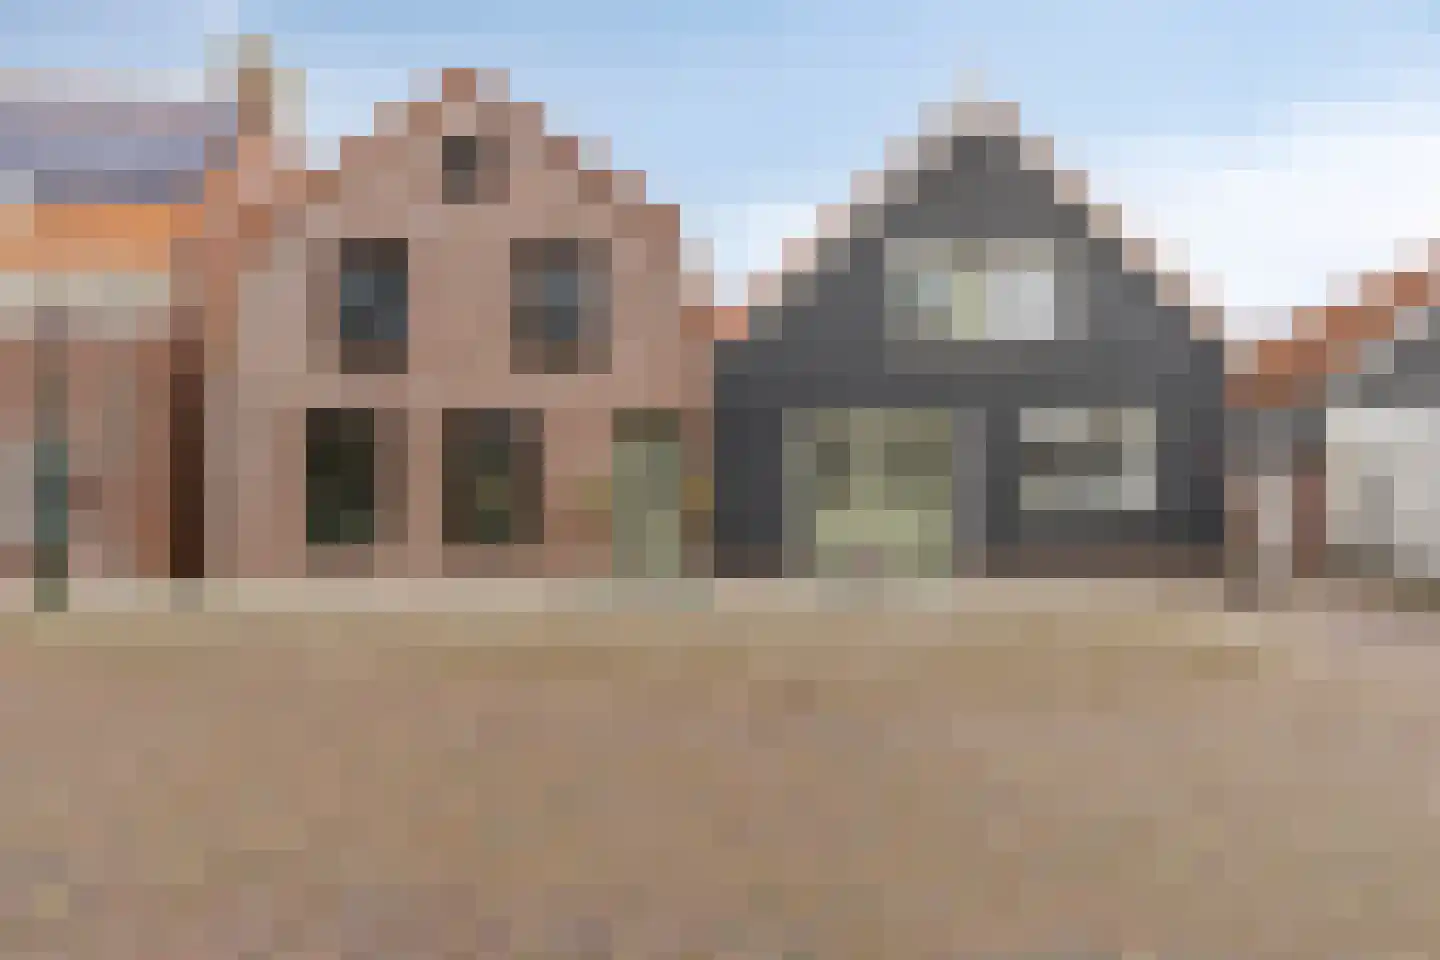
- Available
Loensweg 13
4306NB Nieuwerkerk
€ 550.000 k.k.
€ 3.143/m²
- Living area
- 175 m²
- Land area
- 576 m²
- Bedrooms
- 4
Searching in 43 houses in Nieuwerkerk
Type to search. Use arrow down and arrow up to navigate through results and press Enter to open.
Hidden search suggestions.
View current properties in Nieuwerkerk or search targeted on street, postal code and property characteristics.
View the current housing stock in Nieuwerkerk and quickly filter by price, living area, rooms and more. There are currently 43 houses in this place within our selection. View also 29 sold houses in Nieuwerkerk for extra insight into the local housing market.
4306NB Nieuwerkerk
€ 550.000 k.k.
€ 3.143/m²
4306BS Nieuwerkerk
€ 425.000 k.k.
€ 4.009/m²
4306EG Nieuwerkerk
€ 849.000 k.k.
€ 3.931/m²
4306CM Nieuwerkerk
€ 477.000 k.k.
€ 3.383/m²
4306AS Nieuwerkerk
€ 325.000 k.k.
€ 3.779/m²
4306AA Nieuwerkerk
€ 329.000 k.k.
€ 3.257/m²
4306AP Nieuwerkerk
€ 290.000 k.k.
€ 3.333/m²
4306PL Nieuwerkerk
€ 1.750.000 k.k.
€ 7.743/m²
4306CK Nieuwerkerk
€ 649.000 k.k.
€ 2.545/m²
4306CG Nieuwerkerk
€ 225.000 k.k.
€ 6.250/m²
4306NN Nieuwerkerk
€ 1.995.000 k.k.
€ 5.868/m²
4306NB Nieuwerkerk
€ 849.000 k.k.
€ 4.691/m²
4306CP Nieuwerkerk
€ 12.000 k.k.
4306NP Nieuwerkerk
€ 725.000 k.k.
€ 4.191/m²
4306AV Nieuwerkerk
€ 645.000 k.k.
€ 4.272/m²
4306BX Nieuwerkerk
€ 345.000 k.k.
€ 2.924/m²
4306BH Nieuwerkerk
€ 499.000 k.k.
€ 3.992/m²
4306AG Nieuwerkerk
€ 335.000 k.k.
€ 3.018/m²
4306BJ Nieuwerkerk
€ 369.000 k.k.
€ 3.324/m²
4306NT Nieuwerkerk
Price upon request
4306AC Nieuwerkerk
€ 595.000 k.k.
€ 5.085/m²
4306GA Nieuwerkerk
€ 349.000 k.k.
€ 4.362/m²
4306AS Nieuwerkerk
€ 319.000 k.k.
€ 3.323/m²
4306CT Nieuwerkerk
€ 325.000 k.k.
€ 2.954/m²
4306NH Nieuwerkerk
€ 869.000 k.k.
€ 7.690/m²
4306BS Nieuwerkerk
€ 419.000 k.k.
€ 3.915/m²
4306CM Nieuwerkerk
€ 285.000 k.k.
€ 3.131/m²
4306CA Nieuwerkerk
€ 499.000 k.k.
€ 3.751/m²
Get free quotes from real estate agents with local market knowledge. Compare more than 18 real estate agents in Nieuwerkerk.
Selling a home in Nieuwerkerk? View the sales-oriented guide sell a house in Nieuwerkerk, compare all real estate agents in Nieuwerkerk or view the top 10 real estate agents in Nieuwerkerk for extra context to your choice.
Real estate agents make sharper offers when they know you're comparing — ask for quotes for sale or purchase.
Practical answers about housing supply, sales and comparing real estate agents in Nieuwerkerk.
The costs of a real estate agent in Nieuwerkerk depend on commission, setup costs, property presentation and the chosen service. Compare the 18 real estate agents in Nieuwerkerk via the real estate agent page and request multiple quotes to compare rates and approach well.
Within our selection, we are currently showing 43 houses in Nieuwerkerk. View also the sold houses in Nieuwerkerk to compare the current offering with recent transactions.
Take into account not only price and living area but also maintenance, energy label, location, outdoor space and sales status. This way you compare houses in Nieuwerkerk on more than just the asking price.
A local real estate agent knows the neighborhoods, recent transactions and demand in Nieuwerkerk. By comparing 18 real estate agents in the region you get a better insight into prices, sales strategy and expected yield; the top 10 in Nieuwerkerk provides a useful starting point.
Yes, when making a sales plan, a valuation in Nieuwerkerk is wise. You gain insight into a realistic asking price and can then compare offers from real estate agents specifically.
View current location data on residents, WOZ development, housing stock, energy consumption, business activity and safety in Nieuwerkerk. In 2025 were there 2.755 residents. The average WOZ value in 2025 is EUR 366.000.
These figures help to better assess and compare the housing stock in Nieuwerkerk with recent sold homes. Orient yourself then on suitable top real estate agents in Nieuwerkerk for sales advice in this region.
Residents
2.755
Last year: 2025
Average WOZ
EUR 366.000
Last year: 2025
Average income per person.
EUR 30.900
Source: AllNumbers
Crimes (current year)
39
Total registered
| Year | Residents |
|---|---|
| 2021 | 2.720 |
| 2022 | 2.715 |
| 2023 | 2.765 |
| 2024 | 2.760 |
| 2025 | 2.755 |
| Year | Average WOZ |
|---|---|
| 2021 | EUR 255.000 |
| 2022 | EUR 270.000 |
| 2023 | EUR 308.000 |
| 2024 | EUR 346.000 |
| 2025 | EUR 366.000 |
Hoger
350
Praktisch
500
Middelbaar
1.060
Europa
100
Nederland
2.540
Buiten Europa
115
Label C
257
Label A
233
Label B
211
Label F
139
Label D
95
Label G
80
Label E
72
Label A+
3
Label A++
2
Label A+++
2
Label A+++++
1
Label A++++
0
| Year | Gas (m3) | Electricity (kWh) |
|---|---|---|
| 2020 | 1.320 | 2.980 |
| 2021 | 1.500 | 3.150 |
| 2022 | 1.170 | 2.990 |
| 2023 | 990 | 2.780 |
| 2024 | 970 | 2.860 |
Hoekwoning
Gas: 920 • Electricity: 2.450
Huurwoning
Gas: 790 • Electricity: 1.710
Koopwoning
Gas: 1.040 • Electricity: 3.060
Appartement
Gas: 680 • Electricity: 1.320
Tussenwoning
Gas: 820 • Electricity: 2.170
Vrijstaande woning
Gas: 1.200 • Electricity: 3.540
Twee-onder-één-kap woning
Gas: 950 • Electricity: 2.920
Total number of company establishments: 375
| Period | Crimes |
|---|---|
| jan 2026 | 5 |
| jul 2025 | 4 |
| jun 2025 | 4 |
| mei 2025 | 2 |
| mrt 2025 | 3 |
| mrt 2026 | 2 |
| nov 2024 | 5 |
| nov 2025 | 1 |
| okt 2024 | 2 |
| okt 2025 | 3 |
| sep 2024 | 3 |
| sep 2025 | 0 |
These figures give an indicative picture of safety trends in the living environment of Nieuwerkerk.
Short answers based on current local statistics, handy for a quick comparison of the living environment.
Nieuwerkerk telt in 2025 ongeveer 2.755 inwoners.
De gemiddelde WOZ-waarde in Nieuwerkerk is in 2025 circa € 366.000.
Het gemiddelde inkomen per inwoner in Nieuwerkerk ligt rond € 30.900 per jaar.
Voor het huidige jaar gaat het om ongeveer 39 geregistreerde misdrijven. Gebruik deze cijfers als indicatie en vergelijk trends per periode.
In Nieuwerkerk komt vooral "Vrijstaande woningen" veel voor, met ongeveer 411 woningen.