
DB NVM Makelaars staat voor betrouwbare en persoonlijke dienstverlening in de regio Lansingerland. Wij zijn er om je te begeleiden bij al jouw woonwensen, of het nu gaat om kopen, verkopen of verbouwen. Onze klanten geven ons gemiddeld een 9,2 en zijn tevreden over onze transparante benadering. Wij kijken niet alleen naar het pand, maar vooral naar jou en wat jij nodig hebt. Ons team is gespecialiseerd in slimme marketing en effectieve...
Current housing stock
-

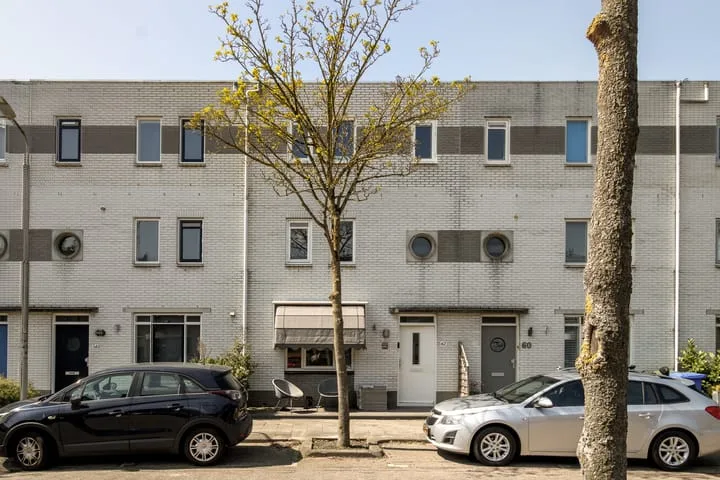
- Available
Hoefweg 60
2665CE Bleiswijk
€ 510.000 k.k.
€ 4.595/m²
CSave as favorite- Living area
- 111 m²
- Land area
- 404 m²
- Bedrooms
- 2
-

- Available
de Vlashoeck 97
2661LZ Bergschenhoek
€ 698.000 k.k.
€ 5.721/m²
BSave as favorite- Living area
- 122 m²
- Land area
- —
- Bedrooms
- 2
-

- Available
Buizerdstraat 12 E
2665TE Bleiswijk
€ 39.500 k.k.
Save as favorite- Living area
- —
- Land area
- 18 m²
- Bedrooms
- —
-

- Available
Vleugelvaren 5
2661PR Bergschenhoek
€ 850.000 k.k.
€ 5.312/m²
A++Save as favorite- Living area
- 160 m²
- Land area
- 303 m²
- Bedrooms
- 4
-

- Available
Grindweg 2
3055VA Rotterdam
€ 700.000 k.k.
€ 6.364/m²
ESave as favorite- Living area
- 110 m²
- Land area
- 301 m²
- Bedrooms
- 5
-

- Available
Maria Enzersdorflaan 7 c
2661KN Bergschenhoek
€ 575.000 k.k.
A+++Save as favorite- Living area
- 95 m²
- Land area
- —
- Bedrooms
- 2
Reviews (124)
Review platforms
BronscoresTotal score
124 total reviews

Funda
51 reviews on Funda

73 reviews on Google
-
David Morel
10Super ervaring gehad met de aankoop van ons huis in Rotterdam Noord. Een meedenkend team van begin tot het einde! Een absolute aanrader
-
Berkelseweg 12
10Dominique en zijn team zijn betrokken, deskundig en houden goed contact! Je wordt vooraf goed geïnformeerd en tijdens de verkoop goed begeleid.
-
Adelaarsvaren 47
9DB Makelaars is flexibel, goed bereikbaar en kan snel schakelen, een fijne partij om mee samen te werken!
-
Pompenburg 346
10Het was een vriendelijke en professionele ondersteuning. Gemakkelijke uitwisseling en transparantie. Ik beveel DB Makelaar van harte aan.
-
Nachtegaallaan 90
9Kennismaking met Vicky was erg prettig en heeft ons doen besluiten om dit kantoor de opdracht te geven. Verder contact ook met de andere medewerkers was goed en steeds vlot.
-
Spinel 63
10Fijne samenwerking. Deskundig, vriendelijk. Korte lijntjes met de mensen op kantoor. Bij vragen kregen we snel en deskundig antwoordt. Echte aanrader. Fijne verkoop van ons huis!!!
-
Romenpad 9
5Aankoopmakelaar ging prima. Foto’s waren goed. Inschatting verkoop duur en prijs was slecht. Wij misten de regie vanuit de makelaar.
-
Rubenslaan 15
9Contact verliep prettig en goed. Ik werd realistisch en goed geïnformeerd en geadviseerd. Bij vragen of mededelingen ontving ik direct een whatsapp bericht, zodat ik steeds goed geïnformeerd bleef.
-
Paul Zanen
10Translated by AIGreat real estate agent! Dominique and his team have helped us very well with the sale of our home. Good knowledge of the market and communication runs smoothly. Wholeheartedly recommended!
-
Oltmansstraat 17
9Makelaar heeft groot netwerk en heeft veel ervaring, hij kent de markt goed en weet er te koop is op de markt. Geeft duidelijk advies. Backoffice goed bereikbaar en service gericht
-
Wilhelminastraat 83
10Fijne gesprekken met makelaar Dominique en ook de medewerkers zijn attent en behulpzaam. Korte lijntjes en komen na wat ze zeggen.
-
Van Keulendreef 51
9ik vond de makelaar prettig en ontspannen!! de app was erg prettig en er was altijd wel iemand om je te woord te staan!!
-
Oosteindseweg 40
10Alles verliep soepel duidelijk en snel. Maar het meest belangrijke dat alles precies ging zoals afgesproken.
-
Loodsmandreef 16
10Wat zijn wij ontzettend blij met deze makelaar! Vanaf het eerste moment open en betrokken. Ze denken echt met je mee, schakelen snel en zijn flexibel waar nodig. Het hele team op kantoor is betrokken en dat voel je in alles. We zijn volledig ontzorgd tijdens het hele proces. Super fijn!
-
Hertshoornvaren 24
10Contact over onze woning verliep goed via de groepsapp. We hebben ons huis dankzij Domenique en collega's goed verkocht. Wij raden deze makelaar zeker aan als je je huis wil verkopen!
-
Zwanensingel 12
9Heel fijne makelaar. Contact met de makelaar verliep heel goed! De lijntjes waren heel kort, omdat het gehele team aan de opdracht was gekoppeld. Zeer aan te raden makelaar.
-
Piet Kramerzoom 11
10Het contact met de makelaar verliep heel soepel via de app/de gesprekken verder waren ze altijd bereikbaar als we vragen hadden. Vicky en haar collega's hebben ons super geholpen bij zowel aan en verkoop van de woningen.
-
Jupiter 82
8Snel en vlot contact! Wist precies de waarde van de buurt en is ook bekend in de buurt. Kan snel schakelen.
-
Julia Van Wijk
10Translated by AIVery happy with our real estate agent. The sale of our house went quickly and smoothly, and we were also helped with the purchase of our new house. Great communication, really thinks along and is always ready for you. Definitely a recommendation!
-
Samantha Stulp
10Translated by AIThe team of DB Makelaars has guided us throughout the entire process of selling our apartment. You would think that for a real estate agent, maybe it's not the most interesting to sell a starter apartment, but Dominique and his team gave us all their attention and time, and we are extremely fine helped through the entire process. Respond quickly, always reachable and just extremely nice. Real professionals who you can really trust with this process with a clear conscience. Thank you again for everything!