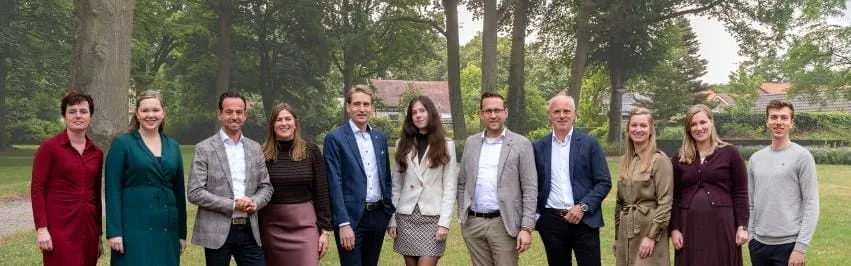

Vanuit ons kantoor in Oldebroek bieden we al jaren professionele bemiddeling en advies op het gebied van onroerend goed. Wij zijn aangesloten bij de Nederlandse Vereniging van Makelaars (NVM), zodat we onze dienstverlening op een hoge kwaliteit kunnen waarborgen. Via www.funda.nl tonen we ons aanbod duidelijk en transparant. Ons team staat altijd voor u klaar, of het nu gaat om de verkoop of aankoop van een woning of om een betrouwbaar...
Current housing stock
-

- Available
Heikamp 63
8091RB Wezep
€ 489.000 k.k.
CSave as favorite- Living area
- 132 m²
- Land area
- 261 m²
- Bedrooms
- 4
-

- Available
Harm Aartsweg 10
8095RE 't Loo Oldebroek
€ 700.000 k.k.
€ 3.004/m²
CSave as favorite- Living area
- 233 m²
- Land area
- 1140 m²
- Bedrooms
- 8
-

- Available
de Hagen 86
8096MK Oldebroek
€ 389.000 k.k.
ASave as favorite- Living area
- 84 m²
- Land area
- 124 m²
- Bedrooms
- 2
-

- Available
Oostendorperstraatweg 2 B
8081RK Elburg
€ 775.000 k.k.
€ 4.454/m²
BSave as favorite- Living area
- 174 m²
- Land area
- 1740 m²
- Bedrooms
- 4
-

- Available
Schipsweg 15
8051KG Hattem
€ 750.000 k.k.
€ 5.357/m²
FSave as favorite- Living area
- 140 m²
- Land area
- 7060 m²
- Bedrooms
- 4
-

- Available
Oude Harderwijkerweg 34
8085PH Doornspijk
€ 1.100.000 k.k.
€ 5.189/m²
ASave as favorite- Living area
- 212 m²
- Land area
- 20140 m²
- Bedrooms
- 4
Reviews (34)
Review platforms
BronscoresTotal score
34 total reviews

Funda
22 reviews on Funda

12 reviews on Google
-
Zuiderzeestraatweg 239
7Redelijk moest vaak zelf dingen doorgeven zoals gesprekken met belangstellenden en foto reportages die niet goed waren .
-
Burgemeester Frieswijkweg 5
10Translated by AIOur experience with Makelaardij Pleiter is very positive. A nice, relaxed atmosphere to reach a result. Clear and honest way of working.
-
Reesweg 1 A
10Translated by AINice contact with Joost Polinder, he was always available for questions or information. He made it a special moment when signing with the new residents.
-
Zuiderzeestraatweg 19
9Translated by AIThe contact with the real estate agent was very good! He is very professional according to our ideas. We are very satisfied!
-
Patrijzenlaan 5
10Translated by AIJoost Polinder, realtor of Pleiter Makelaardij, has guided us professionally through the sales process, taking into account our situation. The secretariat also deserves a plume for the pleasant contacts.
-
Vierschotenweg 14
10Translated by AIJoost Polinder, from Pleiter Makelaars en Taxateurs, has excellently accompanied the entire sale from A to Z, from the first conversation up to and including the signing of the sales contract. In good consultation, the entire house presentation and determination of the sale price were achieved. Always reachable if there were questions and he always made himself known when there were new developments. And not unimportant: the commission is very reasonable. We are very satisfied with the services provided by…
-
Zuiderzeestraatweg 316
9Translated by AIAn involved real estate agent who maintains periodic contact regarding the status and sales strategy of the property.
-
Nesweg 13
10Translated by AIOur property was not an easy object to sell, due to inheritance rights and right of support constructions. Pleiter Makelaars is an expert in the rules and possibilities within the municipality of Kampen. Knowing when to intervene at the right moments. Maintaining good contact with the (in my opinion impossible) rentmeester of the Stadserven Kampereiland. The entire process went smoothly and pleasantly.
-
Wittensteinse allee 4 B
9Translated by AIWe are incredibly satisfied with the pleasant collaboration with Pleijter Makelaardij. Joost Polinder actively thought along with us, was flexible during the entire sales process and gave good advice on all possibilities. What we particularly liked was the fast and clear communication. This gave us confidence that everything would proceed smoothly.
-
Zuideinderhof 20
10Translated by AIContact with Joost was very pleasant. Always friendly and honest about the possibilities and expectations. Our house was sold to our full satisfaction by Joost!
-
Gerrit Blaauwerve 32
10Translated by AIFrom the past, our experience with this broker has been very good, and this time everything also went very smoothly.
-
Prunusstraat 8
10Translated by AIReal estate agent Joost Polinder from Pleiter Makelaardij has helped and advised us wonderfully. If we ever need a real estate agent again, we would definitely choose him.
-
Ben Viegersstraat 20
10Translated by AIVery nice realtor, thinks along very well. Asks the right questions and fast, clear communication. Ensures a flawless process in which we sold our house within a month.
-
de Oosterakker 7
9Translated by AIWe were very pleased with Joost Polinder. He took all the time and researched everything to the smallest detail, because it was a little complex!
-
Weidevogellaan 125
9Translated by AIContact ran smoothly and everything was clearly explained. Friendly realtor who knows their stuff. Explains everything well and very helpful. You can always call with questions and they will call you back.
-
Hogenbrinkweg 26
10Translated by AIExcellent guidance and advice. Received adequate and quick help with questions. Can recommend Makelaardij Pleiter to everyone.
-
Zuideinde Oost 17 en 19
10Translated by AIWhat a reliable and professional real estate agent, and what honest and consistent communication from these experienced experts. This gave us a realistic expectation and provides support and insight into the entire process. We want to recommend Pleiter Makelaars & Taxateurs to everyone looking for a dedicated and driven real estate agent where you receive peace of mind, certainty, and attention when selling or purchasing any real estate!
-
Prunusstraat 13
9Translated by AIExcellent guidance. Friendly and very reliable. Patient and highly skilled. Highly recommended. TOP.
-
Parkweg 12
10Translated by AIIt's pleasant to work with Pleiter real estate agents. Quick processing and good feedback. Price/quality is excellent.
-
Gapersweg 1
8Translated by AIYou can expect everything to be very high, that everything will disappoint. Through all of it, everything went well, right? Changed your mind.