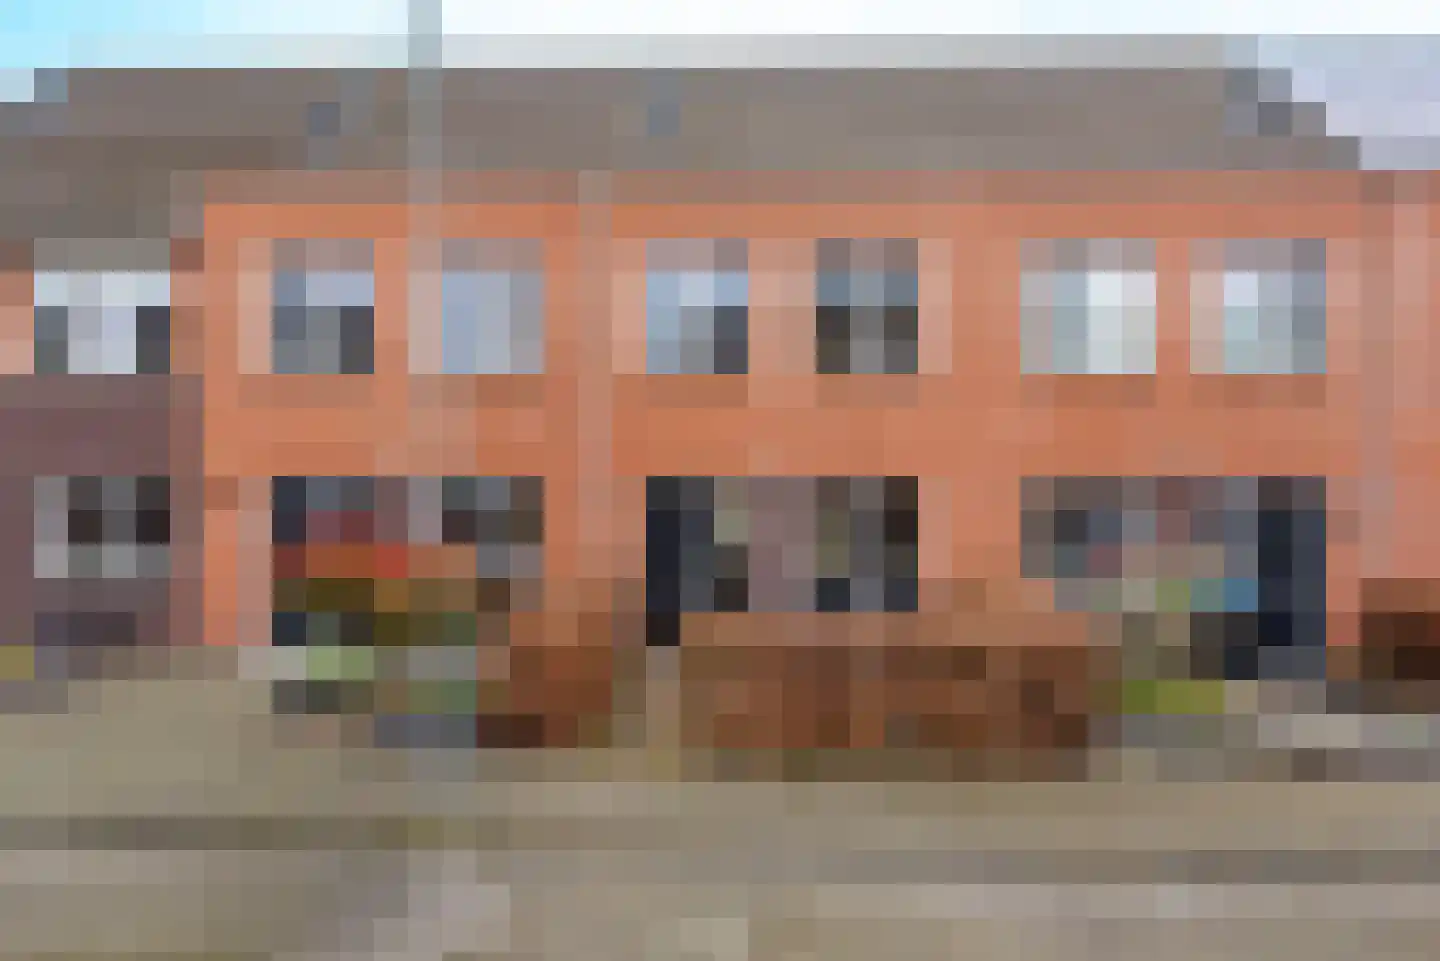
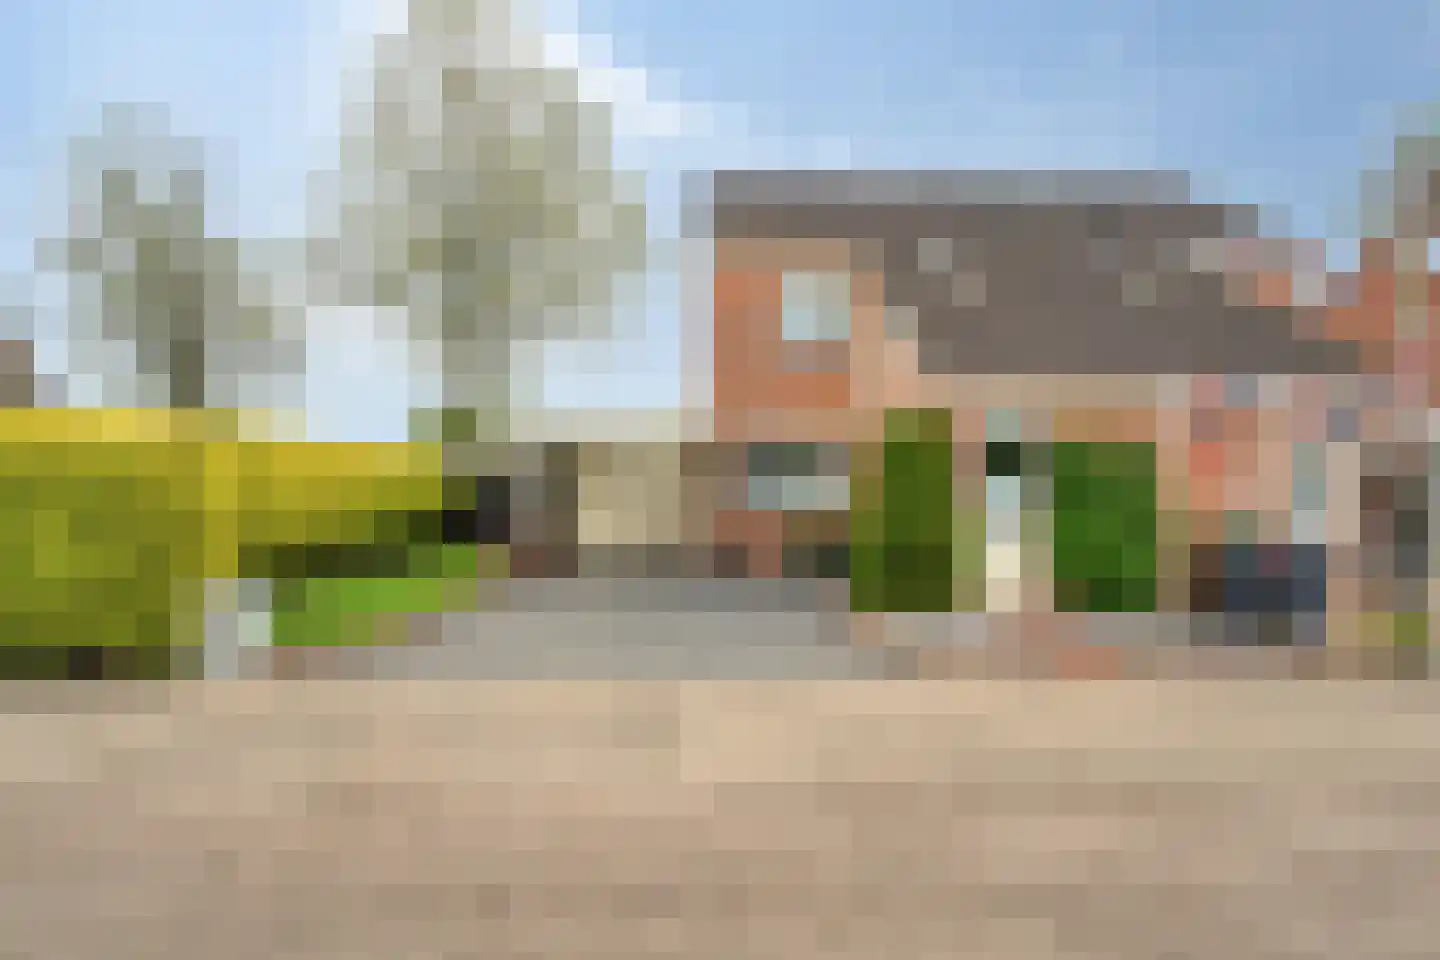
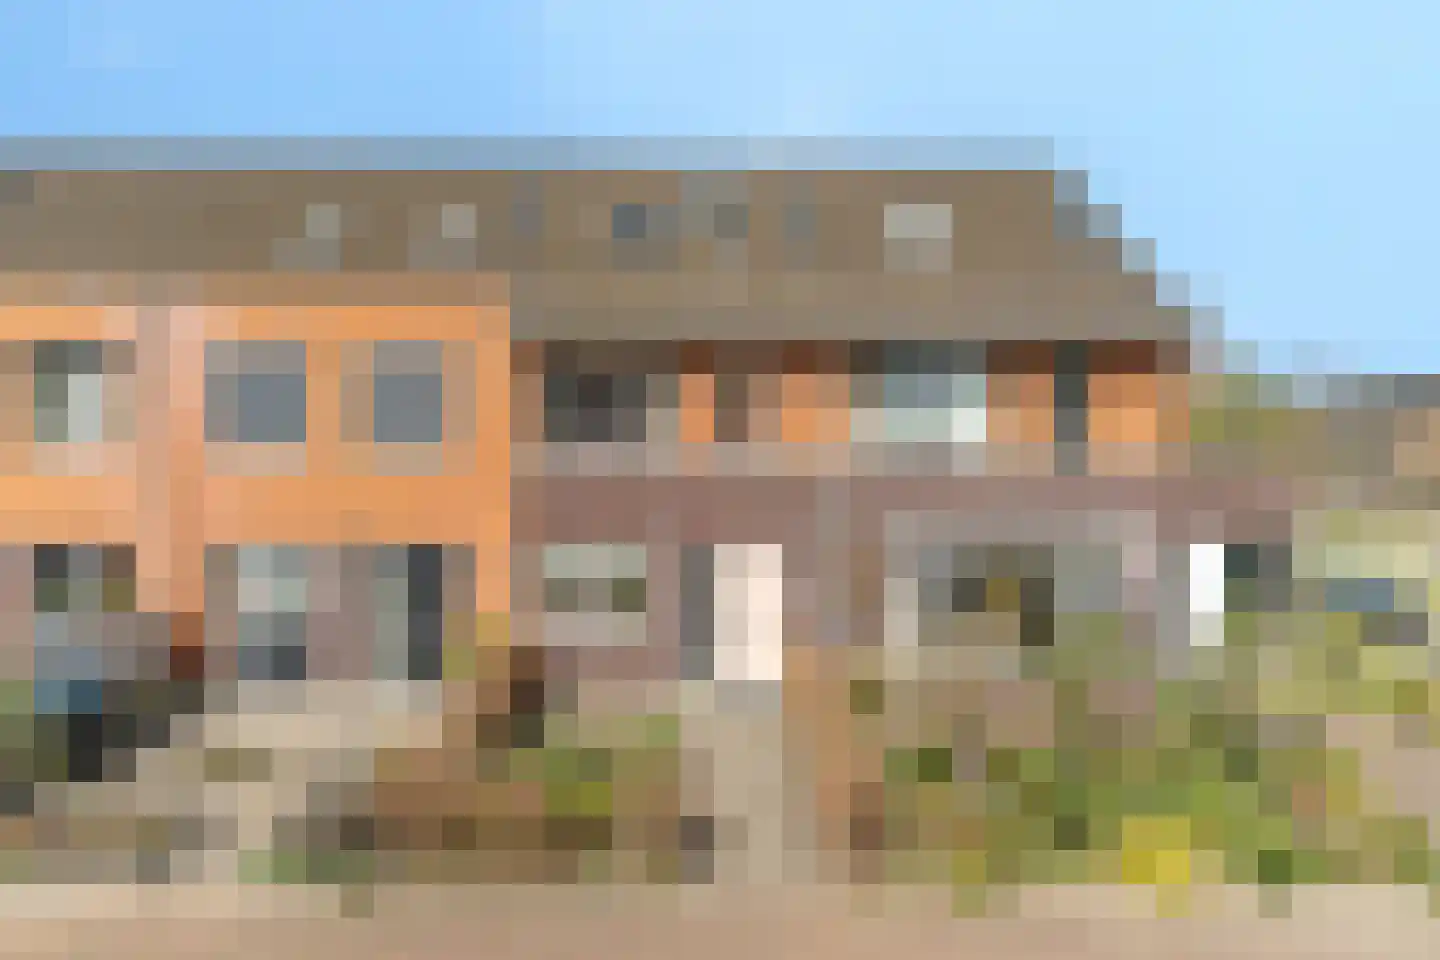
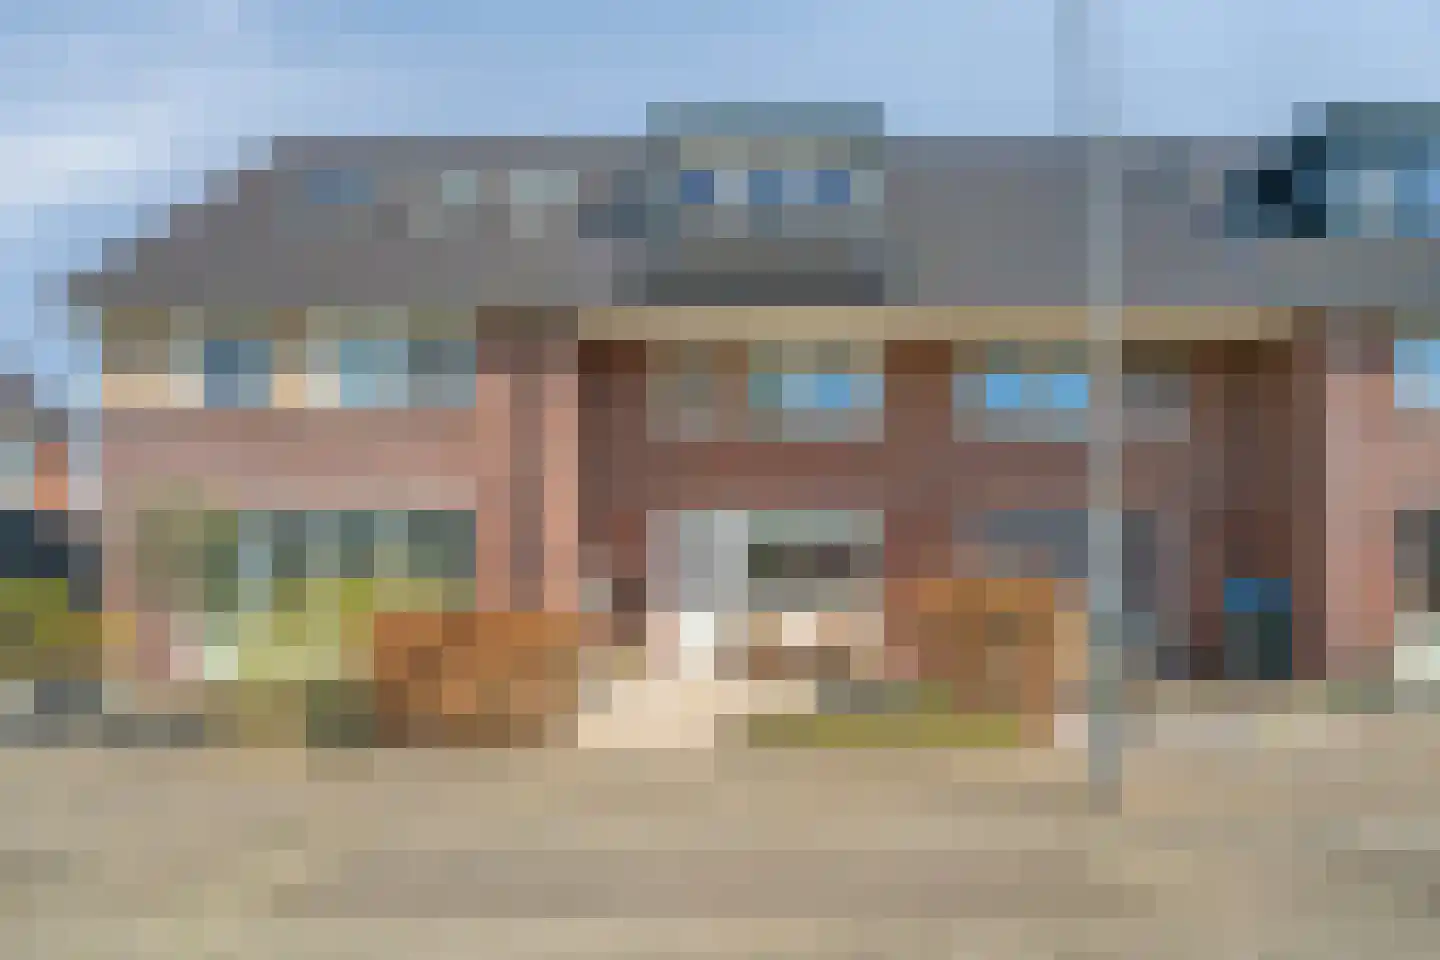
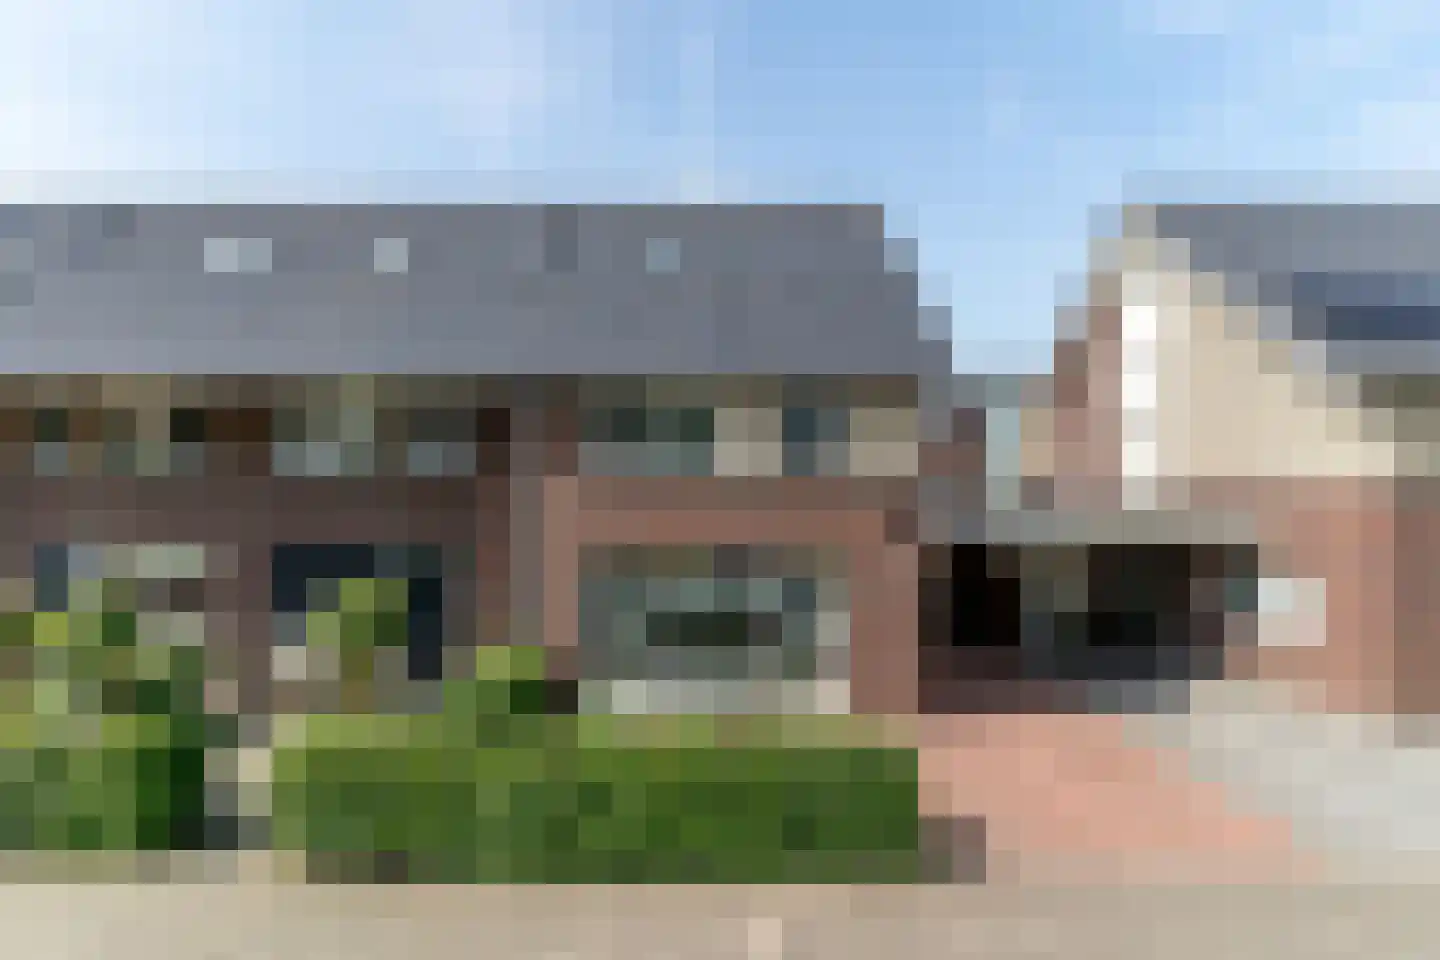
- Available
Westerakker 6
8096MP Oldebroek
€ 535.000 k.k.
€ 3.768/m²
- Living area
- 142 m²
- Land area
- 246 m²
- Bedrooms
- 5
Searching in 68 houses in Oldebroek
Type to search. Use arrow down and arrow up to navigate through results and press Enter to open.
Hidden search suggestions.
View current properties in Oldebroek or search targeted on street, postal code and property characteristics.
View the current housing stock in Oldebroek and quickly filter by price, living area, rooms and more. There are currently 68 houses in this place within our selection. View also 31 sold houses in Oldebroek for extra insight into the local housing market.
8096MP Oldebroek
€ 535.000 k.k.
€ 3.768/m²
8096MK Oldebroek
€ 398.000 k.k.
€ 3.586/m²
8096XP Oldebroek
€ 499.000 k.k.
€ 4.265/m²
8096MT Oldebroek
€ 525.000 k.k.
€ 3.832/m²
8096MG Oldebroek
€ 735.000 k.k.
€ 4.836/m²
8096MA Oldebroek
€ 475.000 k.k.
€ 4.481/m²
8096CN Oldebroek
€ 1.395.000 k.k.
€ 5.386/m²
8096CB Oldebroek
€ 400.000 k.k.
8096MK Oldebroek
€ 389.000 k.k.
8096PL Oldebroek
€ 1.050.000 k.k.
€ 7.895/m²
8096BJ Oldebroek
€ 699.000 k.k.
€ 4.112/m²
8096BG Oldebroek
€ 455.000
€ 4.789/m²
8096BG Oldebroek
€ 455.000
€ 4.840/m²
8096BG Oldebroek
€ 450.000
€ 5.294/m²
8096PM Oldebroek
€ 135.000 k.k.
€ 2.872/m²
8096PM Oldebroek
€ 159.500 k.k.
€ 3.009/m²
8096PR Oldebroek
€ 689.000 k.k.
€ 5.180/m²
8096XC Oldebroek
€ 459.000 k.k.
€ 3.614/m²
8096AS Oldebroek
€ 475.000 k.k.
€ 5.523/m²
8096XC Oldebroek
€ 385.000 k.k.
8096MA Oldebroek
€ 475.000 k.k.
€ 4.524/m²
8096MR Oldebroek
€ 399.000 k.k.
€ 3.500/m²
8096MK Oldebroek
€ 415.000 k.k.
€ 3.915/m²
8096RG Oldebroek
€ 649.000 k.k.
€ 4.603/m²
8096CH Oldebroek
€ 457.500 k.k.
€ 2.807/m²
8096MN Oldebroek
€ 575.000 k.k.
€ 3.549/m²
8096MR Oldebroek
€ 469.000 k.k.
€ 4.150/m²
8096VA Oldebroek
€ 350.000 k.k.
€ 3.043/m²
Get free quotes from real estate agents with local market knowledge. Compare more than 28 real estate agents in Oldebroek.
Selling a home in Oldebroek? Compare all real estate agents in Oldebroek or view the top 10 real estate agents in Oldebroek for extra context for your choice.
Real estate agents make sharper offers when they know you're comparing — ask for quotes for sale or purchase.
Practical answers about housing supply, sales and comparing real estate agents in Oldebroek.
The costs of a real estate agent in Oldebroek depend on commission, setup costs, property presentation and the chosen service. Compare the 28 real estate agents in Oldebroek via the real estate agent page and request multiple quotes to compare rates and approach well.
Within our selection, we are currently showing 68 houses in Oldebroek. View also the sold houses in Oldebroek to compare the current offering with recent transactions.
Take into account not only price and living area but also maintenance, energy label, location, outdoor space and sales status. This way you compare houses in Oldebroek on more than just the asking price.
A local real estate agent knows the neighborhoods, recent transactions and demand in Oldebroek. By comparing 28 real estate agents in the region you get a better insight into prices, sales strategy and expected yield; the top 10 in Oldebroek provides a useful starting point.
Yes, when making a sales plan, a valuation in Oldebroek is wise. You gain insight into a realistic asking price and can then compare offers from real estate agents specifically.
View current location data on residents, WOZ development, housing stock, energy consumption, business activity and safety in Oldebroek. In 2026 were there 6.479 residents. The average WOZ value in 2025 is EUR 402.745.
These figures help to better assess and compare the housing stock in Oldebroek with recent sold homes. Orient yourself then on suitable top real estate agents in Oldebroek for sales advice in this region.
Residents
6.479
Last year: 2026
Average WOZ
EUR 402.745
Last year: 2025
Average income per person.
EUR 14.080
Source: AllNumbers
Crimes (current year)
94
Total registered
| Year | Residents |
|---|---|
| 2021 | 6.270 |
| 2022 | 6.340 |
| 2023 | 6.415 |
| 2024 | 6.430 |
| 2025 | 6.405 |
| 2026 | 6.479 |
| Year | Average WOZ |
|---|---|
| 2021 | EUR 309.008 |
| 2022 | EUR 331.647 |
| 2023 | EUR 370.315 |
| 2024 | EUR 377.170 |
| 2025 | EUR 402.745 |
Hoger
610
Praktisch
1.550
Middelbaar
2.210
Europa
210
Nederland
5.935
Buiten Europa
260
Label A
729
Label C
493
Label B
410
Label G
388
Label D
218
Label F
177
Label E
110
Label A+++
62
Label A+
35
Label A++
8
Label A++++
7
Label A+++++
0
| Year | Gas (m3) | Electricity (kWh) |
|---|---|---|
| 2020 | 1.439 | 3.280 |
| 2021 | 1.545 | 3.340 |
| 2022 | 1.209 | 3.141 |
| 2023 | 996 | 3.019 |
| 2024 | 957 | 3.136 |
Hoekwoning
Gas: 795 • Electricity: 2.495
Huurwoning
Gas: 827 • Electricity: 2.314
Koopwoning
Gas: 1.076 • Electricity: 3.315
Appartement
Gas: 819 • Electricity: 2.476
Tussenwoning
Gas: 628 • Electricity: 1.864
Vrijstaande woning
Gas: 1.280 • Electricity: 3.768
Twee-onder-één-kap woning
Gas: 1.043 • Electricity: 3.244
Total number of company establishments: 795
| Period | Crimes |
|---|---|
| jan 2026 | 8 |
| jul 2025 | 11 |
| jun 2025 | 7 |
| mei 2025 | 11 |
| mrt 2025 | 6 |
| mrt 2026 | 10 |
| nov 2024 | 9 |
| nov 2025 | 8 |
| okt 2024 | 8 |
| okt 2025 | 8 |
| sep 2024 | 6 |
| sep 2025 | 11 |
These figures give an indicative picture of safety trends in the living environment of Oldebroek.
Short answers based on current local statistics, handy for a quick comparison of the living environment.
Oldebroek telt in 2026 ongeveer 6.479 inwoners.
De gemiddelde WOZ-waarde in Oldebroek is in 2025 circa € 402.745.
Het gemiddelde inkomen per inwoner in Oldebroek ligt rond € 14.080 per jaar.
Voor het huidige jaar gaat het om ongeveer 94 geregistreerde misdrijven. Gebruik deze cijfers als indicatie en vergelijk trends per periode.
In Oldebroek komt vooral "Vrijstaande woningen" veel voor, met ongeveer 836 woningen.