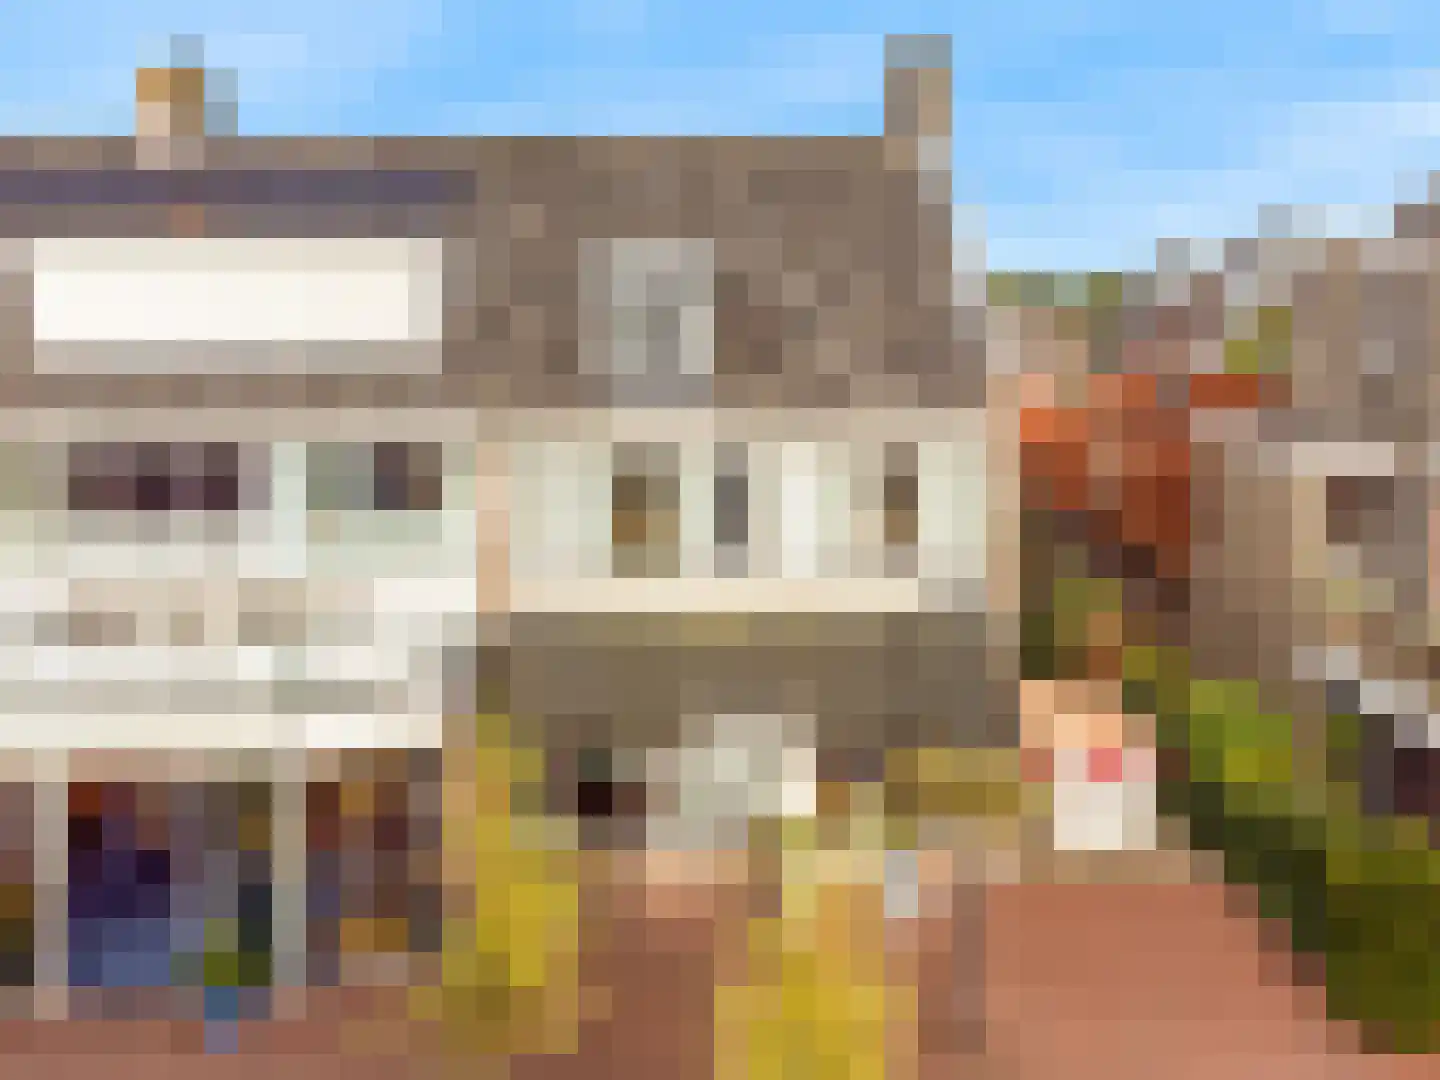
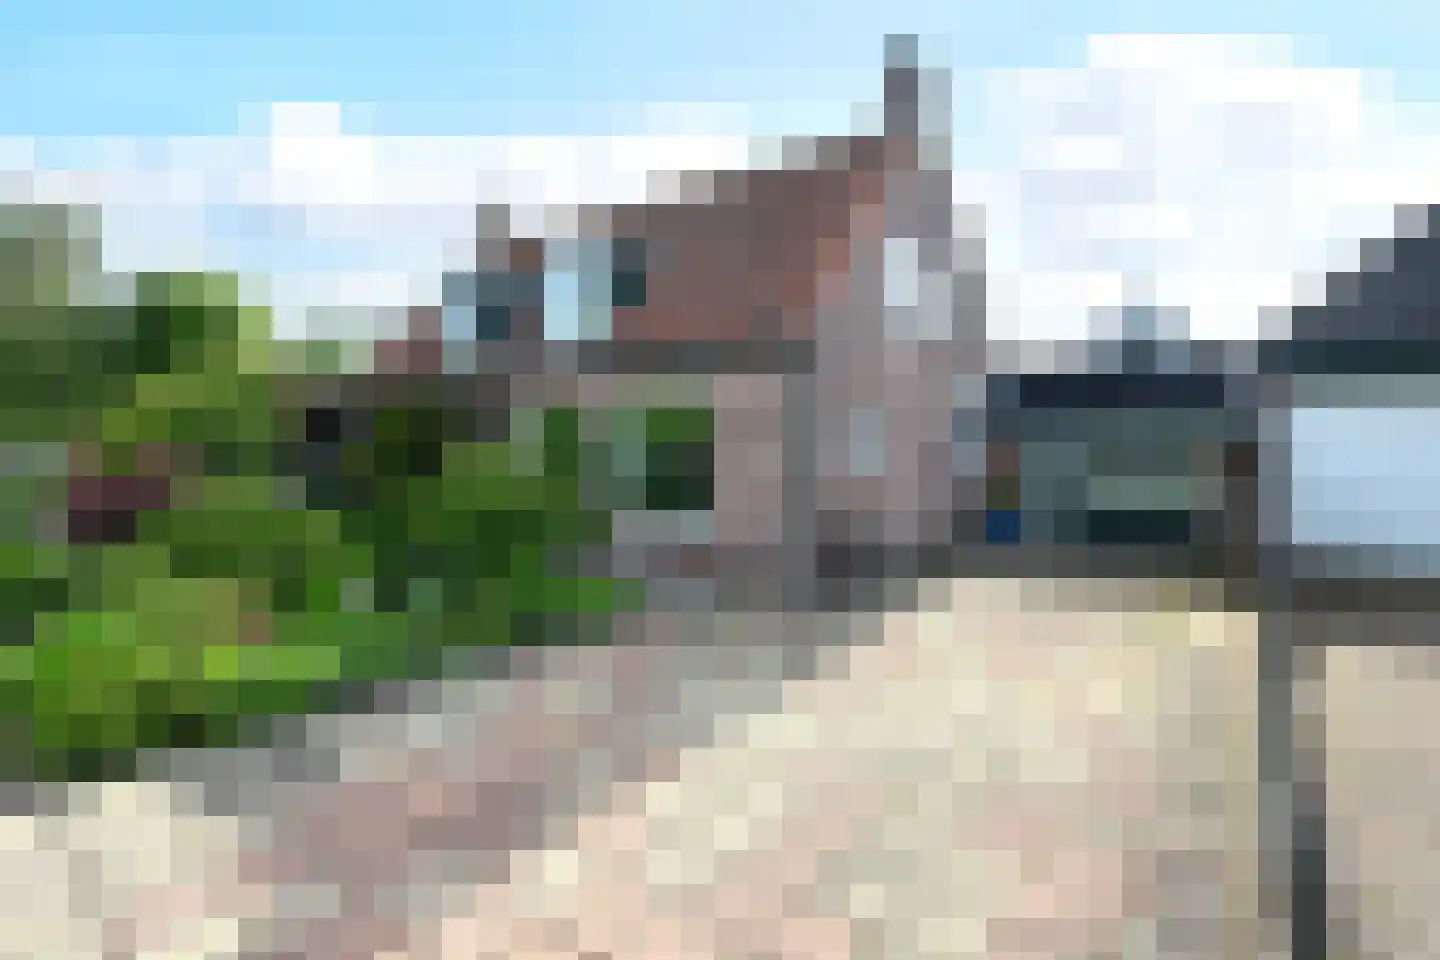
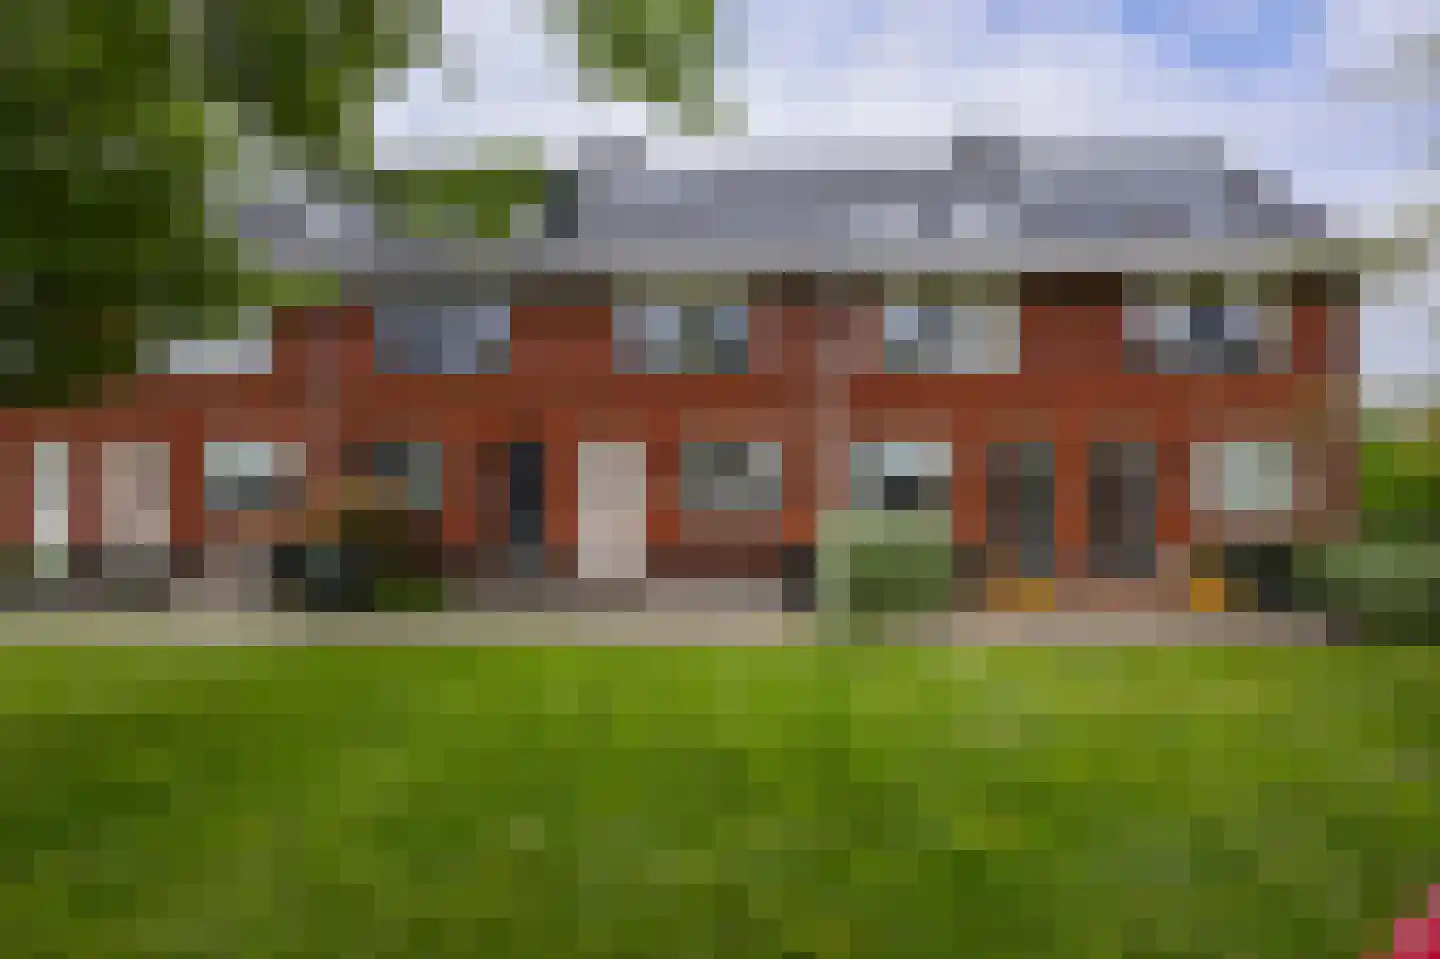
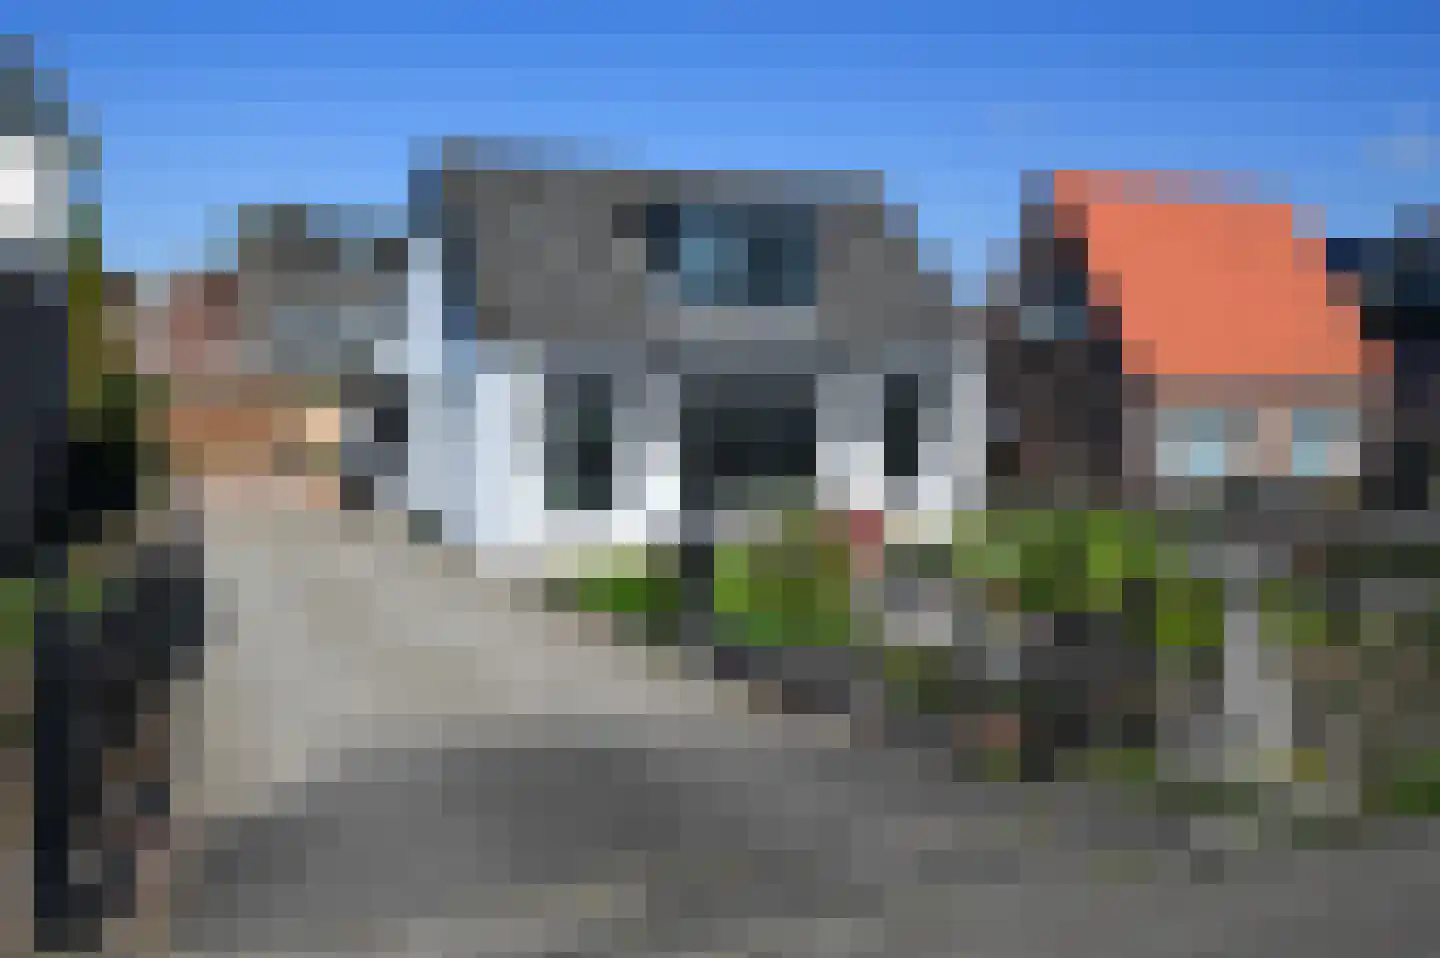
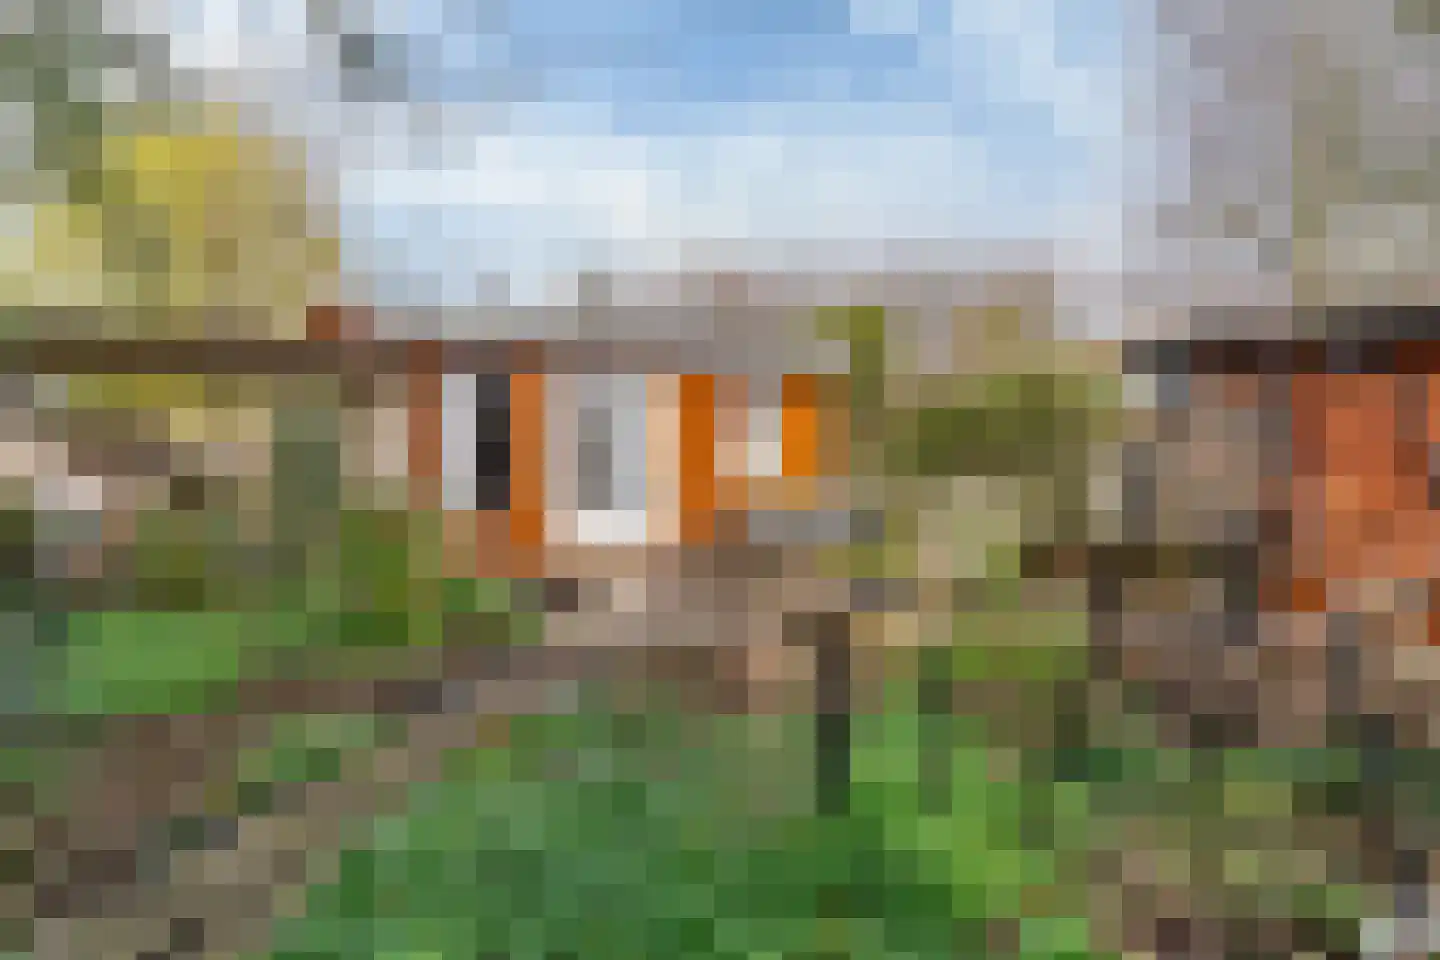
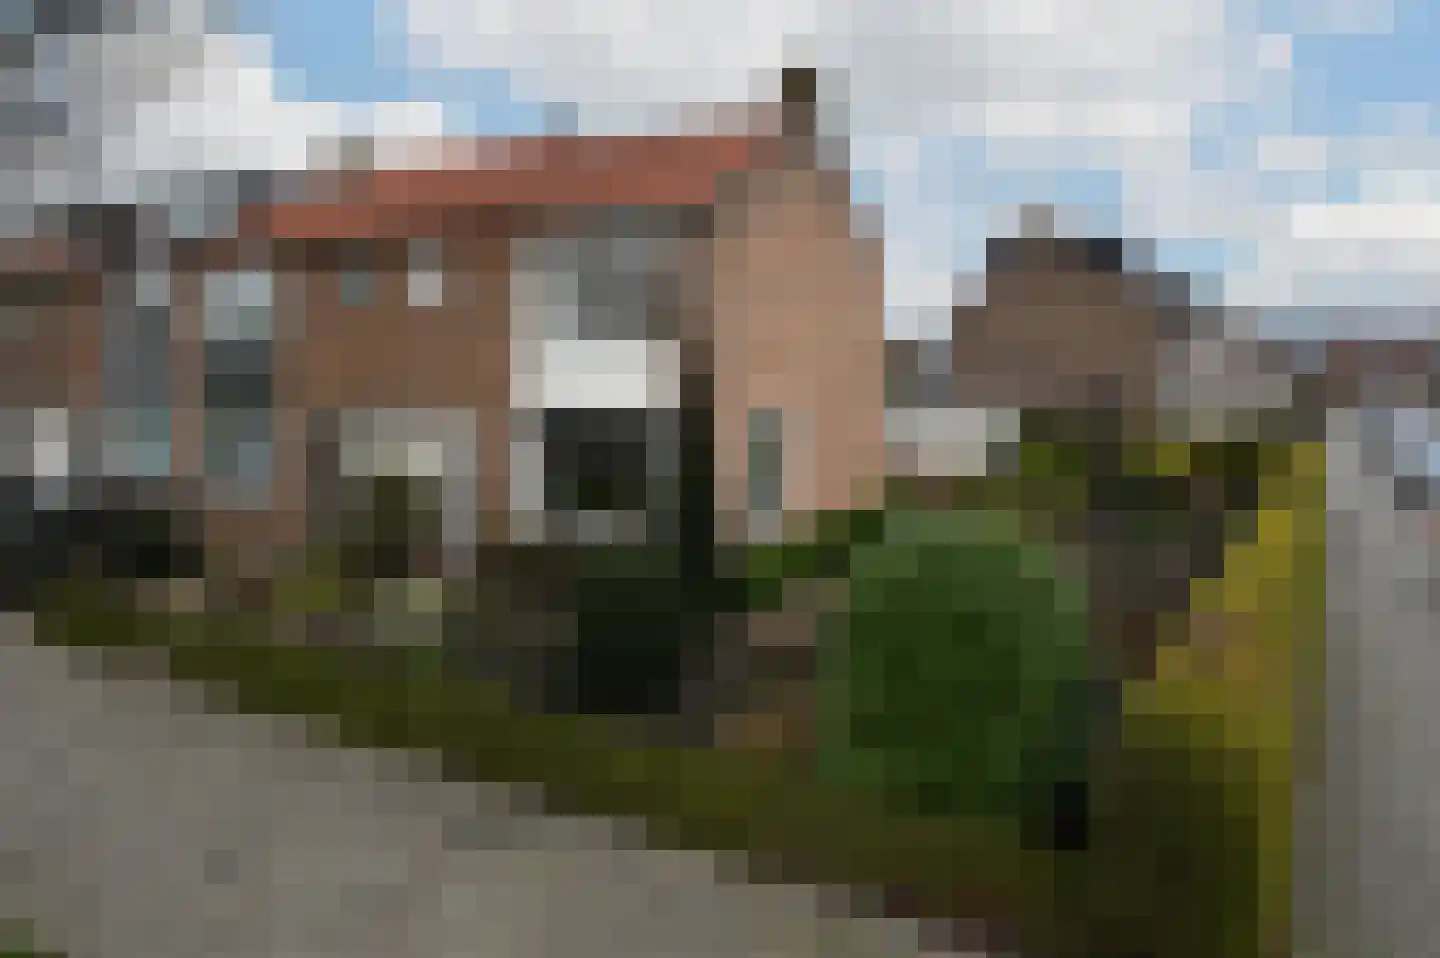
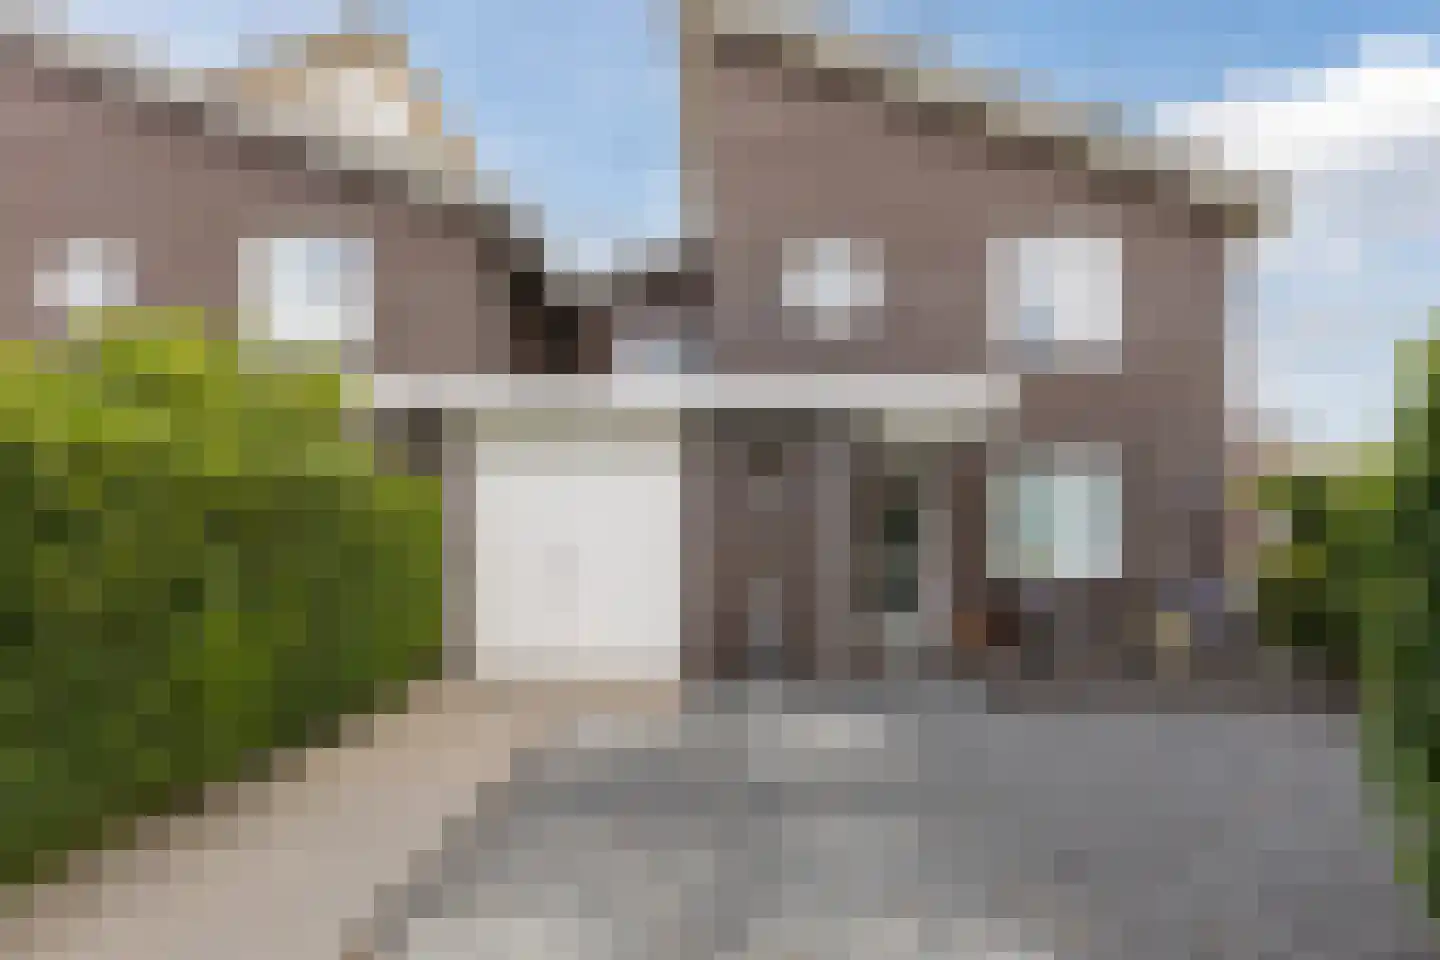
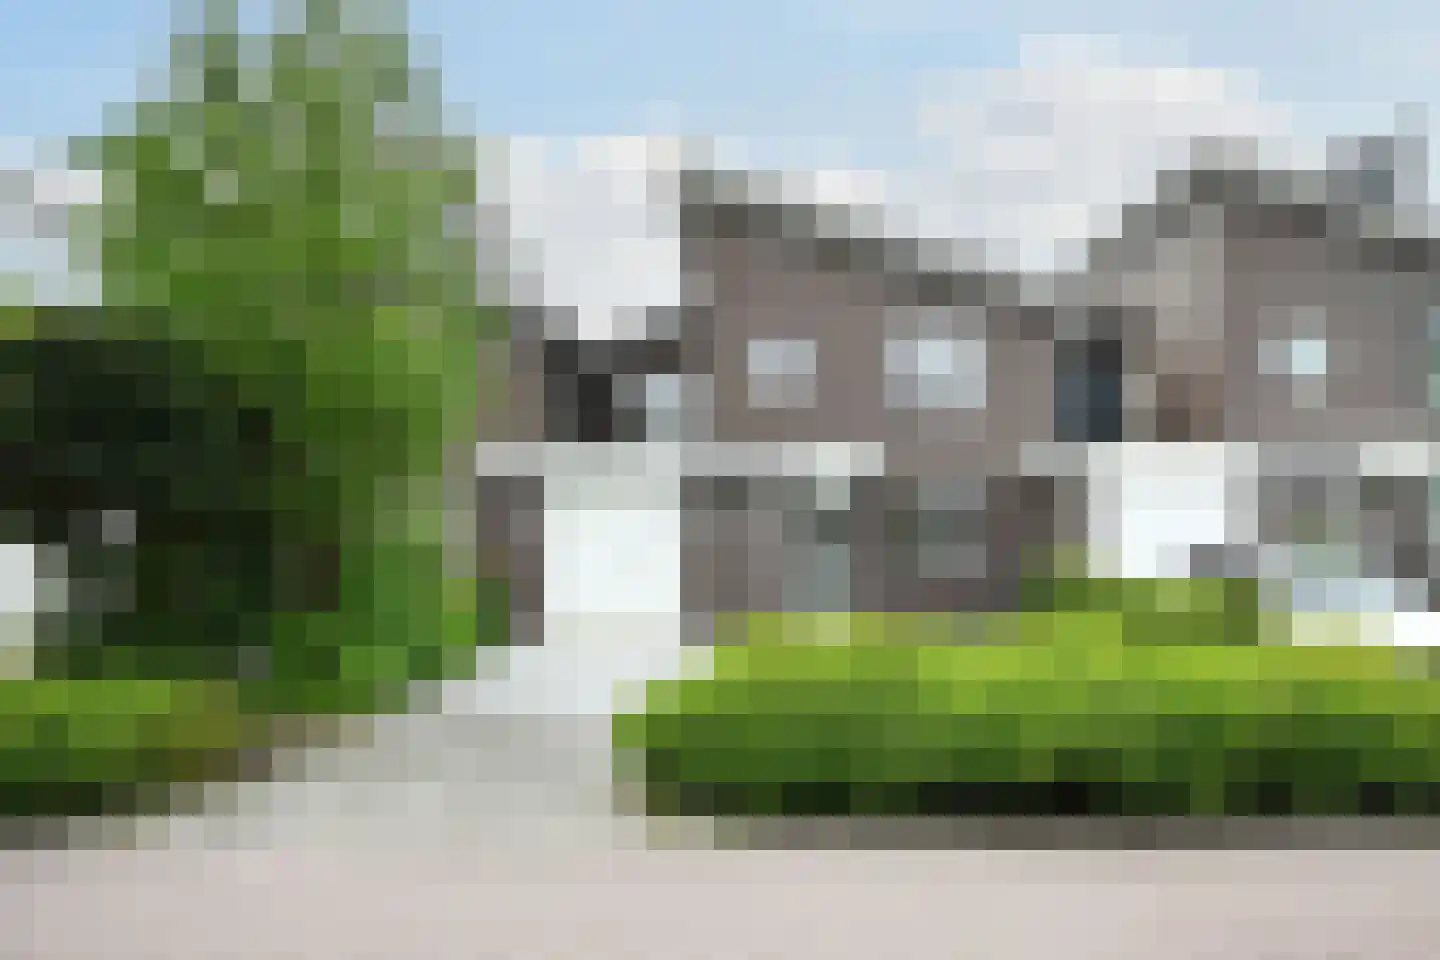
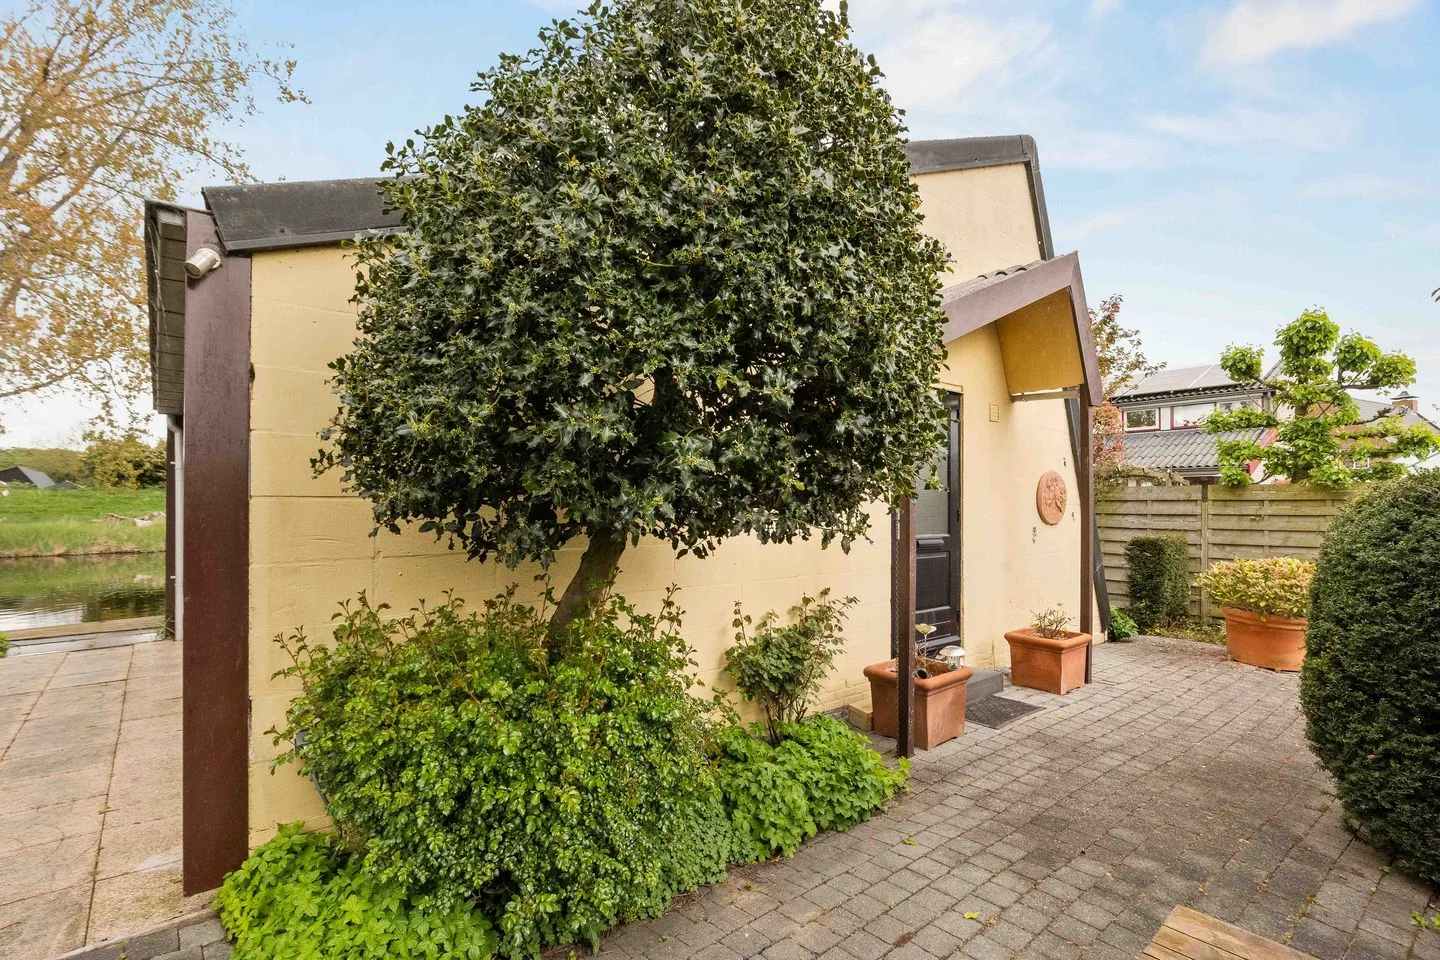
- Available
Het Fort 36
1424RW De Kwakel
€ 375.000 k.k.
€ 6.356/m²
- Living area
- 59 m²
- Land area
- 343 m²
- Bedrooms
- 1
Searching in 55 houses in De Kwakel
Type to search. Use arrow down and arrow up to navigate through results and press Enter to open.
Hidden search suggestions.
View current properties in De Kwakel or search targeted on street, postal code and property characteristics.
View the current housing stock in De Kwakel and quickly filter by price, living area, rooms and more. There are currently 55 houses in this place within our selection. View also 36 sold houses in De Kwakel for extra insight into the local housing market.
1424RW De Kwakel
€ 375.000 k.k.
€ 6.356/m²
1424BK De Kwakel
€ 695.000 k.k.
€ 3.639/m²
1424RB De Kwakel
€ 635.000 k.k.
€ 3.396/m²
1424NV De Kwakel
€ 1.450.000 k.k.
€ 5.918/m²
1424SJ De Kwakel
€ 495.000 k.k.
€ 5.211/m²
1424RA De Kwakel
€ 575.000 k.k.
€ 6.609/m²
1424PA De Kwakel
€ 1.950.000 k.k.
€ 5.669/m²
1424AW De Kwakel
€ 719.000 k.k.
€ 5.531/m²
1424RK De Kwakel
€ 95.000 k.k.
€ 3.064/m²
1424BK De Kwakel
€ 595.000
€ 7.438/m²
1424AP De Kwakel
€ 450.000 k.k.
€ 6.250/m²
1424EB De Kwakel
€ 829.000 k.k.
€ 5.348/m²
1424EK De Kwakel
€ 799.000 k.k.
€ 4.813/m²
1424PT De Kwakel
€ 925.000 k.k.
1424DB De Kwakel
€ 339.000 k.k.
€ 6.164/m²
1424AW De Kwakel
€ 865.000 k.k.
€ 4.023/m²
1424MA De Kwakel
€ 415.000 k.k.
€ 6.103/m²
1424CH De Kwakel
€ 525.000 k.k.
€ 4.303/m²
1424CP De Kwakel
€ 950.000 k.k.
€ 5.523/m²
1424DA De Kwakel
€ 599.000 k.k.
€ 6.372/m²
1424NA De Kwakel
€ 1.065.000 k.k.
€ 5.433/m²
1424MA De Kwakel
€ 415.000 k.k.
€ 6.102/m²
1424RA De Kwakel
€ 399.500 k.k.
€ 6.658/m²
1424EM De Kwakel
€ 579.000 k.k.
€ 4.907/m²
1424SG De Kwakel
€ 629.000 k.k.
€ 5.114/m²
1424SB De Kwakel
€ 595.000 k.k.
€ 4.250/m²
1424PA De Kwakel
€ 1.175.000 k.k.
€ 8.216/m²
1424AK De Kwakel
€ 435.000 k.k.
€ 4.627/m²
Get free quotes from real estate agents with local market knowledge. Compare more than 93 real estate agents in De Kwakel.
Selling a home in De Kwakel? Compare all real estate agents in De Kwakel or view the top 10 real estate agents in De Kwakel for extra context for your choice.
Real estate agents make sharper offers when they know you're comparing — ask for quotes for sale or purchase.
Practical answers about housing supply, sales and comparing real estate agents in De Kwakel.
The costs of a real estate agent in De Kwakel depend on commission, setup costs, property presentation and the chosen service. Compare the 93 real estate agents in De Kwakel via the real estate agent page and request multiple quotes to compare rates and approach well.
Within our selection, we are currently showing 55 houses in De Kwakel. View also the sold houses in De Kwakel to compare the current offering with recent transactions.
Take into account not only price and living area but also maintenance, energy label, location, outdoor space and sales status. This way you compare houses in De Kwakel on more than just the asking price.
A local real estate agent knows the neighborhoods, recent transactions and demand in De Kwakel. By comparing 93 real estate agents in the region you get a better insight into prices, sales strategy and expected yield; the top 10 in De Kwakel provides a useful starting point.
Yes, when making a sales plan, a valuation in De Kwakel is wise. You gain insight into a realistic asking price and can then compare offers from real estate agents specifically.
View current location data on residents, WOZ development, housing stock, energy consumption, business activity and safety in De Kwakel. In 2025 were there 5.081 residents. The average WOZ value in 2025 is EUR 480.668.
These figures help to better assess and compare the housing stock in De Kwakel with recent sold homes. Orient yourself then on suitable top real estate agents in De Kwakel for sales advice in this region.
Residents
5.081
Last year: 2025
Average WOZ
EUR 480.668
Last year: 2025
Average income per person.
EUR 29.583
Source: AllNumbers
Crimes (current year)
150
Total registered
| Year | Residents |
|---|---|
| 2021 | 4.526 |
| 2022 | 4.669 |
| 2023 | 4.785 |
| 2024 | 4.821 |
| 2025 | 5.081 |
| Year | Average WOZ |
|---|---|
| 2021 | EUR 355.688 |
| 2022 | EUR 396.384 |
| 2023 | EUR 460.814 |
| 2024 | EUR 466.924 |
| 2025 | EUR 480.668 |
Hoger
826
Praktisch
960
Middelbaar
1.666
Europa
637
Nederland
3.930
Buiten Europa
513
Label A
714
Label C
489
Label B
324
Label A+++
197
Label D
141
Label G
104
Label E
88
Label F
83
Label A+
50
Label A++++
12
Label A++
9
Label A+++++
3
| Year | Gas (m3) | Electricity (kWh) |
|---|---|---|
| 2020 | 1.257 | 3.401 |
| 2021 | 1.331 | 3.465 |
| 2022 | 980 | 3.203 |
| 2023 | 850 | 3.080 |
| 2024 | 825 | 3.105 |
Hoekwoning
Gas: 675 • Electricity: 2.690
Huurwoning
Gas: 712 • Electricity: 2.469
Koopwoning
Gas: 891 • Electricity: 3.338
Appartement
Gas: 330 • Electricity: 1.723
Tussenwoning
Gas: 564 • Electricity: 2.396
Vrijstaande woning
Gas: 1.272 • Electricity: 3.655
Twee-onder-één-kap woning
Gas: 954 • Electricity: 3.696
Total number of company establishments: 980
| Period | Crimes |
|---|---|
| jan 2025 | 10 |
| jan 2026 | 10 |
| jul 2025 | 14 |
| jun 2025 | 8 |
| mei 2025 | 14 |
| mrt 2025 | 12 |
| nov 2024 | 15 |
| nov 2025 | 9 |
| okt 2024 | 10 |
| okt 2025 | 22 |
| sep 2024 | 8 |
| sep 2025 | 19 |
These figures give an indicative picture of safety trends in the living environment of De Kwakel.
Short answers based on current local statistics, handy for a quick comparison of the living environment.
De Kwakel telt in 2025 ongeveer 5.081 inwoners.
De gemiddelde WOZ-waarde in De Kwakel is in 2025 circa € 480.668.
Het gemiddelde inkomen per inwoner in De Kwakel ligt rond € 29.583 per jaar.
Voor het huidige jaar gaat het om ongeveer 150 geregistreerde misdrijven. Gebruik deze cijfers als indicatie en vergelijk trends per periode.
In De Kwakel komt vooral "Tussenwoningen" veel voor, met ongeveer 690 woningen.