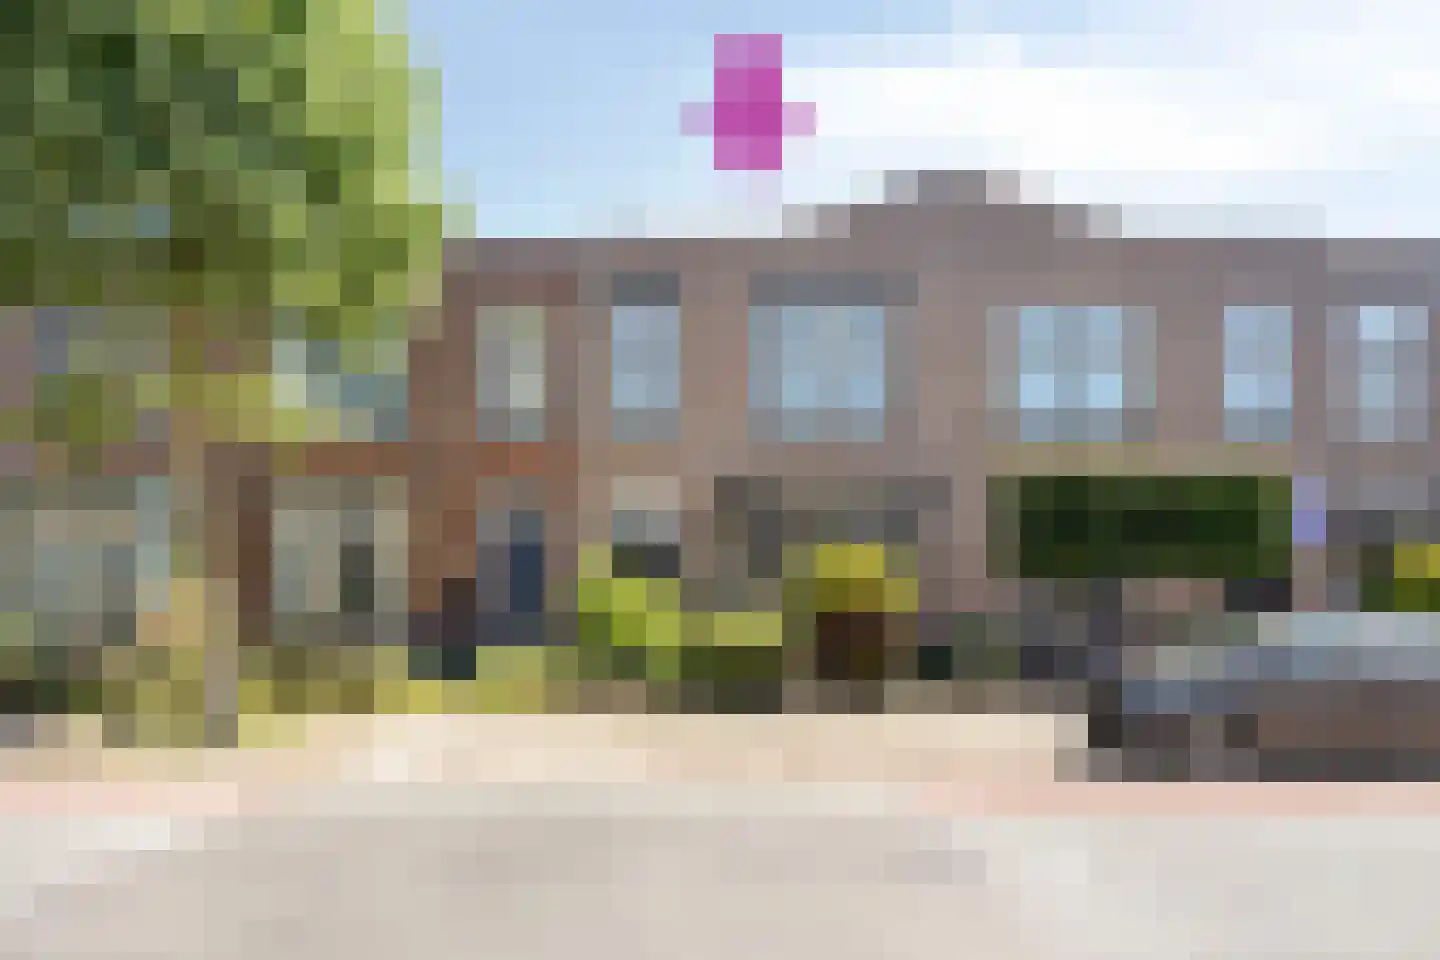
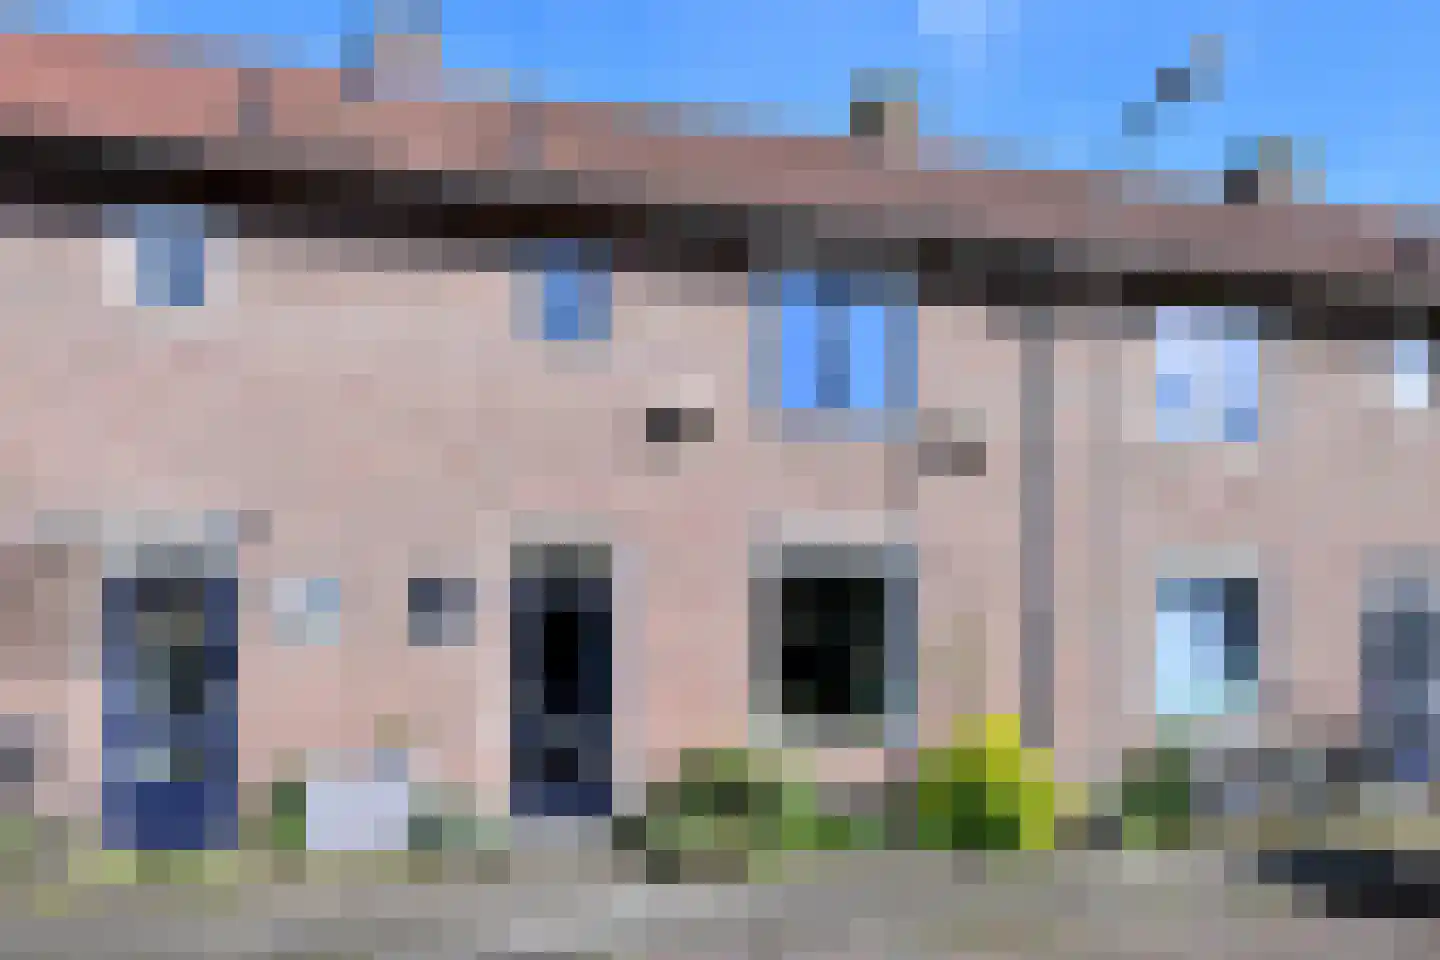
- Available
Anne Franklaan 76
7421HK Deventer
€ 725.000 k.k.
€ 4.647/m²
- Living area
- 156 m²
- Land area
- 659 m²
- Bedrooms
- 3
Searching in 1.208 houses in Deventer
Type to search. Use arrow down and arrow up to navigate through results and press Enter to open.
Hidden search suggestions.
View current properties in Deventer or search targeted on street, postal code and property characteristics.
View the current housing stock in Deventer and quickly filter by price, living area, rooms and more. There are currently 1.208 houses in this place within our selection. View also 948 sold houses in Deventer for extra insight into the local housing market.
7421HK Deventer
€ 725.000 k.k.
€ 4.647/m²
7425EC Deventer
€ 395.000 k.k.
€ 3.435/m²
7416BA Deventer
€ 425.000 k.k.
€ 4.381/m²
7425BA Deventer
€ 550.000 k.k.
€ 4.435/m²
7412TC Deventer
€ 325.000 k.k.
€ 3.421/m²
7415DL Deventer
€ 1.695.000 k.k.
€ 4.788/m²
7417TK Deventer
€ 235.000 k.k.
€ 3.615/m²
7412DJ Deventer
€ 484.500 k.k.
€ 4.659/m²
7412BL Deventer
€ 350.000 k.k.
€ 5.147/m²
7428MK Deventer
€ 1.350.000 k.k.
€ 2.239/m²
7411ZD Deventer
€ 950.000 k.k.
€ 6.419/m²
7425EA Deventer
€ 425.000 k.k.
€ 3.269/m²
7425HR Deventer
€ 599.000 k.k.
€ 3.544/m²
7415LX Deventer
€ 285.000 k.k.
€ 3.958/m²
7423ZG Deventer
€ 270.000 k.k.
€ 2.455/m²
7415LX Deventer
€ 285.000 k.k.
€ 3.904/m²
7411MB Deventer
€ 975.000 k.k.
€ 5.052/m²
7413ZS Deventer
€ 372.500 k.k.
€ 5.034/m²
7412XP Deventer
€ 450.000 k.k.
€ 4.839/m²
7419AB Deventer
€ 795.000 k.k.
€ 4.732/m²
7412TS Deventer
€ 365.000 k.k.
€ 3.650/m²
7412ES Deventer
€ 359.000 k.k.
€ 4.126/m²
7411RR Deventer
€ 1.118 p/m
€ 19/m²
7415AA Deventer
€ 635.000 k.k.
€ 4.847/m²
7414AS Deventer
€ 820.000 k.k.
€ 4.556/m²
7419CT Deventer
€ 499.000 k.k.
€ 3.898/m²
7413EC Deventer
€ 550.000 k.k.
€ 4.472/m²
7425DB Deventer
€ 475.000 k.k.
€ 3.831/m²
Get free quotes from real estate agents with local market knowledge. Compare more than 33 real estate agents in Deventer.
Selling a home in Deventer? View the sales-oriented guide sell a house in Deventer, compare all real estate agents in Deventer or view the top 10 real estate agents in Deventer for extra context to your choice.
Real estate agents make sharper offers when they know you're comparing — ask for quotes for sale or purchase.
Practical answers about housing supply, sales and comparing real estate agents in Deventer.
The costs of a real estate agent in Deventer depend on commission, setup costs, property presentation and the chosen service. Compare the 33 real estate agents in Deventer via the real estate agent page and request multiple quotes to compare rates and approach well.
Within our selection, we are currently showing 1.208 houses in Deventer. View also the sold houses in Deventer to compare the current offering with recent transactions.
Take into account not only price and living area but also maintenance, energy label, location, outdoor space and sales status. This way you compare houses in Deventer on more than just the asking price.
A local real estate agent knows the neighborhoods, recent transactions and demand in Deventer. By comparing 33 real estate agents in the region you get a better insight into prices, sales strategy and expected yield; the top 10 in Deventer provides a useful starting point.
Yes, when making a sales plan, a valuation in Deventer is wise. You gain insight into a realistic asking price and can then compare offers from real estate agents specifically.
View current location data on residents, WOZ development, housing stock, energy consumption, business activity and safety in Deventer. In 2026 were there 84.951 residents. The average WOZ value in 2025 is EUR 328.834.
These figures help to better assess and compare the housing stock in Deventer with recent sold homes. Orient yourself then on suitable top real estate agents in Deventer for sales advice in this region.
Residents
84.951
Last year: 2026
Average WOZ
EUR 328.834
Last year: 2025
Average income per person.
EUR 9.769
Source: AllNumbers
Crimes (current year)
4.285
Total registered
| Year | Residents |
|---|---|
| 2021 | 81.495 |
| 2022 | 81.680 |
| 2023 | 82.875 |
| 2024 | 83.485 |
| 2025 | 84.110 |
| 2026 | 84.951 |
| Year | Average WOZ |
|---|---|
| 2021 | EUR 219.534 |
| 2022 | EUR 247.630 |
| 2023 | EUR 296.376 |
| 2024 | EUR 314.388 |
| 2025 | EUR 328.834 |
Hoger
20.240
Praktisch
16.270
Middelbaar
25.760
Europa
6.680
Nederland
60.485
Buiten Europa
16.955
Label A
12.003
Label C
8.361
Label B
6.837
Label E
3.123
Label F
2.968
Label G
2.764
Label D
2.668
Label A+++
1.223
Label A+
1.070
Label A++
516
Label A++++
242
Label A+++++
20
| Year | Gas (m3) | Electricity (kWh) |
|---|---|---|
| 2020 | 977 | 2.492 |
| 2021 | 1.110 | 2.536 |
| 2022 | 868 | 2.389 |
| 2023 | 741 | 2.271 |
| 2024 | 717 | 2.315 |
Hoekwoning
Gas: 931 • Electricity: 2.504
Huurwoning
Gas: 652 • Electricity: 1.933
Koopwoning
Gas: 819 • Electricity: 2.572
Appartement
Gas: 530 • Electricity: 1.698
Tussenwoning
Gas: 805 • Electricity: 2.400
Vrijstaande woning
Gas: 980 • Electricity: 2.495
Twee-onder-één-kap woning
Gas: 977 • Electricity: 2.661
Total number of company establishments: 10.445
| Period | Crimes |
|---|---|
| jan 2026 | 515 |
| jul 2025 | 378 |
| jun 2025 | 358 |
| mei 2025 | 328 |
| mrt 2025 | 331 |
| mrt 2026 | 432 |
| nov 2024 | 365 |
| nov 2025 | 398 |
| okt 2024 | 400 |
| okt 2025 | 433 |
| sep 2024 | 428 |
| sep 2025 | 340 |
These figures give an indicative picture of safety trends in the living environment of Deventer.
Short answers based on current local statistics, handy for a quick comparison of the living environment.
Deventer telt in 2026 ongeveer 84.951 inwoners.
De gemiddelde WOZ-waarde in Deventer is in 2025 circa € 328.834.
Het gemiddelde inkomen per inwoner in Deventer ligt rond € 9.769 per jaar.
Voor het huidige jaar gaat het om ongeveer 4.285 geregistreerde misdrijven. Gebruik deze cijfers als indicatie en vergelijk trends per periode.
In Deventer komt vooral "Tussenwoningen" veel voor, met ongeveer 15.616 woningen.