- Sold subject to confirmation
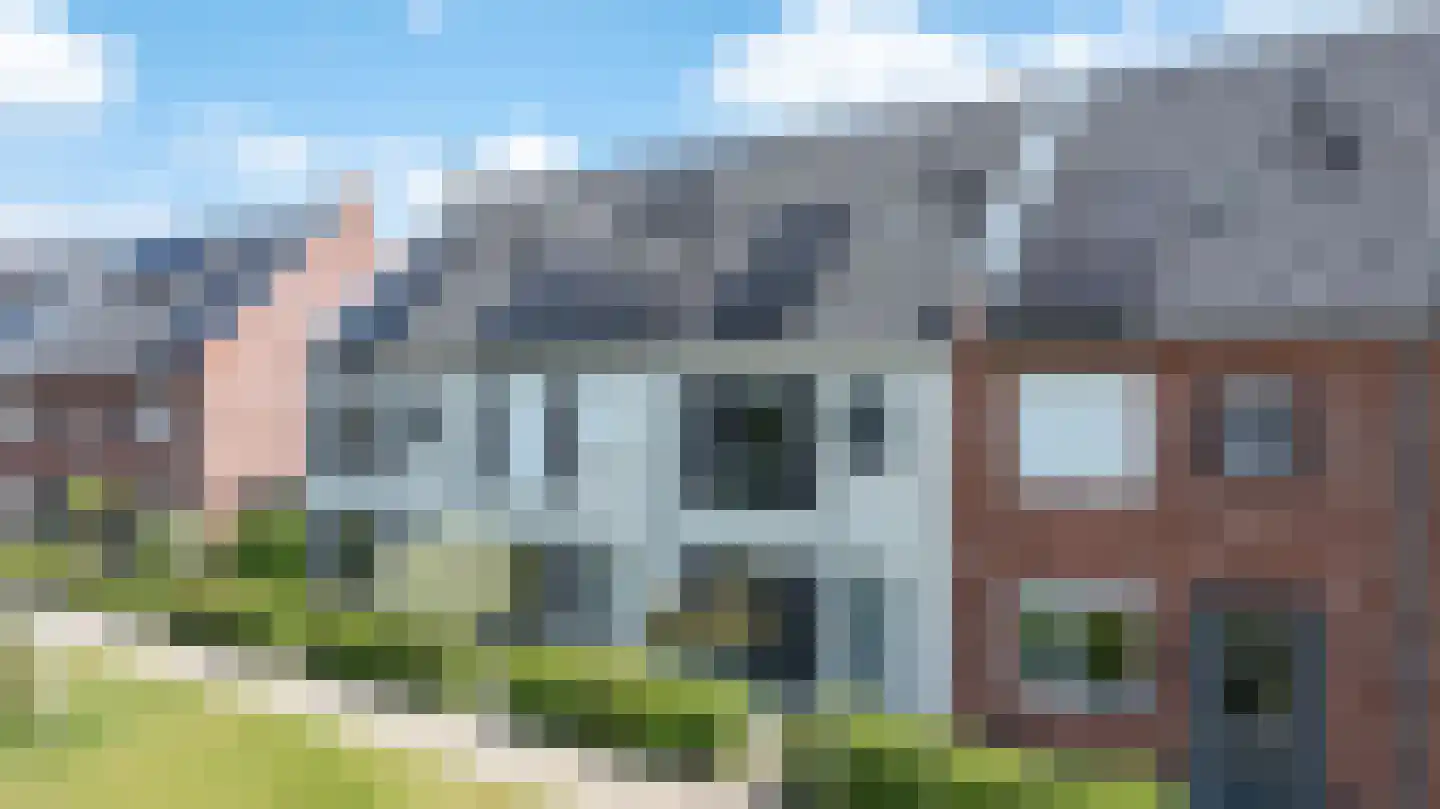
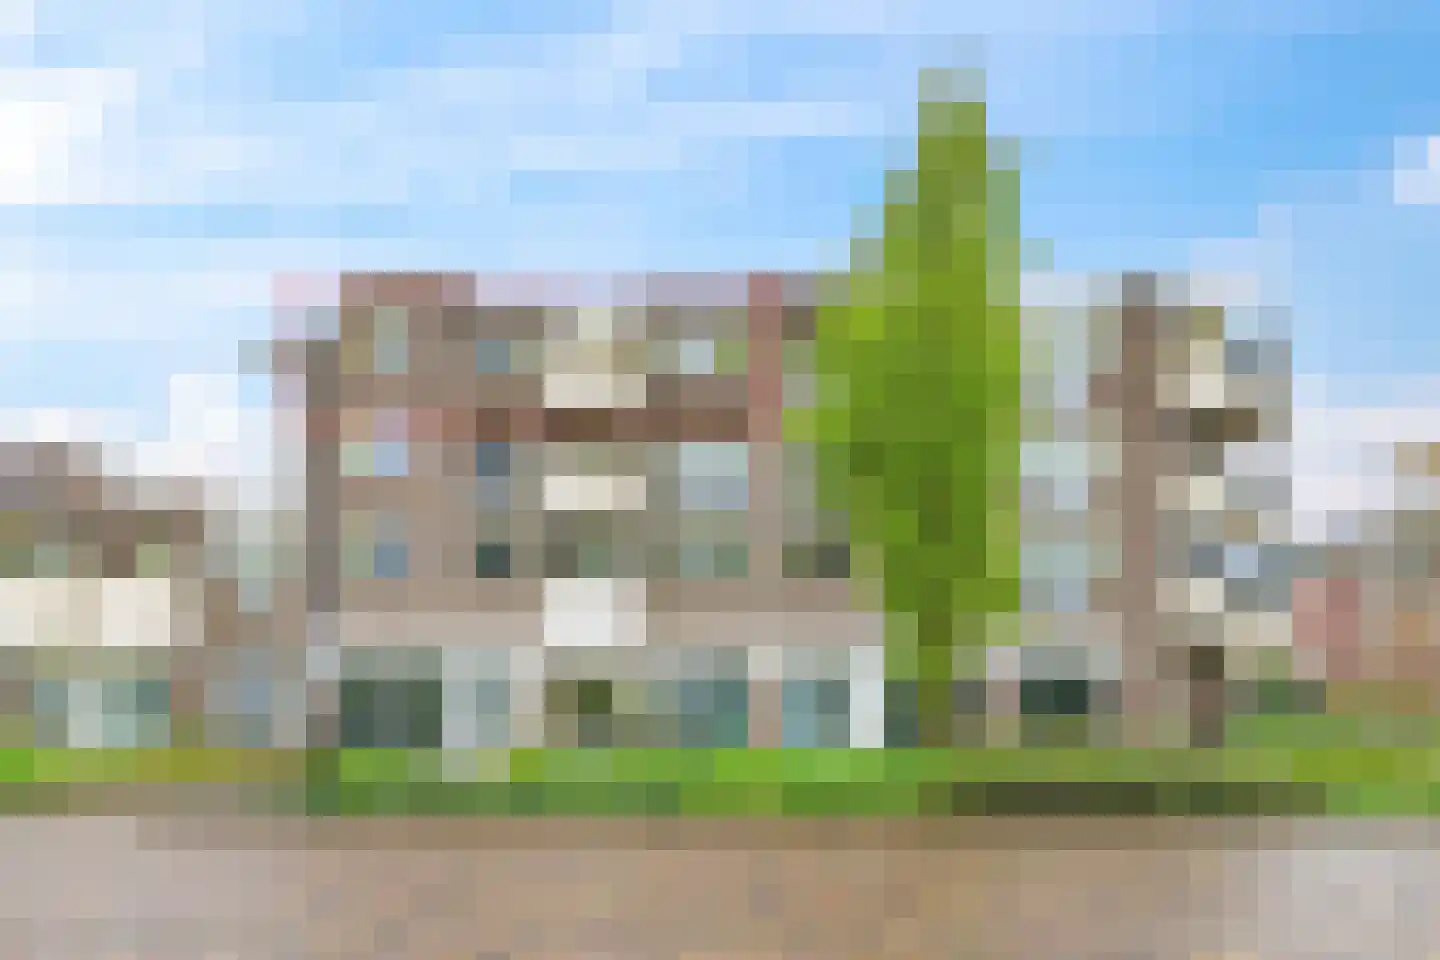
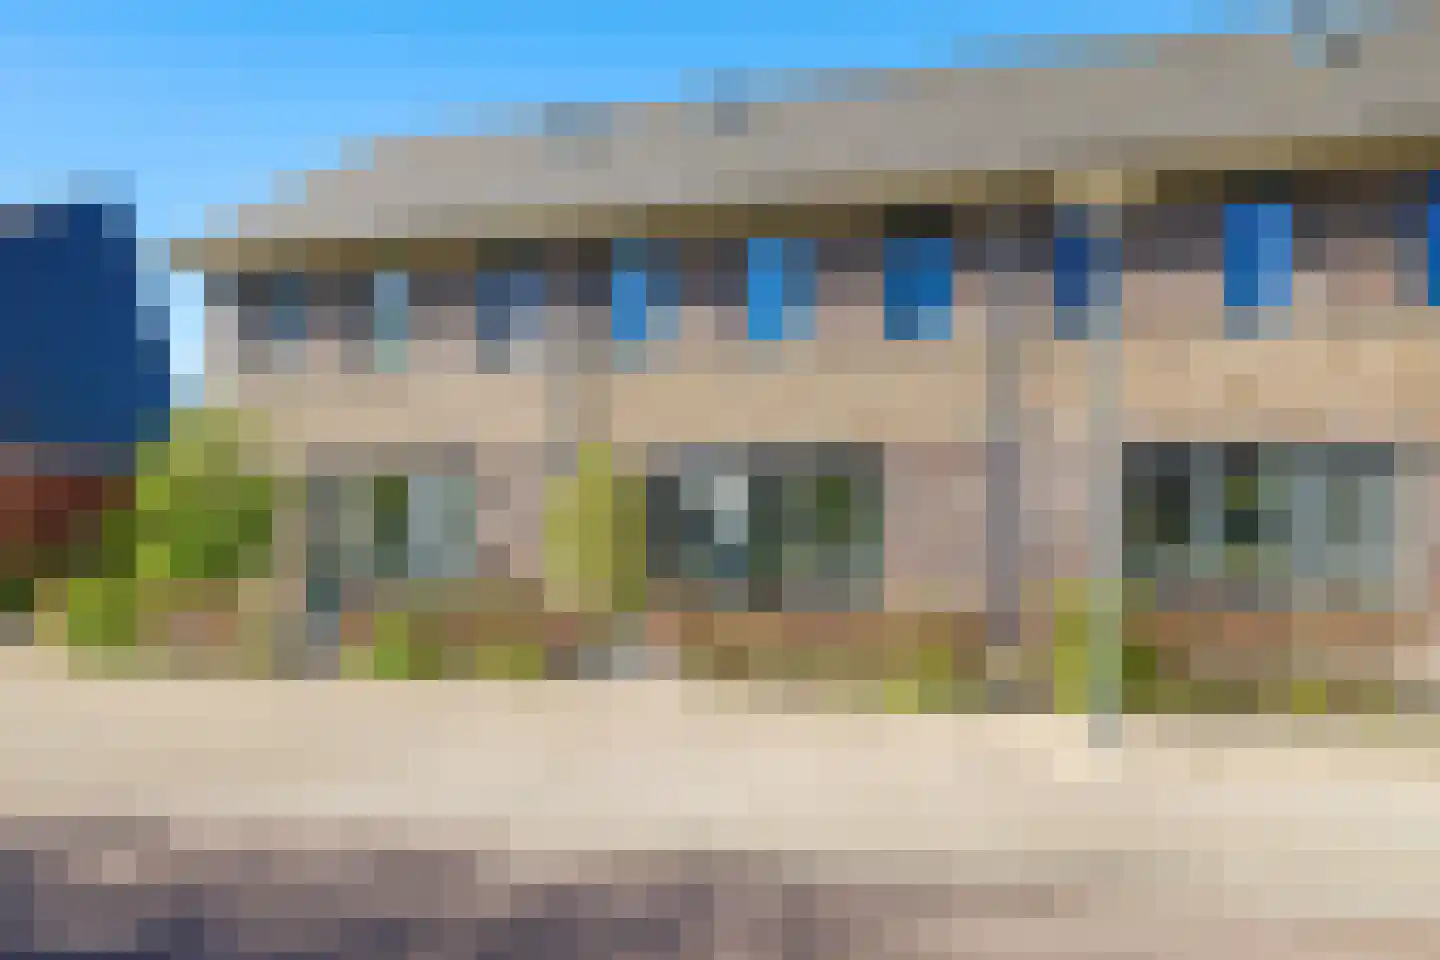
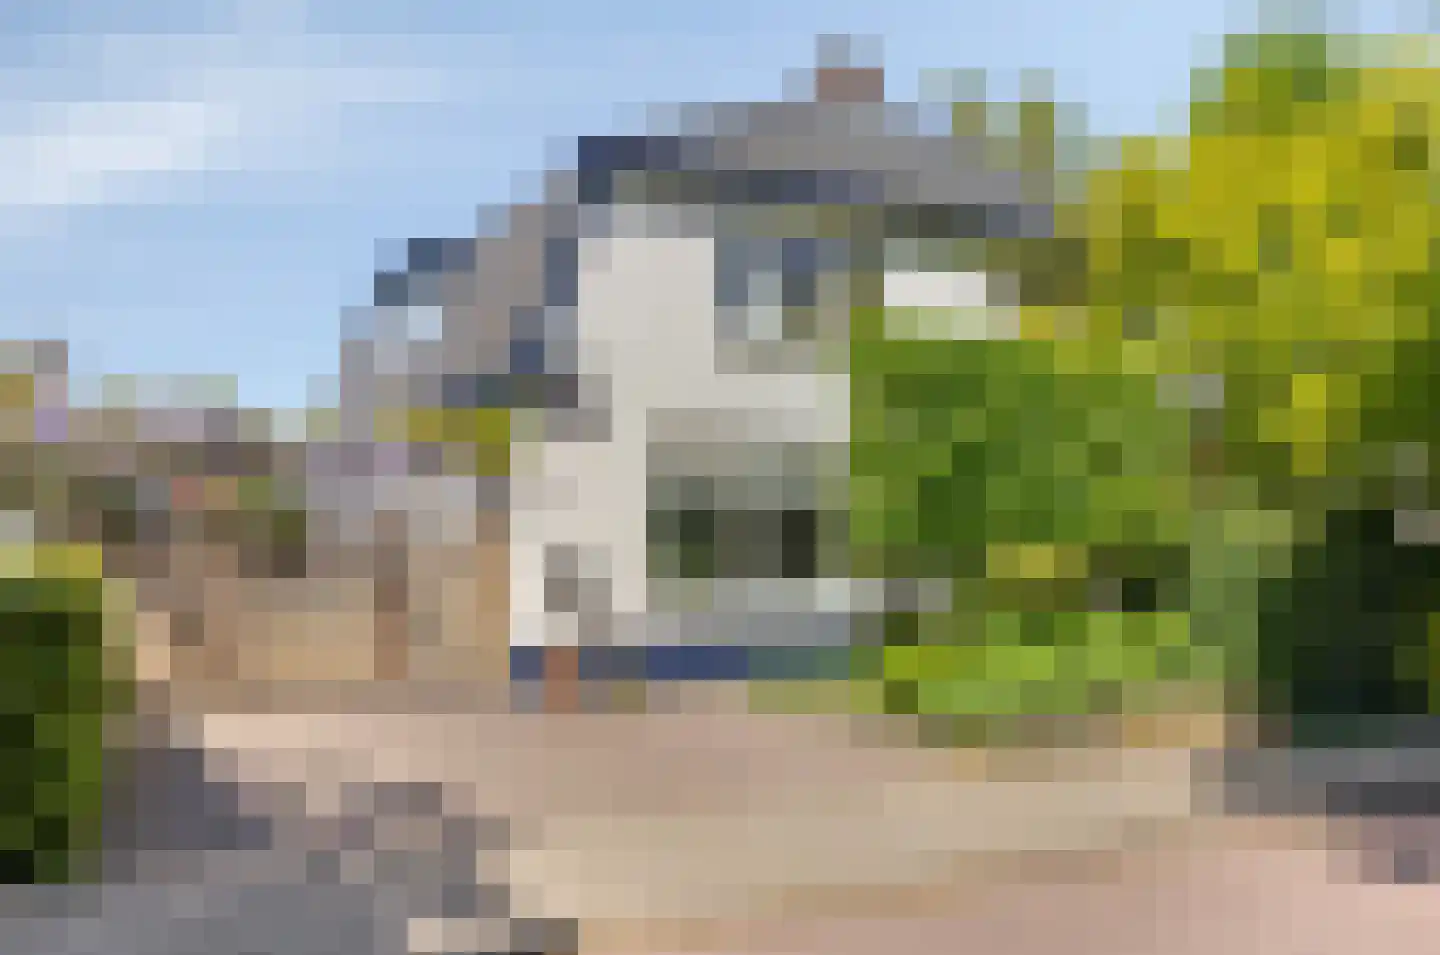
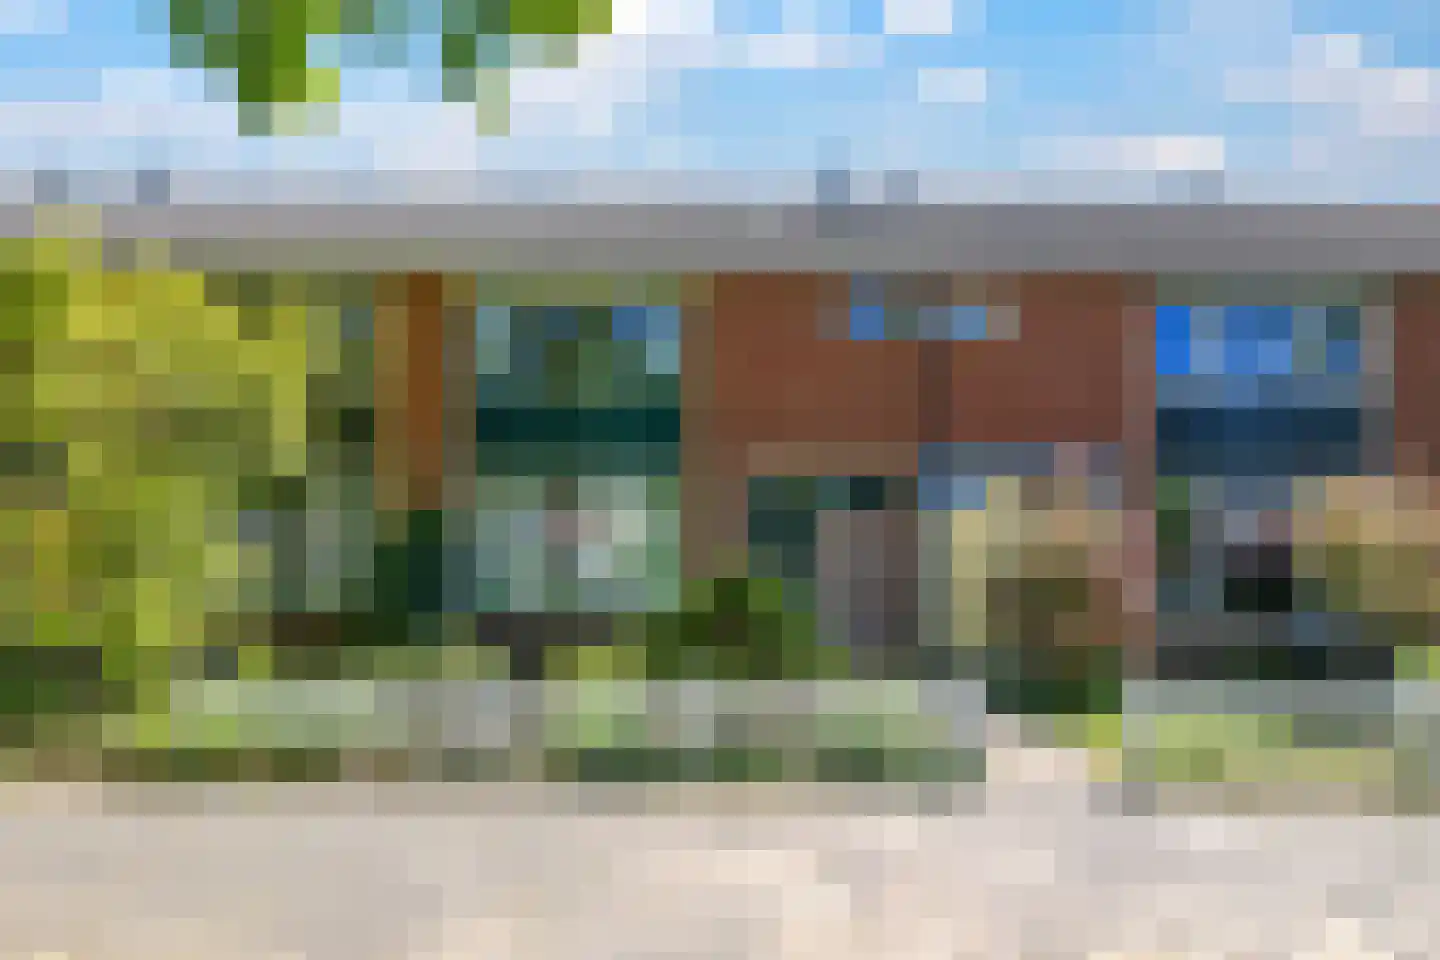
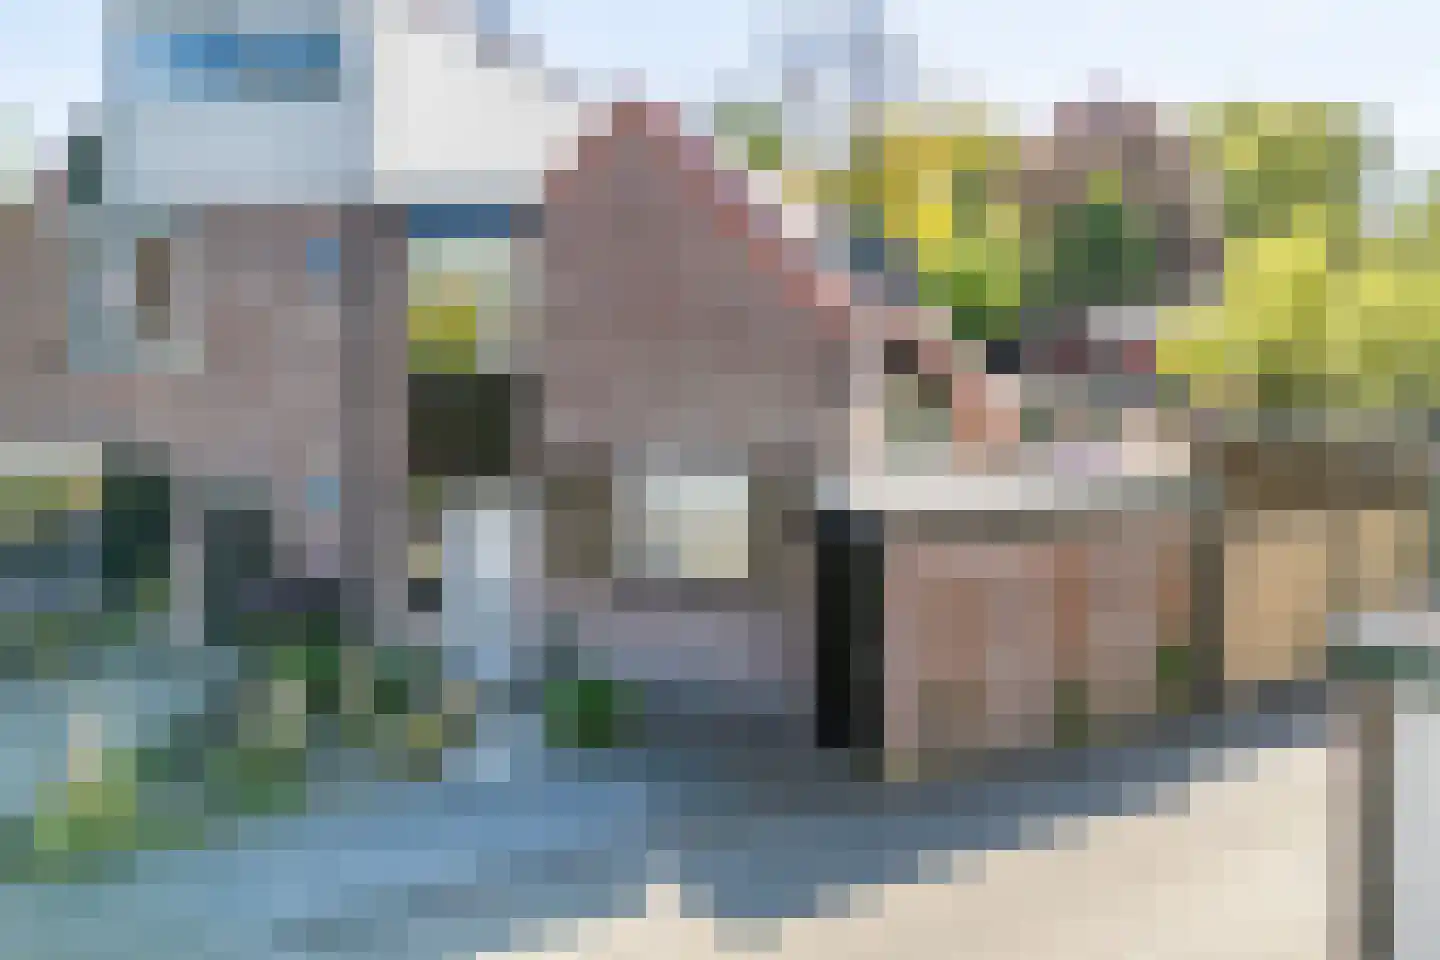
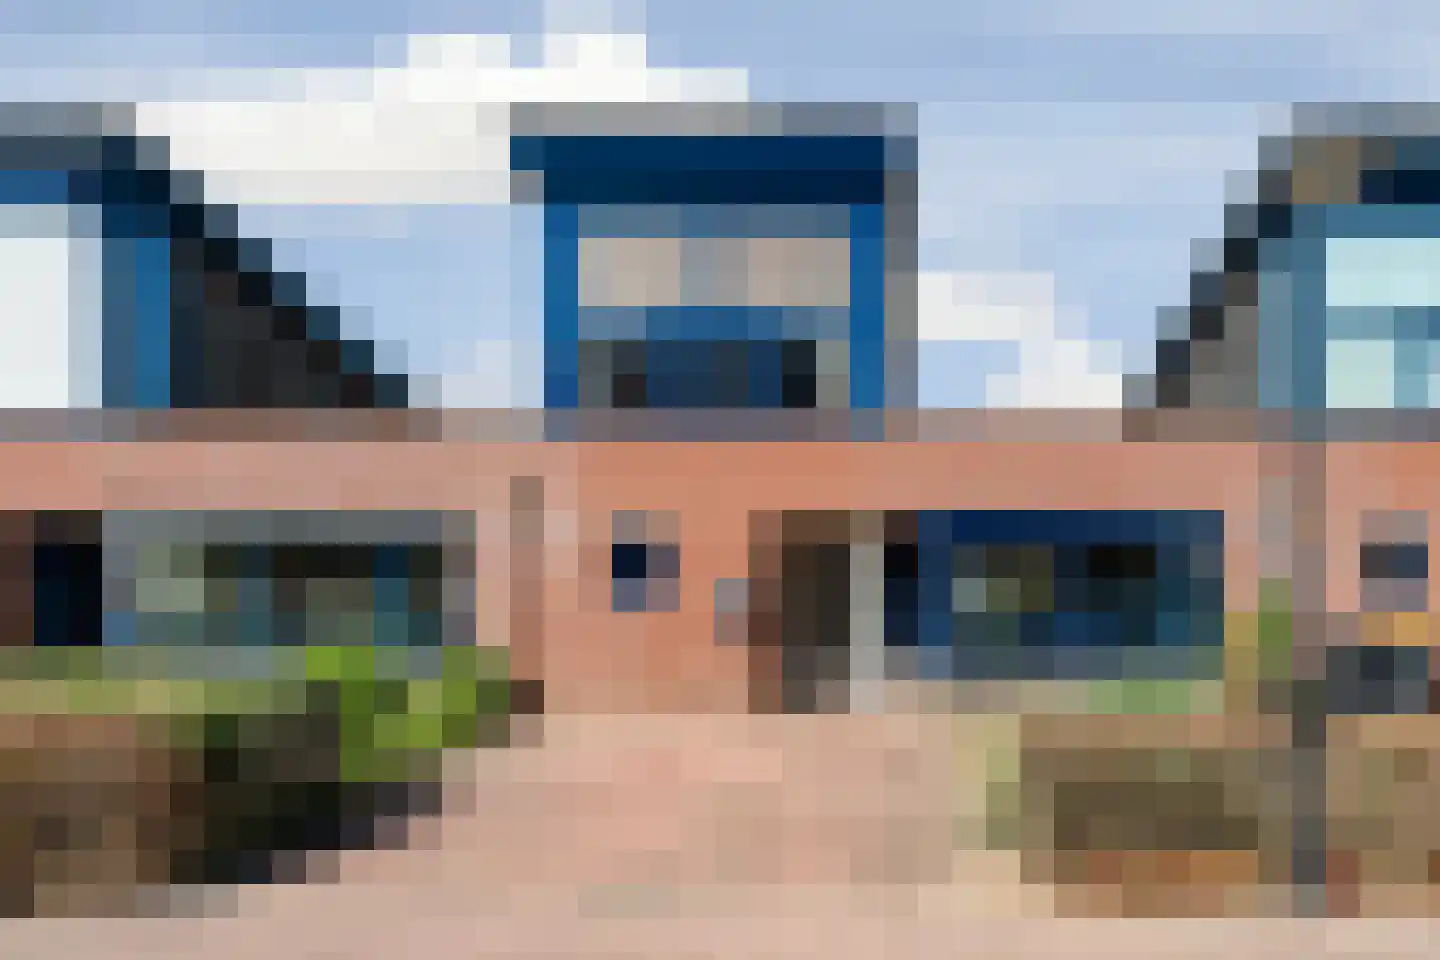
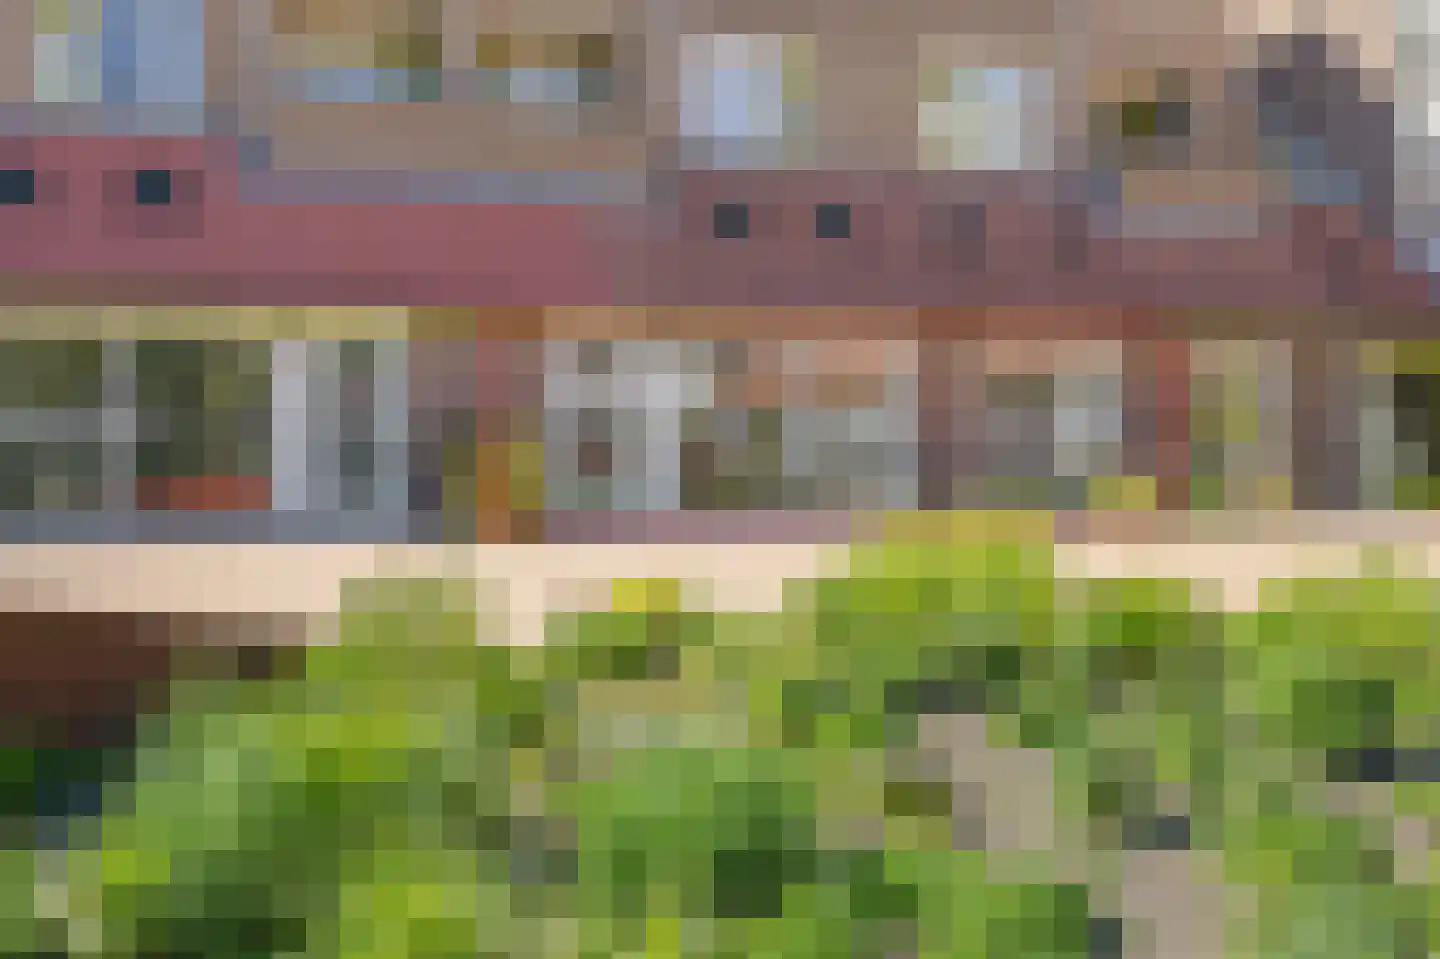
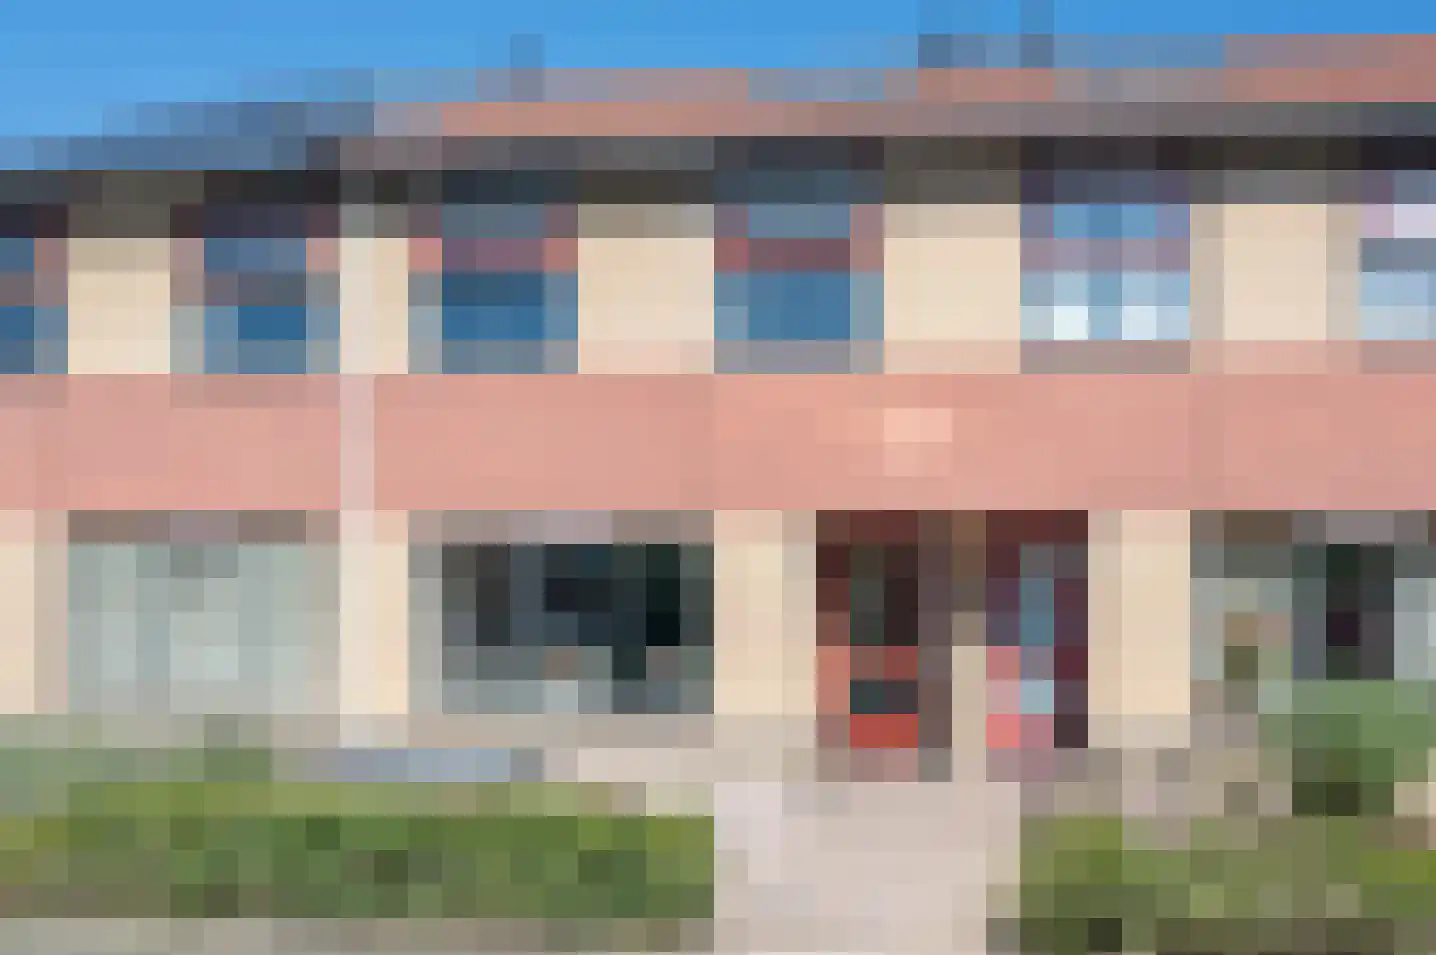
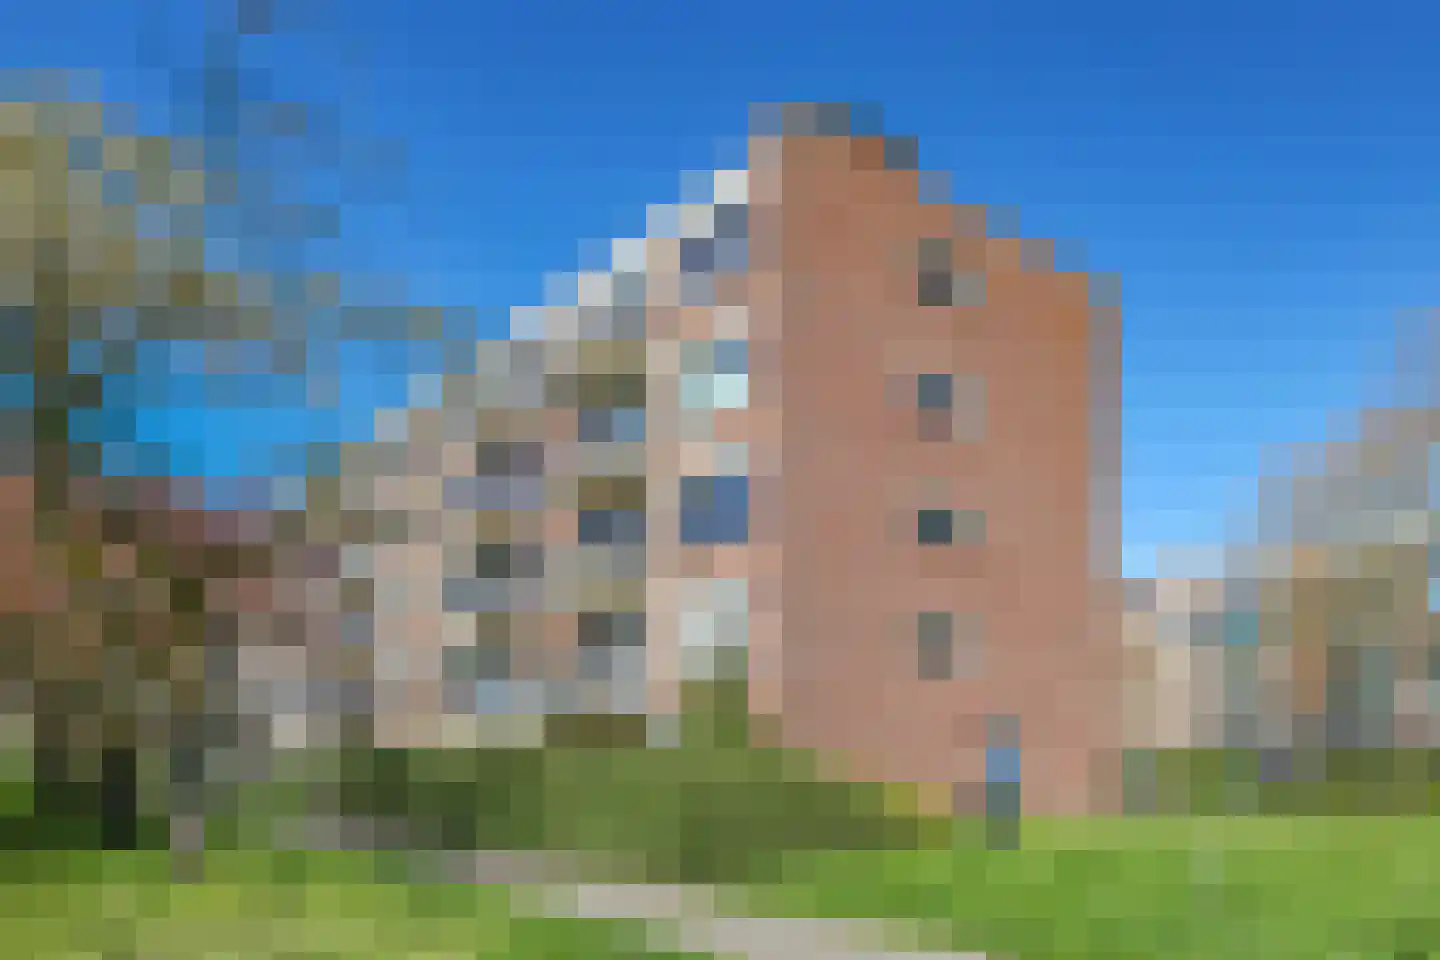
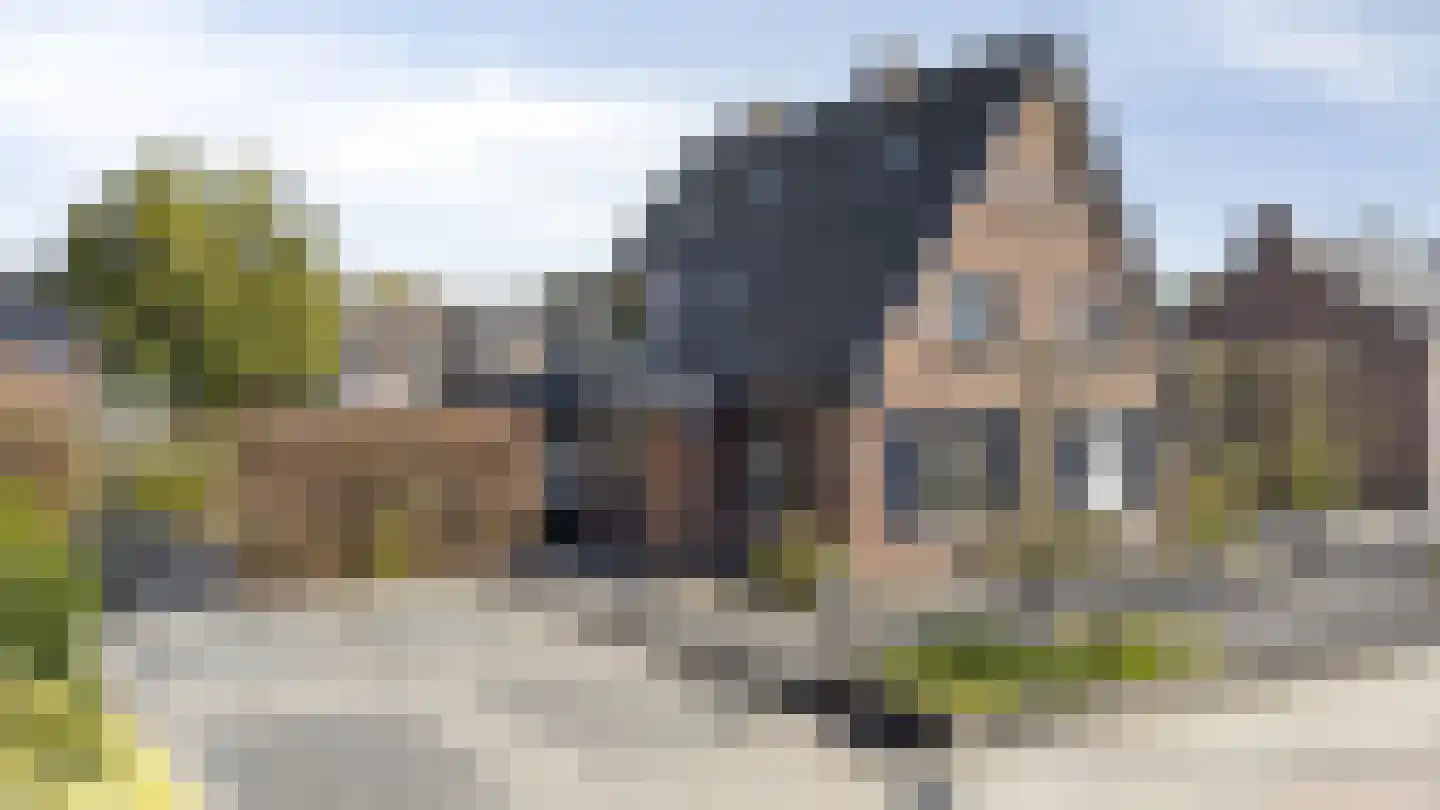
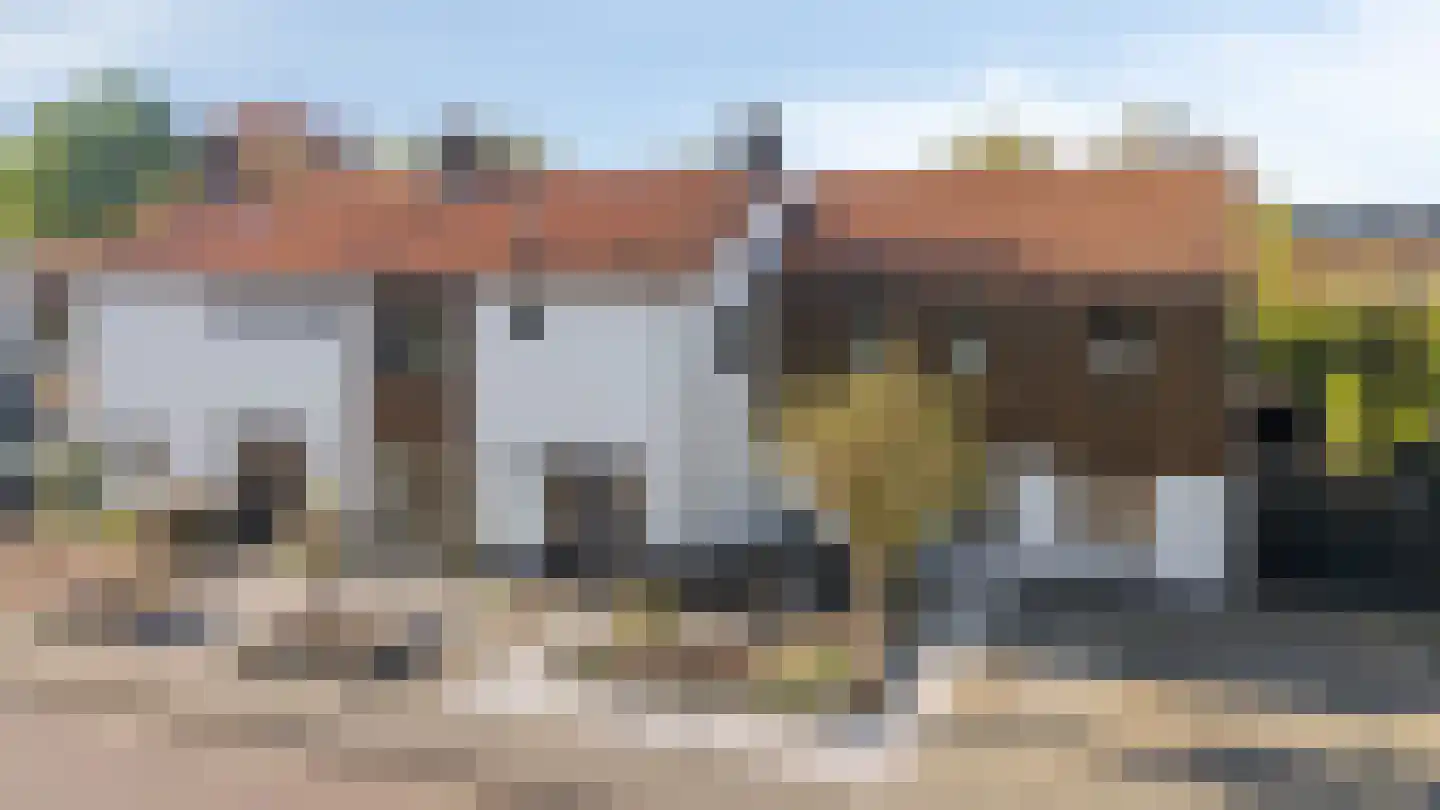
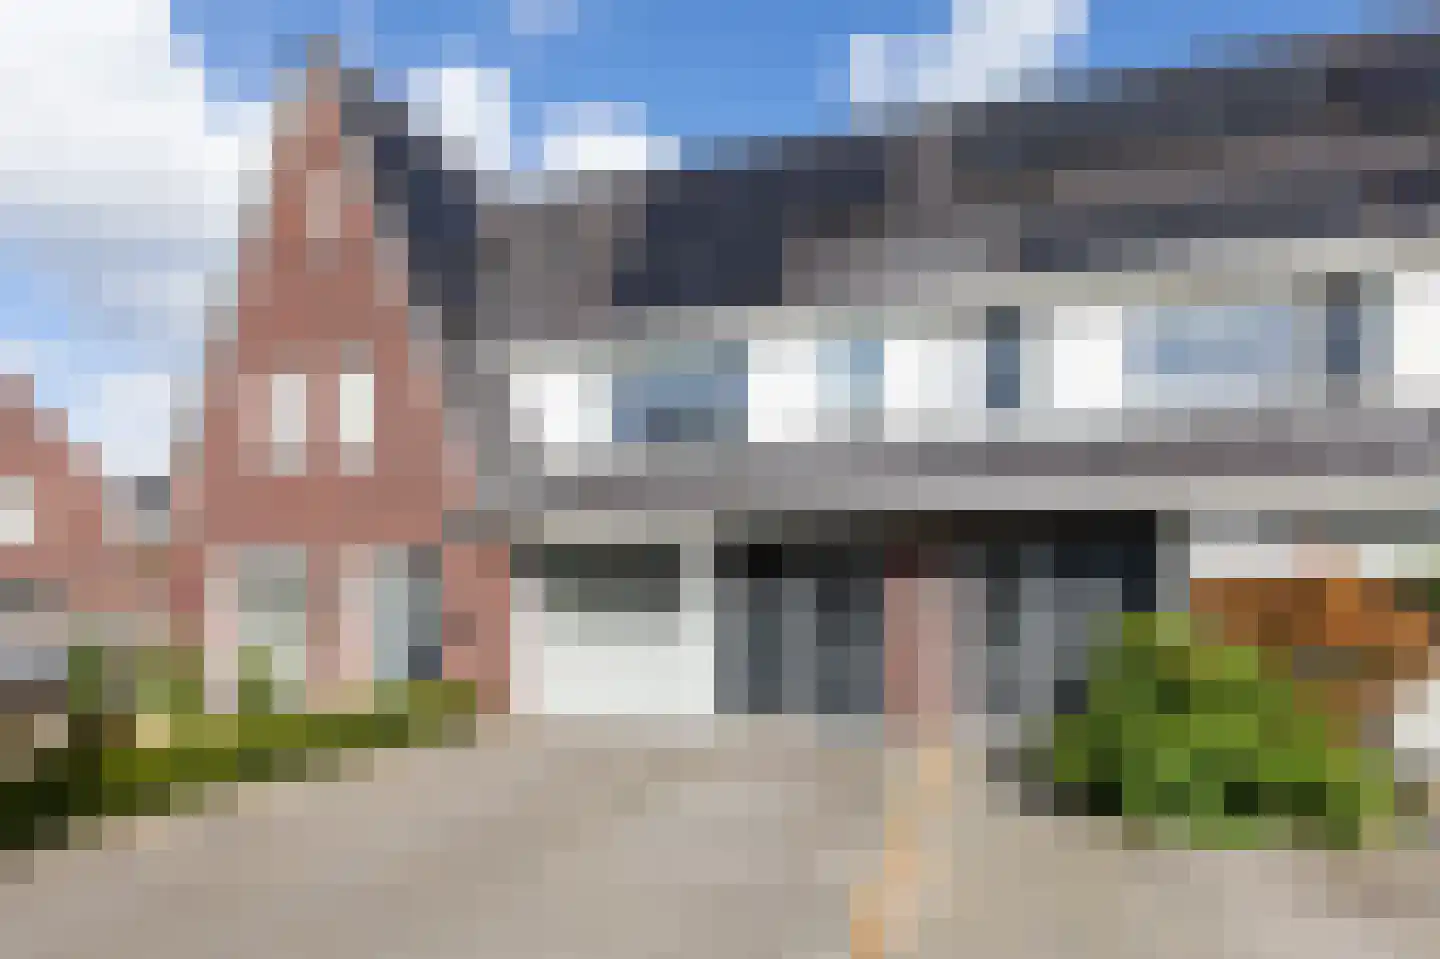
Begoniastraat 15
7004CK Doetinchem
€ 375.000 k.k.
€ 3.606/m²
- Living area
- 104 m²
- Land area
- 160 m²
- Bedrooms
- 4
Searching in 561 houses in Doetinchem
Type to search. Use arrow down and arrow up to navigate through results and press Enter to open.
Hidden search suggestions.
View current properties in Doetinchem or search targeted on street, postal code and property characteristics.
View the current housing stock in Doetinchem and quickly filter by price, living area, rooms and more. There are currently 561 houses in this place within our selection. View also 469 sold houses in Doetinchem for extra insight into the local housing market.
7004CK Doetinchem
€ 375.000 k.k.
€ 3.606/m²
7007DE Doetinchem
€ 435.000 k.k.
€ 3.452/m²
7002BX Doetinchem
€ 309.000 k.k.
€ 3.862/m²
7006TJ Doetinchem
€ 439.000 k.k.
€ 3.689/m²
7001DJ Doetinchem
€ 319.000 k.k.
€ 2.774/m²
7004LC Doetinchem
€ 439.500 k.k.
€ 3.602/m²
7006JJ Doetinchem
€ 389.000 k.k.
€ 3.442/m²
7007HL Doetinchem
€ 519.000 k.k.
€ 3.788/m²
7001GT Doetinchem
€ 565.000 k.k.
€ 3.924/m²
7009HH Doetinchem
€ 315.000 k.k.
€ 2.188/m²
7004DL Doetinchem
€ 335.000 k.k.
€ 3.526/m²
7009MA Doetinchem
€ 385.000 k.k.
€ 3.702/m²
7008CB Doetinchem
€ 289.000 k.k.
€ 5.780/m²
7007KS Doetinchem
€ 365.000 k.k.
7001DL Doetinchem
€ 275.000 k.k.
7001DJ Doetinchem
€ 215.000 k.k.
7002LB Doetinchem
€ 430.000 k.k.
7009CP Doetinchem
€ 319.000 k.k.
7007GR Doetinchem
€ 449.000 k.k.
7007HR Doetinchem
€ 359.000 k.k.
7002AE Doetinchem
€ 219.000 k.k.
€ 3.174/m²
7001CC Doetinchem
€ 695.000 k.k.
€ 2.957/m²
7009KH Doetinchem
€ 289.500 k.k.
€ 2.262/m²
7002KC Doetinchem
€ 235.000 k.k.
€ 2.474/m²
7006HT Doetinchem
€ 350.000 k.k.
€ 3.070/m²
7002LL Doetinchem
€ 559.000 k.k.
€ 4.051/m²
7001BN Doetinchem
€ 219.000 k.k.
€ 3.476/m²
7002AG Doetinchem
€ 695.000 k.k.
€ 2.758/m²
Get free quotes from real estate agents with local market knowledge. Compare more than 29 real estate agents in Doetinchem.
Selling a home in Doetinchem? View the sales-oriented guide sell a house in Doetinchem, compare all real estate agents in Doetinchem or view the top 10 real estate agents in Doetinchem for extra context to your choice.
Real estate agents make sharper offers when they know you're comparing — ask for quotes for sale or purchase.
Practical answers about housing supply, sales and comparing real estate agents in Doetinchem.
The costs of a real estate agent in Doetinchem depend on commission, setup costs, property presentation and the chosen service. Compare the 29 real estate agents in Doetinchem via the real estate agent page and request multiple quotes to compare rates and approach well.
Within our selection, we are currently showing 561 houses in Doetinchem. View also the sold houses in Doetinchem to compare the current offering with recent transactions.
Take into account not only price and living area but also maintenance, energy label, location, outdoor space and sales status. This way you compare houses in Doetinchem on more than just the asking price.
A local real estate agent knows the neighborhoods, recent transactions and demand in Doetinchem. By comparing 29 real estate agents in the region you get a better insight into prices, sales strategy and expected yield; the top 10 in Doetinchem provides a useful starting point.
Yes, when making a sales plan, a valuation in Doetinchem is wise. You gain insight into a realistic asking price and can then compare offers from real estate agents specifically.
View current location data on residents, WOZ development, housing stock, energy consumption, business activity and safety in Doetinchem. In 2026 were there 47.637 residents. The average WOZ value in 2025 is EUR 324.806.
These figures help to better assess and compare the housing stock in Doetinchem with recent sold homes. Orient yourself then on suitable top real estate agents in Doetinchem for sales advice in this region.
Residents
47.637
Last year: 2026
Average WOZ
EUR 324.806
Last year: 2025
Average income per person.
EUR 31.002
Source: AllNumbers
Crimes (current year)
2.117
Total registered
| Year | Residents |
|---|---|
| 2021 | 45.655 |
| 2022 | 45.910 |
| 2023 | 46.410 |
| 2024 | 46.805 |
| 2025 | 47.235 |
| 2026 | 47.637 |
| Year | Average WOZ |
|---|---|
| 2021 | EUR 230.116 |
| 2022 | EUR 253.485 |
| 2023 | EUR 297.626 |
| 2024 | EUR 307.313 |
| 2025 | EUR 324.806 |
Hoger
11.140
Praktisch
8.850
Middelbaar
15.290
Europa
3.165
Nederland
38.040
Buiten Europa
6.035
Label A
6.417
Label C
6.171
Label B
4.104
Label D
1.430
Label G
1.377
Label E
1.070
Label F
807
Label A+++
640
Label A+
569
Label A++++
299
Label A++
264
Label A+++++
8
| Year | Gas (m3) | Electricity (kWh) |
|---|---|---|
| 2020 | 1.138 | 2.746 |
| 2021 | 1.285 | 2.771 |
| 2022 | 1.027 | 2.599 |
| 2023 | 848 | 2.490 |
| 2024 | 825 | 2.567 |
Hoekwoning
Gas: 892 • Electricity: 2.568
Huurwoning
Gas: 705 • Electricity: 1.943
Koopwoning
Gas: 965 • Electricity: 2.913
Appartement
Gas: 607 • Electricity: 1.770
Tussenwoning
Gas: 774 • Electricity: 2.345
Vrijstaande woning
Gas: 1.389 • Electricity: 3.881
Twee-onder-één-kap woning
Gas: 1.067 • Electricity: 2.977
Total number of company establishments: 6.405
| Period | Crimes |
|---|---|
| jan 2026 | 177 |
| jul 2025 | 187 |
| jun 2025 | 179 |
| mei 2025 | 188 |
| mrt 2025 | 162 |
| mrt 2026 | 192 |
| nov 2024 | 168 |
| nov 2025 | 194 |
| okt 2024 | 204 |
| okt 2025 | 201 |
| sep 2024 | 182 |
| sep 2025 | 217 |
These figures give an indicative picture of safety trends in the living environment of Doetinchem.
Short answers based on current local statistics, handy for a quick comparison of the living environment.
Doetinchem telt in 2026 ongeveer 47.637 inwoners.
De gemiddelde WOZ-waarde in Doetinchem is in 2025 circa € 324.806.
Het gemiddelde inkomen per inwoner in Doetinchem ligt rond € 31.002 per jaar.
Voor het huidige jaar gaat het om ongeveer 2.117 geregistreerde misdrijven. Gebruik deze cijfers als indicatie en vergelijk trends per periode.
In Doetinchem komt vooral "Tussenwoningen" veel voor, met ongeveer 7.287 woningen.