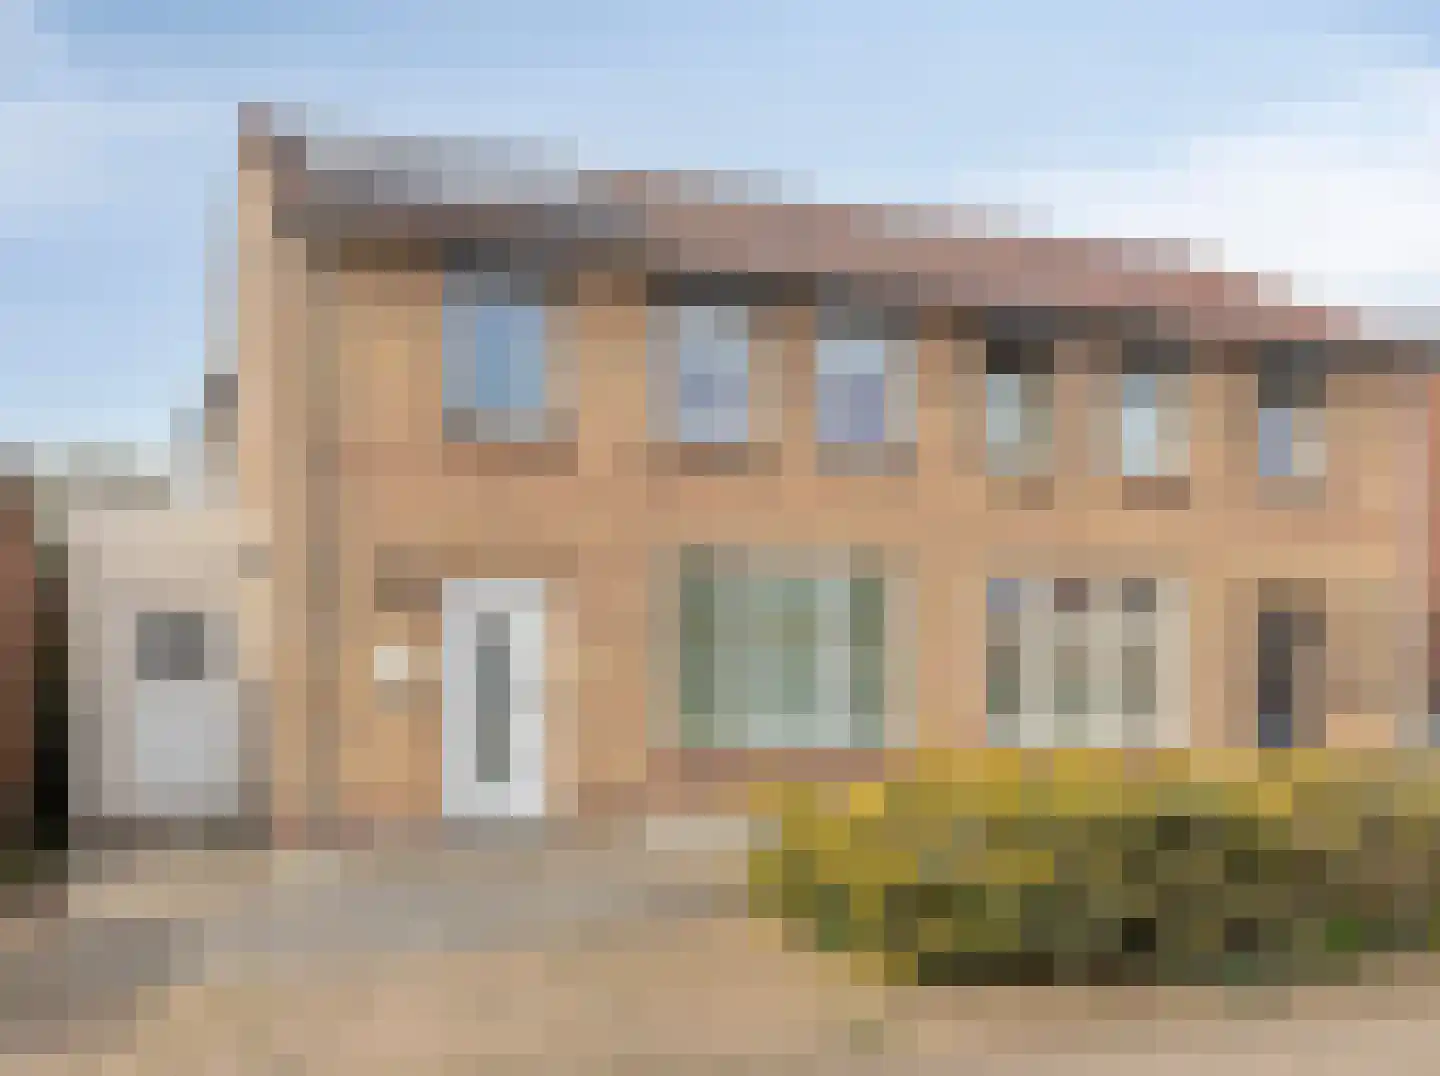
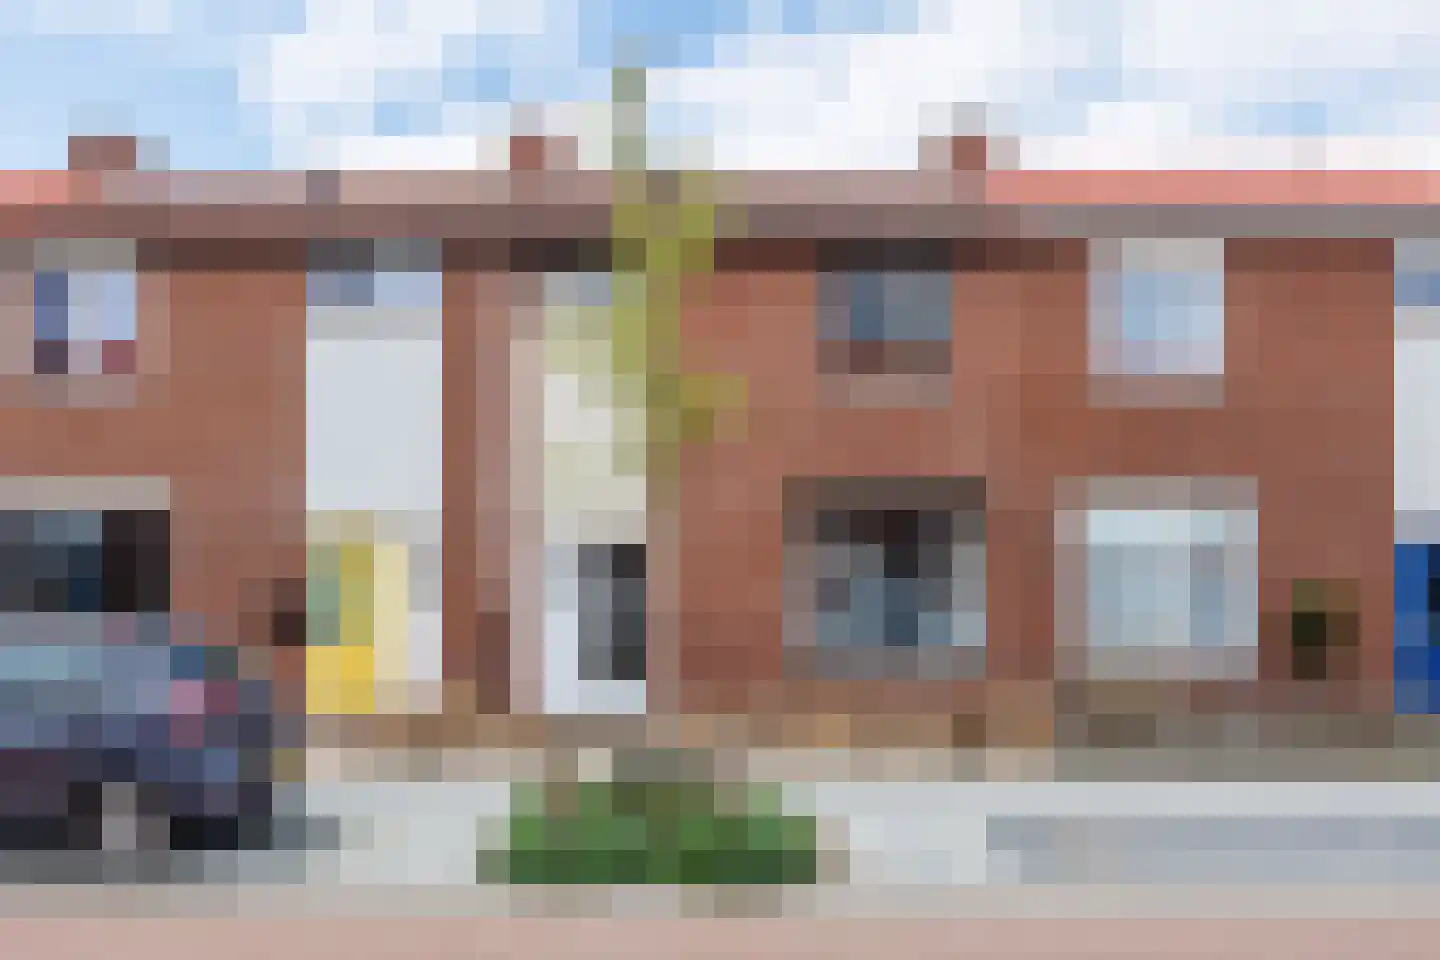
Housing offer in Gennep

Searching in 94 houses in Gennep

Connected to: Vastgoed Nederland NVM Makelaars

View the current housing stock in Gennep and quickly filter by price, living area, rooms and more. There are currently 94 houses in this place within our selection. View also 67 sold houses in Gennep for extra insight into the local housing market.

Selection

Search and filter homes

Set your preferences and discover homes that suit you.

Total supply 243.149
Filters

Set price, area and other characteristics. Adjust a filter or click on Show homes. Location changes directly above.

Reset filters

You search for

  • Place Gennep

Selling a home in Gennep? Compare realtor offers

Get free quotes from real estate agents with local market knowledge. Compare more than 18 real estate agents in Gennep.

Free request a quote

  • Quotes in Gennep
  • Non-binding
  • Personal
  • Compare free rates

Selling a home in Gennep? View the sales-oriented guide sell a house in Gennep, compare all real estate agents in Gennep or view the top 10 real estate agents in Gennep for extra context to your choice.

Compare multiple quotes

Real estate agents make sharper offers when they know you're comparing — ask for quotes for sale or purchase.

Frequently asked questions about homes in Gennep

Practical answers about housing supply, sales and comparing real estate agents in Gennep.

Residential and neighborhood statistics in Gennep

View current location data on residents, WOZ development, housing stock, energy consumption, business activity and safety in Gennep. In 2026 were there 9.506 residents. The average WOZ value in 2025 is EUR 347.000.

These figures help to better assess and compare the housing stock in Gennep with recent sold homes. Orient yourself then on suitable top real estate agents in Gennep for sales advice in this region.

Residents

9.506

Last year: 2026

Average WOZ

EUR 347.000

Last year: 2025

Average income per person.

EUR 31.500

Source: AllNumbers

Crimes (current year)

335

Total registered

Demographics and WOZ development

Inhabitants per year

Inhabitants per year in Gennep
Year Residents
2021 9.285
2022 9.400
2023 9.520
2024 9.565
2025 9.495
2026 9.506

Annual WOZ value

WOZ value per year in Gennep
Year Average WOZ
2021 EUR 244.000
2022 EUR 259.000
2023 EUR 312.000
2024 EUR 316.000
2025 EUR 347.000

Composition of residents

Age build-up

65+: 2.685 0-15: 1.235 15-25: 1.020 25-45: 2.005 45-65: 2.555

Education level

Hoger

1.700

Praktisch

1.890

Middelbaar

3.420

Origin of residents (2025)

Europa

765

Nederland

7.725

Buiten Europa

1.005

Housing stock and construction periods

Types of homes

Hoekwoningen 726
Appartementen 988
Tussenwoningen 1.427
Vrijstaande woningen 596
Twee-onder-één-kap woningen 734

Construction period of buildings

Voor 1700 5
1700 tot 1900 73
1900 tot 1925 228
1925 tot 1950 344
1950 tot 1970 1.081
1970 tot 1980 607
1980 tot 1990 725
1990 tot 2000 163
2000 tot 2010 424
2010 tot 2020 167
2020 en later 137

Energy and sustainability

Energy label distribution

Label A

1.280

Label C

1.206

Label B

496

Label D

406

Label F

306

Label G

255

Label E

166

Label A+

94

Label A++

92

Label A+++

43

Label A++++

4

Label A+++++

2

Average energy consumption per year

Average energy consumption per year in Gennep
Year Gas (m3) Electricity (kWh)
2020 1.230 2.970
2021 1.340 2.970
2022 1.020 2.780
2023 850 2.640
2024 820 2.720

Consumption per house type

Hoekwoning

Gas: 940 • Electricity: 2.620

Huurwoning

Gas: 690 • Electricity: 2.160

Koopwoning

Gas: 960 • Electricity: 2.980

Appartement

Gas: 490 • Electricity: 1.970

Tussenwoning

Gas: 800 • Electricity: 2.400

Vrijstaande woning

Gas: 1.270 • Electricity: 3.890

Twee-onder-één-kap woning

Gas: 890 • Electricity: 2.850

Business activity in Gennep (2025)

Handel en HORECA 200
Nijverheid en energie 150
Zakelijke dienstverlening 180
Overheid, onderwijs en zorg 195
Landbouw, bosbouw en visserij 10
Vervoer, informatie en communicatie 35
Financiele diensten en onroerendgoed 40
Cultuur, recreatie en overige diensten 110

Total number of company establishments: 915

Recent crime statistics

Recent crime statistics in Gennep
Period Crimes
jan 2026 17
jul 2025 24
jun 2025 24
mei 2025 35
mrt 2025 39
mrt 2026 28
nov 2024 28
nov 2025 24
okt 2024 38
okt 2025 45
sep 2024 29
sep 2025 18

These figures give an indicative picture of safety trends in the living environment of Gennep.

Frequently asked questions about living in Gennep

Short answers based on current local statistics, handy for a quick comparison of the living environment.

Hoeveel inwoners heeft Gennep?

Gennep telt in 2026 ongeveer 9.506 inwoners.

Wat is de gemiddelde WOZ-waarde in Gennep?

De gemiddelde WOZ-waarde in Gennep is in 2025 circa € 347.000.

Wat is het gemiddelde inkomen per inwoner in Gennep?

Het gemiddelde inkomen per inwoner in Gennep ligt rond € 31.500 per jaar.

Hoe veilig is wonen in Gennep?

Voor het huidige jaar gaat het om ongeveer 335 geregistreerde misdrijven. Gebruik deze cijfers als indicatie en vergelijk trends per periode.

Welke woningtypen komen het meest voor in Gennep?

In Gennep komt vooral "Tussenwoningen" veel voor, met ongeveer 1.427 woningen.

Receive free, non-binding quotes

Compare multiple real estate agents and choose the best match.