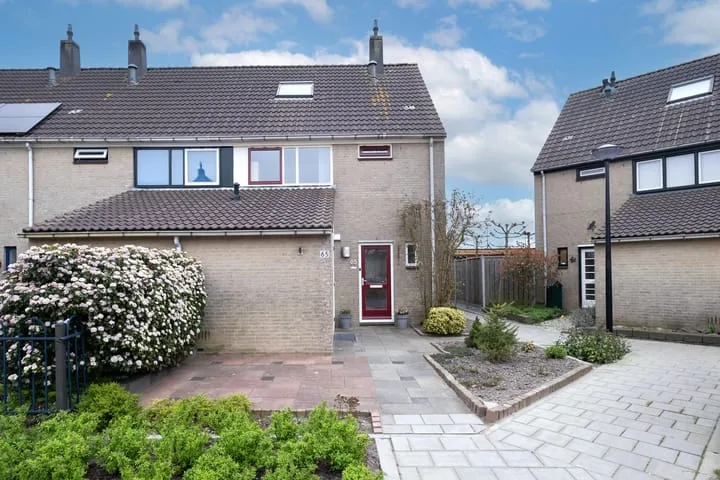
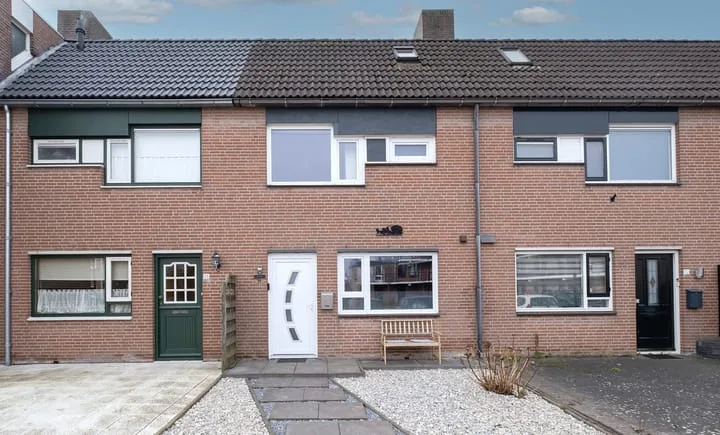
- Sold
Zeearend 70
1704TE Heerhugowaard
€ 425.000 k.k.
€ 3.935/m²
- Living area
- 108 m²
- Land area
- 176 m²
- Bedrooms
- 4
View 592 sold houses in Heerhugowaard
Type to search. Use arrow down and arrow up to navigate through results and press Enter to open.
Hidden search suggestions.
Compare sold homes in Heerhugowaard or view the current offering in this location directly.
On this page you will find recently sold homes in Heerhugowaard. Use this overview to better estimate selling prices, popular neighborhoods, and the local housing supply before you choose a real estate agent. Also view the current housing supply with 845 houses in Heerhugowaard.
1704TE Heerhugowaard
€ 425.000 k.k.
€ 3.935/m²
1701NG Heerhugowaard
€ 430.000 k.k.
€ 3.282/m²
1703VB Heerhugowaard
€ 415.000 k.k.
€ 3.516/m²
1703NR Heerhugowaard
€ 295.000 k.k.
€ 3.986/m²
1701BN Heerhugowaard
€ 415.000 k.k.
€ 3.672/m²
1705KK Heerhugowaard
€ 450.000 k.k.
€ 3.814/m²
1702AP Heerhugowaard
€ 350.000 k.k.
€ 3.500/m²
1706AA Heerhugowaard
€ 715.000 k.k.
€ 4.642/m²
1701KG Heerhugowaard
€ 450.000 k.k.
€ 3.260/m²
1702BM Heerhugowaard
€ 345.000 k.k.
€ 3.000/m²
1703PH Heerhugowaard
€ 350.000 k.k.
€ 2.822/m²
1706BL Heerhugowaard
€ 395.000 k.k.
€ 5.266/m²
1701CK Heerhugowaard
€ 375.000 k.k.
€ 3.348/m²
1706AT Heerhugowaard
€ 519.500 k.k.
€ 4.156/m²
1701CP Heerhugowaard
€ 450.000 k.k.
€ 4.090/m²
1703KM Heerhugowaard
€ 375.000 k.k.
€ 3.826/m²
1703PA Heerhugowaard
€ 432.500 k.k.
€ 3.067/m²
1703MT Heerhugowaard
€ 375.000 k.k.
€ 3.378/m²
1704XJ Heerhugowaard
€ 475.000 k.k.
€ 5.459/m²
1701XD Heerhugowaard
€ 400.000 k.k.
€ 3.508/m²
1705LW Heerhugowaard
€ 380.000 k.k.
€ 4.691/m²
1702KL Heerhugowaard
€ 375.000 k.k.
€ 3.099/m²
1705TA Heerhugowaard
€ 295.000 k.k.
€ 5.000/m²
1703JB Heerhugowaard
€ 375.000 k.k.
€ 3.348/m²
1705DM Heerhugowaard
€ 450.000 k.k.
€ 3.103/m²
1702SP Heerhugowaard
€ 365.000 k.k.
€ 3.724/m²
1706AM Heerhugowaard
€ 450.000 k.k.
€ 3.913/m²
1705EP Heerhugowaard
€ 469.000 k.k.
€ 3.500/m²
Get free quotes from realtors with local market knowledge in Heerhugowaard.
Selling a home in Heerhugowaard? Compare real estate agents who know the local housing market. Also check out all real estate agents in Heerhugowaard or the top 10 real estate agents in Heerhugowaard for extra context for your choice.
By comparing brokers and requesting quotes
Short answers about housing prices, sold homes and comparing real estate agents in Heerhugowaard.
The costs of a real estate agent in Heerhugowaard vary per office, property type and sales approach. Therefore, compare multiple quotes and also look at the real estate agents in Heerhugowaard to better compare rates, presentation and local experience.
On this page we currently show 592 sold houses in Heerhugowaard from our selection. This helps you to better assess recent transactions and the local housing market.
Houses sold in Heerhugowaard give insight into asking prices, house types and neighborhoods where recent transactions have taken place. Compare this also with the current housing stock in Heerhugowaard to better understand the market.
You can use sold homes as a first market indication, but a local real estate agent can better take into account finishing, location, maintenance and current demand in Heerhugowaard.
Compare realtors in Heerhugowaard on local sales experience, reviews, expected yield, commission and marketing approach. The top 10 realtors in Heerhugowaard helps to quickly discover strong offices.
View current location data on residents, WOZ development, housing stock, energy consumption, business activity and safety in Heerhugowaard. In 2025 were there 61.740 residents. The average WOZ value in 2025 is EUR 397.966.
These figures help to better assess and compare the housing stock in Heerhugowaard with recent sold homes. Orient yourself then on suitable top real estate agents in Heerhugowaard for sales advice in this region.
Residents
61.740
Last year: 2025
Average WOZ
EUR 397.966
Last year: 2025
Average income per person.
EUR 29.185
Source: AllNumbers
Crimes (current year)
2.682
Total registered
| Year | Residents |
|---|---|
| 2021 | 58.392 |
| 2022 | 59.035 |
| 2023 | 60.230 |
| 2024 | 61.195 |
| 2025 | 61.740 |
| Year | Average WOZ |
|---|---|
| 2021 | EUR 270.476 |
| 2022 | EUR 298.354 |
| 2023 | EUR 354.623 |
| 2024 | EUR 377.372 |
| 2025 | EUR 397.966 |
Hoger
11.730
Praktisch
12.850
Middelbaar
20.790
Europa
5.065
Nederland
45.500
Buiten Europa
11.165
Label A
9.995
Label C
6.750
Label B
5.040
Label D
1.395
Label A+
1.061
Label A++
1.039
Label A+++
785
Label G
360
Label F
355
Label E
292
Label A++++
212
Label A+++++
14
| Year | Gas (m3) | Electricity (kWh) |
|---|---|---|
| 2020 | 965 | 2.883 |
| 2021 | 1.045 | 2.947 |
| 2022 | 791 | 2.741 |
| 2023 | 670 | 2.588 |
| 2024 | 640 | 2.654 |
Hoekwoning
Gas: 771 • Electricity: 2.746
Huurwoning
Gas: 515 • Electricity: 1.992
Koopwoning
Gas: 753 • Electricity: 2.824
Appartement
Gas: 368 • Electricity: 1.691
Tussenwoning
Gas: 673 • Electricity: 2.546
Vrijstaande woning
Gas: 1.065 • Electricity: 3.586
Twee-onder-één-kap woning
Gas: 803 • Electricity: 2.692
Total number of company establishments: 7.190
| Period | Crimes |
|---|---|
| jan 2025 | 215 |
| jan 2026 | 223 |
| jul 2025 | 243 |
| jun 2025 | 260 |
| mei 2025 | 179 |
| mrt 2025 | 226 |
| nov 2024 | 205 |
| nov 2025 | 223 |
| okt 2024 | 214 |
| okt 2025 | 267 |
| sep 2024 | 180 |
| sep 2025 | 234 |
These figures give an indicative picture of safety trends in the living environment of Heerhugowaard.
Short answers based on current local statistics, handy for a quick comparison of the living environment.
Heerhugowaard telt in 2025 ongeveer 61.740 inwoners.
De gemiddelde WOZ-waarde in Heerhugowaard is in 2025 circa € 397.966.
Het gemiddelde inkomen per inwoner in Heerhugowaard ligt rond € 29.185 per jaar.
Voor het huidige jaar gaat het om ongeveer 2.682 geregistreerde misdrijven. Gebruik deze cijfers als indicatie en vergelijk trends per periode.
In Heerhugowaard komt vooral "Tussenwoningen" veel voor, met ongeveer 11.634 woningen.