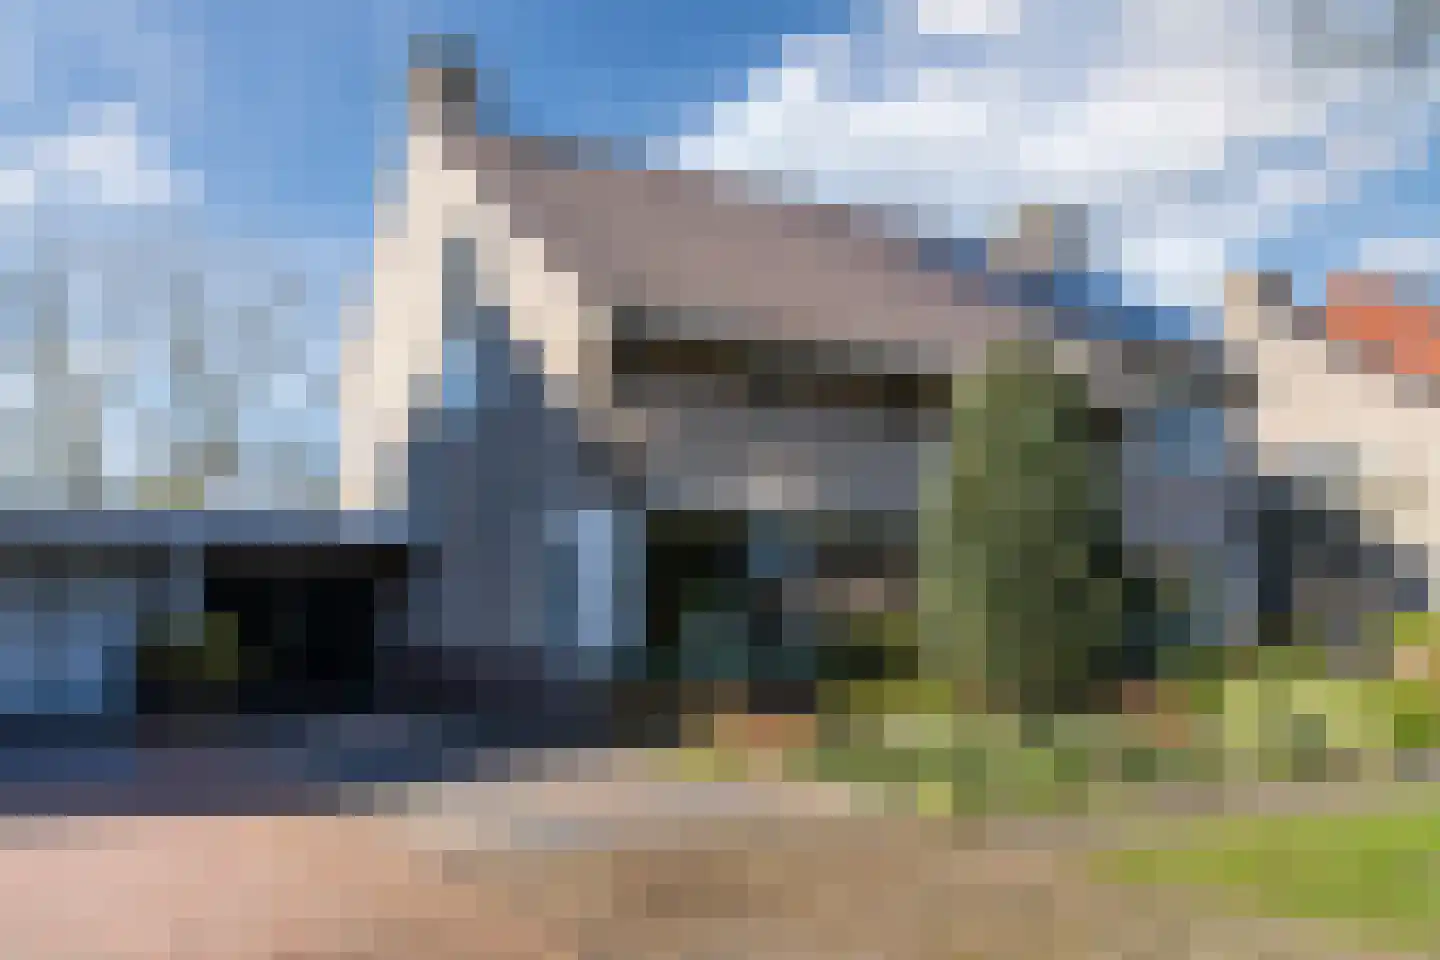
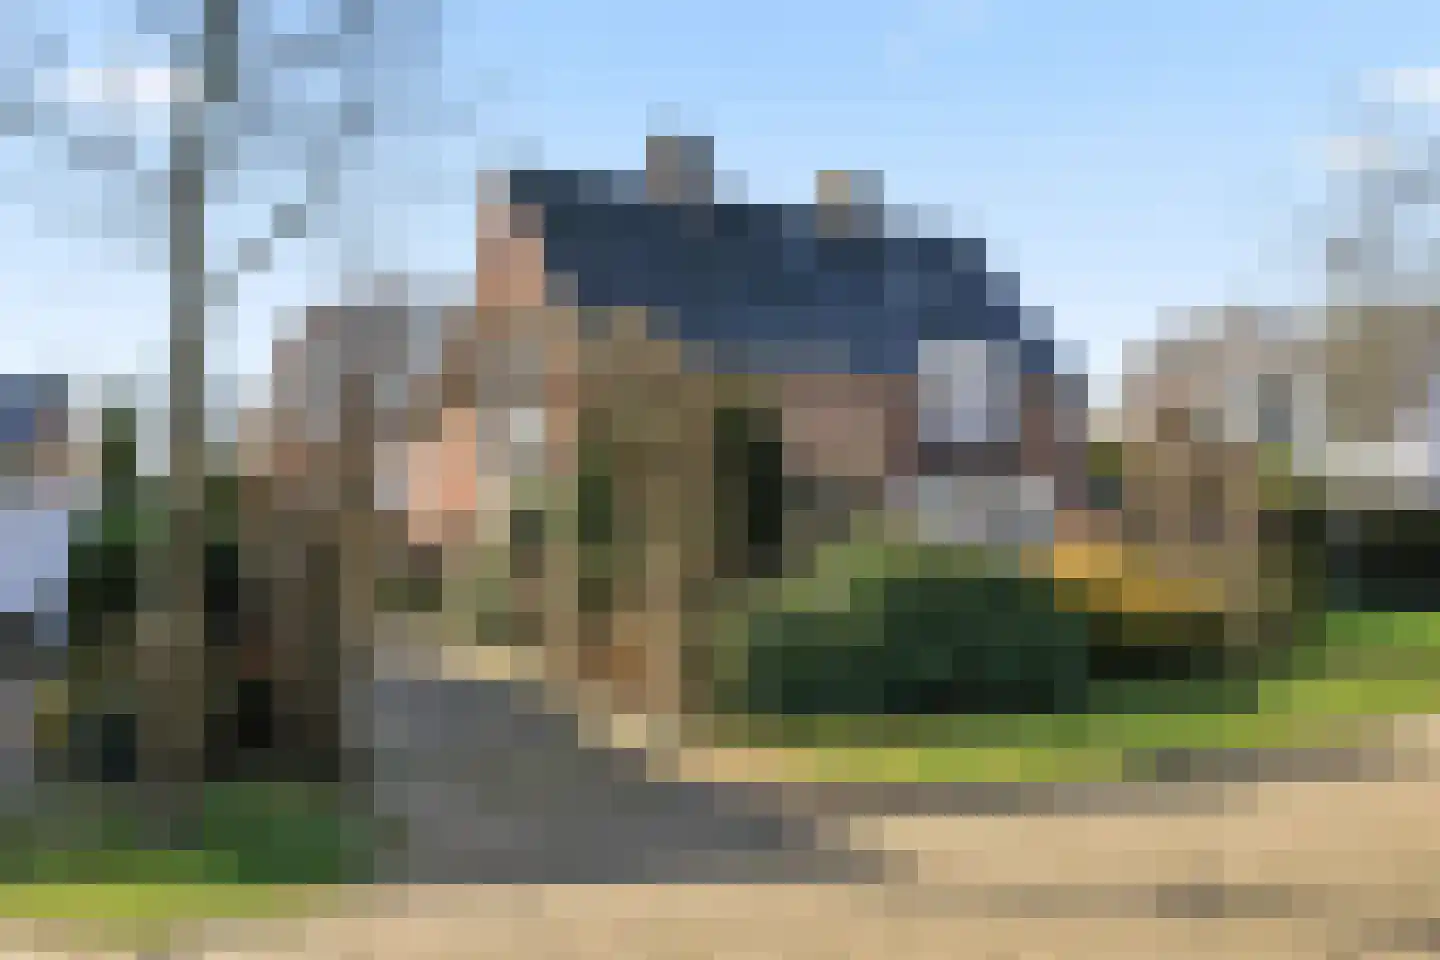
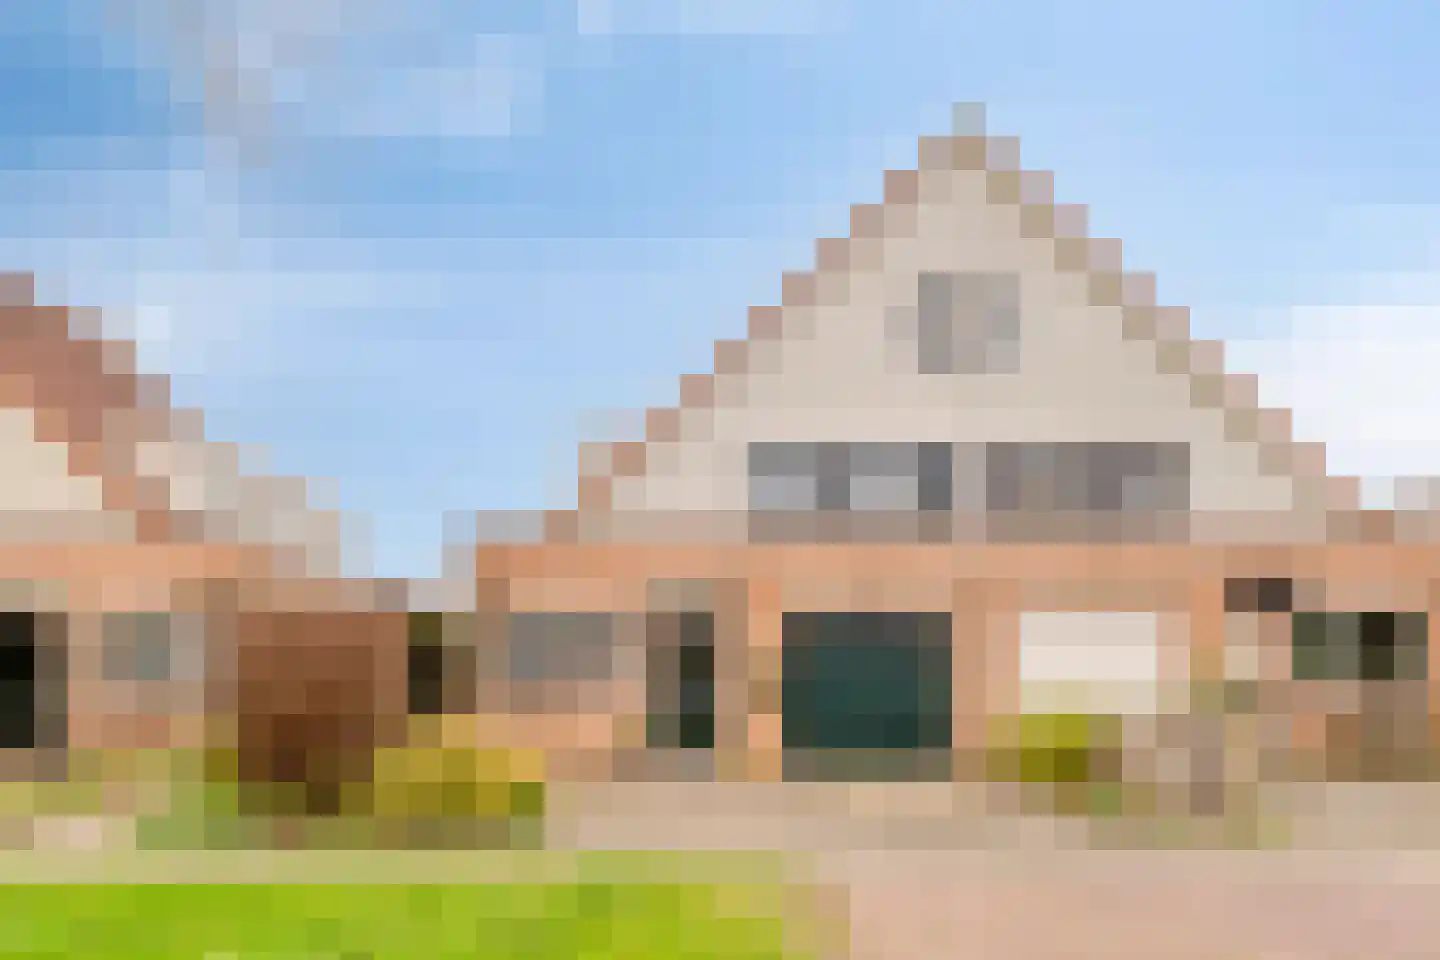
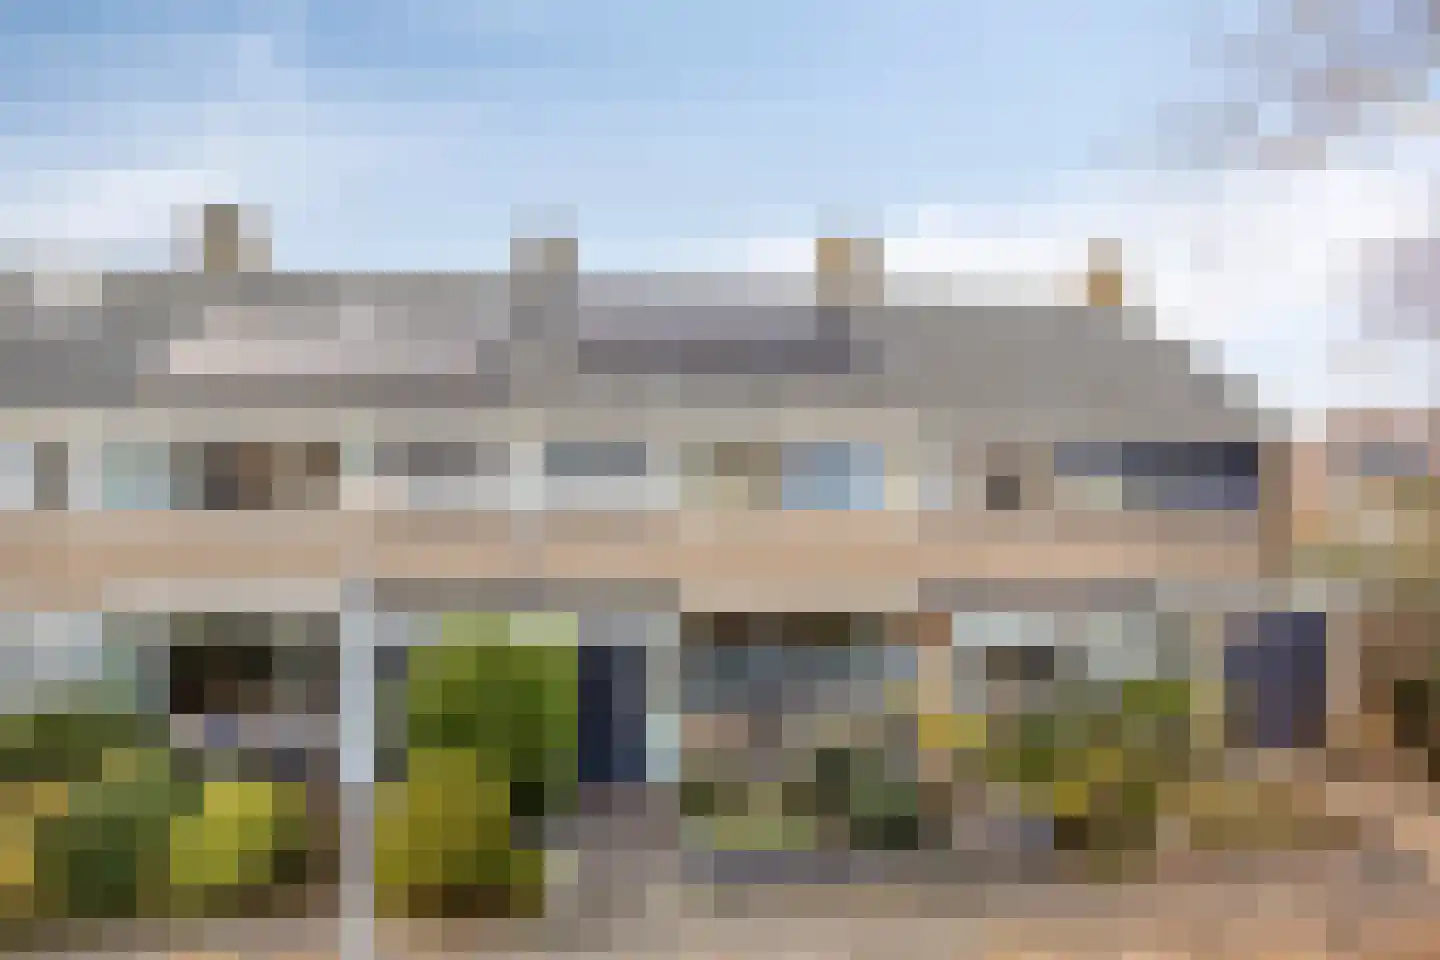
- Sold
Mariënstein 101
1852SJ Heiloo
€ 550.000 k.k.
€ 4.545/m²
- Living area
- 121 m²
- Land area
- 206 m²
- Bedrooms
- 4
View 229 sold houses in Heiloo
Type to search. Use arrow down and arrow up to navigate through results and press Enter to open.
Hidden search suggestions.
Compare sold homes in Heiloo or view the current offering in this location directly.
On this page you will find recently sold homes in Heiloo. Use this overview to better estimate selling prices, popular neighborhoods, and the local housing supply before you choose a real estate agent. Also view the current housing supply with 346 houses in Heiloo.
1852SJ Heiloo
€ 550.000 k.k.
€ 4.545/m²
1852LN Heiloo
€ 450.000 k.k.
€ 5.556/m²
1851AV Heiloo
€ 450.000 k.k.
€ 4.054/m²
1852VM Heiloo
€ 550.000 k.k.
€ 5.670/m²
1852KB Heiloo
€ 745.000 k.k.
€ 5.034/m²
1851KJ Heiloo
€ 500.000 k.k.
€ 5.747/m²
1853AL Heiloo
€ 1.285.000 k.k.
€ 6.090/m²
1852XW Heiloo
€ 600.000 k.k.
€ 4.800/m²
1852CM Heiloo
€ 650.000 k.k.
€ 6.632/m²
1852EA Heiloo
€ 325.000 k.k.
€ 5.803/m²
1852CH Heiloo
€ 875.000 k.k.
€ 4.679/m²
1852HA Heiloo
€ 745.000 k.k.
€ 5.321/m²
1852AR Heiloo
€ 400.000 k.k.
€ 7.272/m²
1852JG Heiloo
€ 525.000 k.k.
€ 5.965/m²
1851PH Heiloo
€ 450.000 k.k.
€ 5.625/m²
1851ZL Heiloo
€ 650.000 k.k.
€ 5.372/m²
1851WB Heiloo
€ 315.000 k.k.
€ 5.250/m²
1851GM Heiloo
€ 1.100.000 k.k.
€ 5.913/m²
1851KM Heiloo
€ 475.000 k.k.
€ 5.107/m²
1851MW Heiloo
€ 392.500 k.k.
€ 6.652/m²
1852VA Heiloo
€ 550.000 k.k.
€ 3.900/m²
1851JB Heiloo
€ 550.000 k.k.
€ 6.875/m²
1851ZW Heiloo
€ 429.500 k.k.
€ 5.302/m²
1851LJ Heiloo
€ 575.000 k.k.
€ 5.750/m²
1851BV Heiloo
€ 425.000 k.k.
€ 4.126/m²
1851WB Heiloo
€ 325.000 k.k.
€ 5.416/m²
1851VH Heiloo
€ 550.000 k.k.
€ 4.583/m²
1851PE Heiloo
€ 250.000 k.k.
€ 6.578/m²
Bekijk recente verkopen en ontvang gratis offertes van lokale verkoopmakelaars in Heiloo.
Recent verkocht in Heiloo? Lees de verkoopgerichte gids huis verkopen in Heiloo, vergelijk verkoopmakelaars in Heiloo of bekijk de beste verkoopmakelaars in Heiloo voor referentie bij jouw keuze.
Makelaars maken scherpere voorstellen als ze weten dat je vergelijkt — vraag offertes aan voor verkoop of aankoop.
Short answers about housing prices, sold homes and comparing real estate agents in Heiloo.
The costs of a real estate agent in Heiloo vary per office, property type and sales approach. Therefore, compare multiple quotes and also look at the real estate agents in Heiloo to better compare rates, presentation and local experience.
On this page we currently show 229 sold houses in Heiloo from our selection. This helps you to better assess recent transactions and the local housing market.
Houses sold in Heiloo give insight into asking prices, house types and neighborhoods where recent transactions have taken place. Compare this also with the current housing stock in Heiloo to better understand the market.
Je kunt verkochte woningen gebruiken als eerste marktindicatie, maar een lokale makelaar kan beter rekening houden met afwerking, ligging, onderhoud en actuele vraag in Heiloo. Plan de volgende stap via de gids huis verkopen in Heiloo.
Vergelijk makelaars in Heiloo op lokale verkoopervaring, reviews, verwachte opbrengst, courtage en marketingaanpak. Bekijk verkoopmakelaars in Heiloo of de top 10 makelaars in Heiloo om snel sterke kantoren te ontdekken.
View current location data on residents, WOZ development, housing stock, energy consumption, business activity and safety in Heiloo. In 2026 were there 24.612 residents. The average WOZ value in 2025 is EUR 544.000.
These figures help to better assess and compare the housing stock in Heiloo with recent sold homes. Orient yourself then on suitable top real estate agents in Heiloo for sales advice in this region.
Residents
24.612
Last year: 2026
Average WOZ
EUR 544.000
Last year: 2025
Average income per person.
EUR 40.300
Source: AllNumbers
Crimes (current year)
611
Total registered
| Year | Residents |
|---|---|
| 2022 | 24.417 |
| 2023 | 24.319 |
| 2024 | 24.312 |
| 2025 | 24.341 |
| 2026 | 24.612 |
| Year | Average WOZ |
|---|---|
| 2021 | EUR 385.000 |
| 2022 | EUR 417.000 |
| 2023 | EUR 505.000 |
| 2024 | EUR 515.000 |
| 2025 | EUR 544.000 |
Hoger
44
Praktisch
18
Middelbaar
38
Europa
1.476
Nederland
20.535
Buiten Europa
2.330
Label A
2.924
Label C
2.612
Label B
1.549
Label D
1.067
Label G
968
Label F
790
Label E
640
Label A+
426
Label A++
236
Label A+++
194
Label A++++
143
Label A+++++
1
| Year | Gas (m3) | Electricity (kWh) |
|---|---|---|
| 2020 | 1.310 | 2.810 |
| 2021 | 1.480 | 2.860 |
| 2022 | 1.140 | 2.650 |
| 2023 | 980 | 2.510 |
| 2024 | 930 | 2.570 |
Hoekwoning
Gas: 1.020 • Electricity: 2.530
Huurwoning
Gas: 640 • Electricity: 1.580
Koopwoning
Gas: 1.100 • Electricity: 2.830
Appartement
Gas: 550 • Electricity: 1.540
Tussenwoning
Gas: 920 • Electricity: 2.400
Vrijstaande woning
Gas: 1.440 • Electricity: 3.590
Twee-onder-één-kap woning
Gas: 1.160 • Electricity: 2.870
Total number of company establishments: 3.430
| Period | Crimes |
|---|---|
| jan 2025 | 30 |
| jan 2026 | 52 |
| jul 2025 | 58 |
| jun 2025 | 50 |
| mei 2025 | 48 |
| mrt 2025 | 83 |
| nov 2024 | 54 |
| nov 2025 | 56 |
| okt 2024 | 76 |
| okt 2025 | 44 |
| sep 2024 | 52 |
| sep 2025 | 52 |
These figures give an indicative picture of safety trends in the living environment of Heiloo.
Short answers based on current local statistics, handy for a quick comparison of the living environment.
Heiloo telt in 2026 ongeveer 24.612 inwoners.
De gemiddelde WOZ-waarde in Heiloo is in 2025 circa € 544.000.
Het gemiddelde inkomen per inwoner in Heiloo ligt rond € 40.300 per jaar.
Voor het huidige jaar gaat het om ongeveer 611 geregistreerde misdrijven. Gebruik deze cijfers als indicatie en vergelijk trends per periode.
In Heiloo komt vooral "Tussenwoningen" veel voor, met ongeveer 3.115 woningen.