- Sold
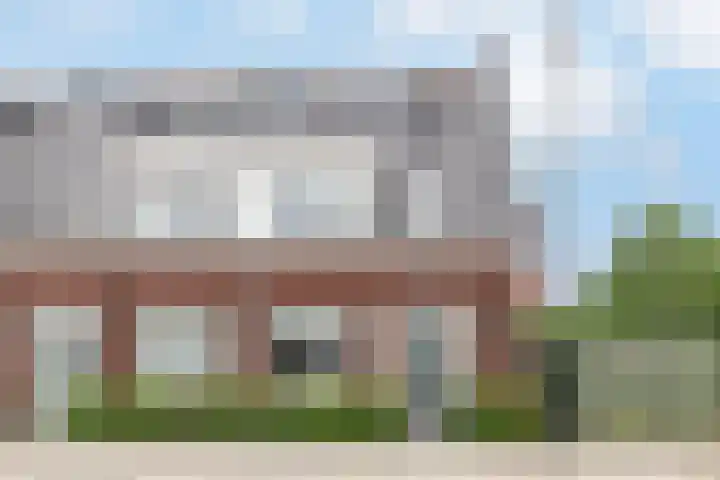
Kortenhoevenseweg 99 A
4128CP Lexmond
€ 725.000 k.k.
€ 5.754/m²
- Living area
- 126 m²
- Land area
- 585 m²
- Bedrooms
- 4
View 14 sold houses in Lexmond
Type to search. Use arrow down and arrow up to navigate through results and press Enter to open.
Hidden search suggestions.
Compare sold homes in Lexmond or view the current offering in this location directly.
On this page you will find recently sold homes in Lexmond. Use this overview to better estimate selling prices, popular neighborhoods, and the local housing supply before you choose a real estate agent. Also view the current housing supply with 20 houses in Lexmond.
4128CP Lexmond
€ 725.000 k.k.
€ 5.754/m²
4128LL Lexmond
€ 1.100.000 k.k.
€ 5.729/m²
4128BZ Lexmond
€ 595.000 k.k.
€ 3.419/m²
4128CK Lexmond
€ 410.000 k.k.
€ 5.857/m²
4128AA Lexmond
€ 550.000 k.k.
€ 4.074/m²
4128EA Lexmond
€ 500.000 k.k.
€ 4.716/m²
4128BV Lexmond
€ 550.000 k.k.
€ 3.437/m²
4128CK Lexmond
Price upon request
4128CA Lexmond
€ 609.000 k.k.
€ 5.342/m²
4128LD Lexmond
€ 825.000 k.k.
€ 3.801/m²
4128LT Lexmond
€ 795.000 k.k.
€ 6.570/m²
4128EA Lexmond
€ 500.000 k.k.
€ 4.672/m²
4128EA Lexmond
€ 575.000 k.k.
€ 4.078/m²
4128SG Lexmond
€ 489.000 k.k.
€ 4.327/m²
Bekijk recente verkopen en ontvang gratis offertes van lokale makelaars. Vergelijk meer dan 33 makelaars in Lexmond.
Zelf je woning verkopen in Lexmond? Vergelijk verkoopmakelaars in Lexmond of bekijk de beste verkoopmakelaars in Lexmond als referentie bij jouw keuze.
Makelaars maken scherpere voorstellen als ze weten dat je vergelijkt — vraag offertes aan voor verkoop of aankoop.
Short answers about housing prices, sold homes and comparing real estate agents in Lexmond.
De kosten van een makelaar in Lexmond verschillen per kantoor, woningtype en verkoopaanpak. In Lexmond kun je 33 real estate agents vergelijken; bekijk daarom ook de makelaars in Lexmond om tarieven, presentatie en lokale ervaring beter naast elkaar te zetten.
On this page we currently show 14 sold houses in Lexmond from our selection. This helps you to better assess recent transactions and the local housing market.
Houses sold in Lexmond give insight into asking prices, house types and neighborhoods where recent transactions have taken place. Compare this also with the current housing stock in Lexmond to better understand the market.
You can use sold homes as a first market indication, but a local real estate agent can better take into account finishing, location, maintenance and current demand in Lexmond.
Vergelijk de 33 real estate agents in Lexmond op lokale verkoopervaring, reviews, verwachte opbrengst, courtage en marketingaanpak. Bekijk verkoopmakelaars in Lexmond of de top 10 makelaars in Lexmond om snel sterke kantoren te ontdekken.
View current location data on residents, WOZ development, housing stock, energy consumption, business activity and safety in Lexmond. In 2025 were there 3.000 residents. The average WOZ value in 2025 is EUR 459.469.
These figures help to better assess and compare the housing stock in Lexmond with recent sold homes. Orient yourself then on suitable top real estate agents in Lexmond for sales advice in this region.
Residents
3.000
Last year: 2025
Average WOZ
EUR 459.469
Last year: 2025
Average income per person.
EUR 33.428
Source: AllNumbers
Crimes (current year)
68
Total registered
| Year | Residents |
|---|---|
| 2021 | 2.960 |
| 2022 | 2.955 |
| 2023 | 2.970 |
| 2024 | 3.010 |
| 2025 | 3.000 |
| Year | Average WOZ |
|---|---|
| 2021 | EUR 312.929 |
| 2022 | EUR 378.381 |
| 2023 | EUR 434.143 |
| 2024 | EUR 439.333 |
| 2025 | EUR 459.469 |
Hoger
540
Praktisch
540
Middelbaar
1.110
Europa
115
Nederland
2.725
Buiten Europa
160
Label A
399
Label C
241
Label G
215
Label B
146
Label D
87
Label F
80
Label E
40
Label A+
36
Label A++
10
Label A+++
10
Label A++++
0
Label A+++++
0
| Year | Gas (m3) | Electricity (kWh) |
|---|---|---|
| 2020 | 1.366 | 3.110 |
| 2021 | 1.519 | 3.190 |
| 2022 | 1.205 | 3.014 |
| 2023 | 1.018 | 2.911 |
| 2024 | 989 | 3.012 |
Hoekwoning
Gas: 658 • Electricity: 1.765
Huurwoning
Gas: 876 • Electricity: 2.123
Koopwoning
Gas: 1.086 • Electricity: 3.245
Appartement
Gas: 806 • Electricity: 2.383
Tussenwoning
Gas: 561 • Electricity: 1.548
Vrijstaande woning
Gas: 1.360 • Electricity: 3.933
Twee-onder-één-kap woning
Gas: 1.086 • Electricity: 3.126
Total number of company establishments: 510
| Period | Crimes |
|---|---|
| jan 2026 | 7 |
| jul 2025 | 7 |
| jun 2025 | 10 |
| mei 2025 | 7 |
| mrt 2025 | 6 |
| mrt 2026 | 5 |
| nov 2024 | 5 |
| nov 2025 | 5 |
| okt 2024 | 6 |
| okt 2025 | 7 |
| sep 2024 | 2 |
| sep 2025 | 1 |
These figures give an indicative picture of safety trends in the living environment of Lexmond.
Short answers based on current local statistics, handy for a quick comparison of the living environment.
Lexmond telt in 2025 ongeveer 3.000 inwoners.
De gemiddelde WOZ-waarde in Lexmond is in 2025 circa € 459.469.
Het gemiddelde inkomen per inwoner in Lexmond ligt rond € 33.428 per jaar.
Voor het huidige jaar gaat het om ongeveer 68 geregistreerde misdrijven. Gebruik deze cijfers als indicatie en vergelijk trends per periode.
In Lexmond komt vooral "Vrijstaande woningen" veel voor, met ongeveer 357 woningen.