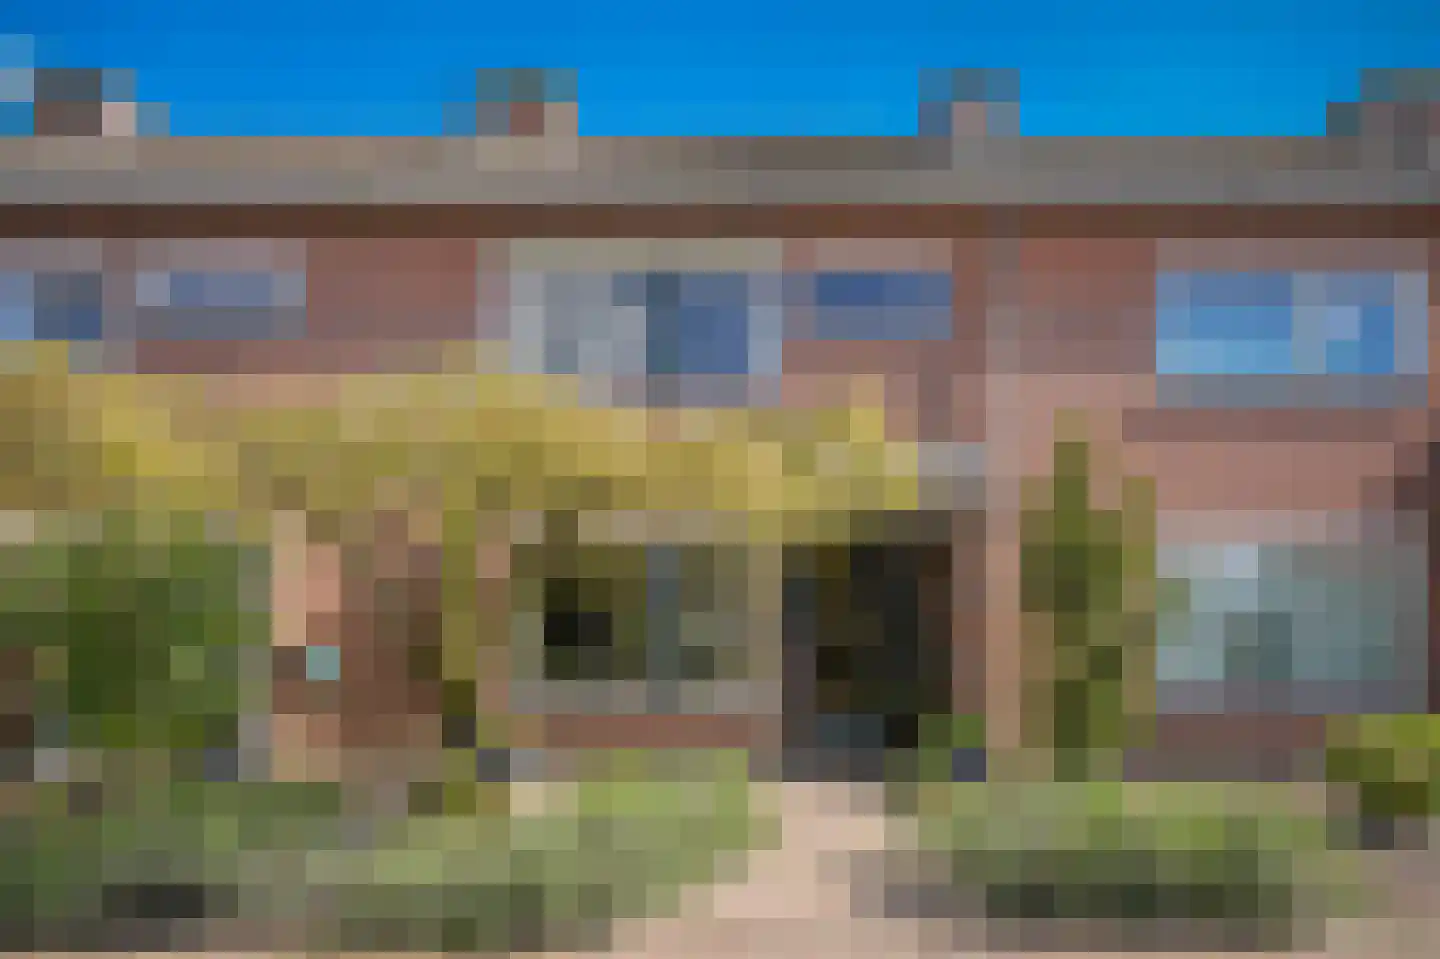
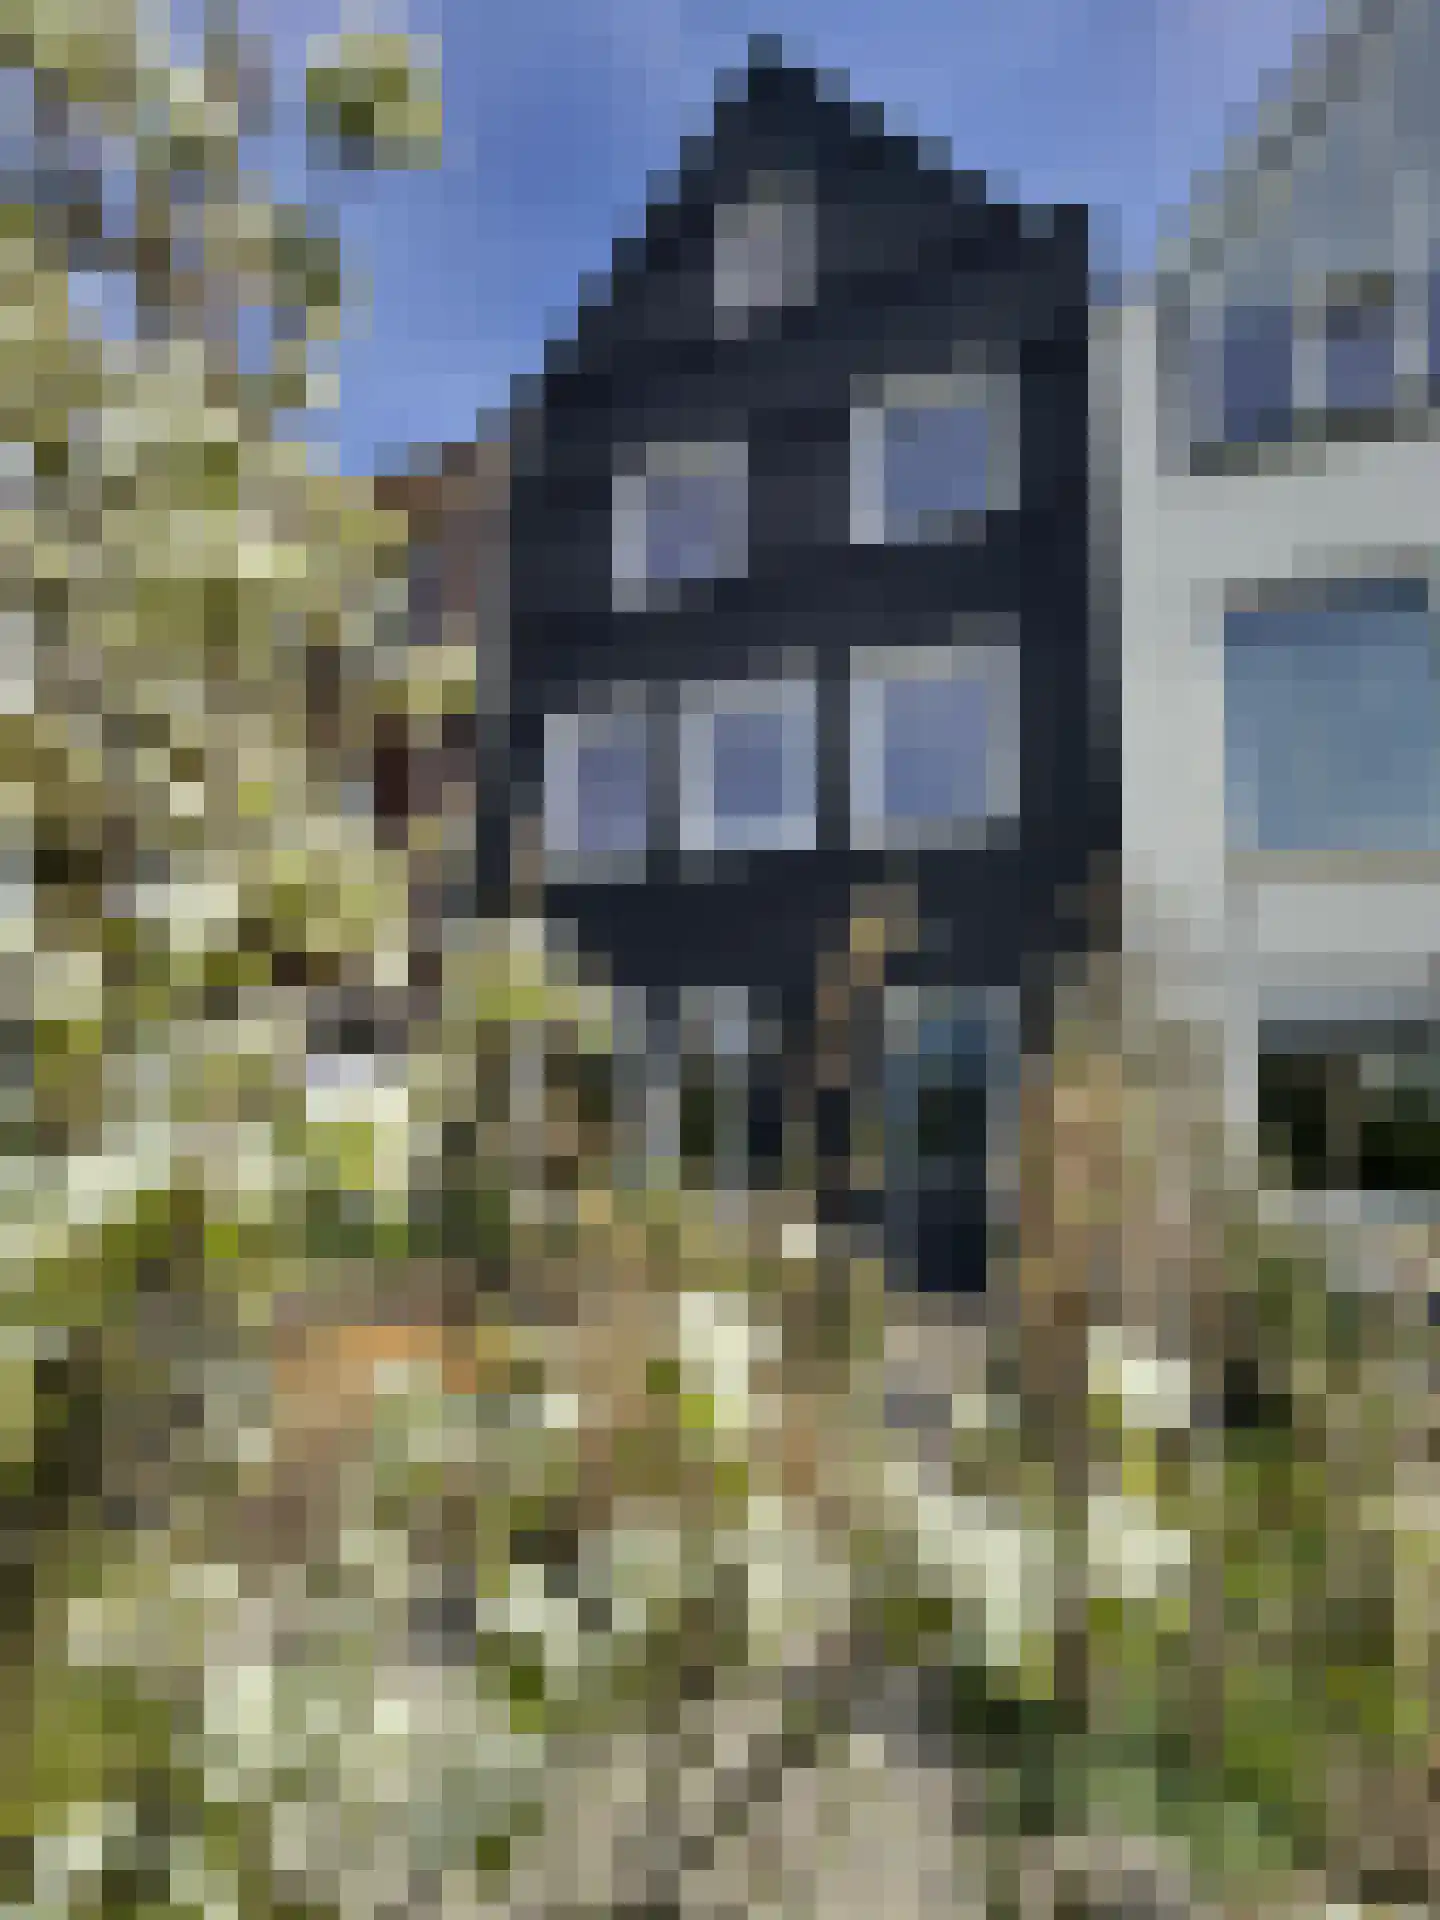
- Available
Lakerveld 97
4128LG Lexmond
€ 750.000 k.k.
€ 5.208/m²
- Living area
- 144 m²
- Land area
- 8040 m²
- Bedrooms
- 6
Searching in 20 houses in Lexmond
Type to search. Use arrow down and arrow up to navigate through results and press Enter to open.
Hidden search suggestions.
View current properties in Lexmond or search targeted on street, postal code and property characteristics.
View the current housing stock in Lexmond and quickly filter by price, living area, rooms and more. There are currently 20 houses in this place within our selection. View also 14 sold houses in Lexmond for extra insight into the local housing market.
4128LG Lexmond
€ 750.000 k.k.
€ 5.208/m²
4128LS Lexmond
€ 1.379.000 k.k.
€ 5.345/m²
4128LL Lexmond
€ 550.000 k.k.
€ 4.955/m²
4128SG Lexmond
€ 425.000 k.k.
€ 3.602/m²
4128EA Lexmond
€ 839.000 k.k.
€ 4.347/m²
4128AA Lexmond
€ 720.000 k.k.
€ 5.070/m²
4128LW Lexmond
€ 1.985.000 k.k.
€ 6.941/m²
4128CP Lexmond
€ 725.000 k.k.
€ 5.754/m²
4128LL Lexmond
€ 1.100.000 k.k.
€ 5.729/m²
4128BZ Lexmond
€ 595.000 k.k.
€ 3.419/m²
4128CK Lexmond
€ 410.000 k.k.
€ 5.857/m²
4128AA Lexmond
€ 550.000 k.k.
€ 4.074/m²
4128EA Lexmond
€ 500.000 k.k.
€ 4.716/m²
4128BV Lexmond
€ 550.000 k.k.
€ 3.437/m²
4128CK Lexmond
Price upon request
4128CA Lexmond
€ 609.000 k.k.
€ 5.342/m²
4128LD Lexmond
€ 825.000 k.k.
€ 3.801/m²
4128LT Lexmond
€ 795.000 k.k.
€ 6.570/m²
4128EA Lexmond
€ 500.000 k.k.
€ 4.672/m²
4128EA Lexmond
€ 575.000 k.k.
€ 4.078/m²
Get free quotes from real estate agents with local market knowledge. Compare more than 33 real estate agents in Lexmond.
Selling a home in Lexmond? Compare all real estate agents in Lexmond or view the top 10 real estate agents in Lexmond for extra context for your choice.
Real estate agents make sharper offers when they know you're comparing — ask for quotes for sale or purchase.
Practical answers about housing supply, sales and comparing real estate agents in Lexmond.
The costs of a real estate agent in Lexmond depend on commission, setup costs, property presentation and the chosen service. Compare the 33 real estate agents in Lexmond via the real estate agent page and request multiple quotes to compare rates and approach well.
Within our selection, we are currently showing 20 houses in Lexmond. View also the sold houses in Lexmond to compare the current offering with recent transactions.
Take into account not only price and living area but also maintenance, energy label, location, outdoor space and sales status. This way you compare houses in Lexmond on more than just the asking price.
A local real estate agent knows the neighborhoods, recent transactions and demand in Lexmond. By comparing 33 real estate agents in the region you get a better insight into prices, sales strategy and expected yield; the top 10 in Lexmond provides a useful starting point.
Yes, when making a sales plan, a valuation in Lexmond is wise. You gain insight into a realistic asking price and can then compare offers from real estate agents specifically.
View current location data on residents, WOZ development, housing stock, energy consumption, business activity and safety in Lexmond. In 2025 were there 3.000 residents. The average WOZ value in 2025 is EUR 459.469.
These figures help to better assess and compare the housing stock in Lexmond with recent sold homes. Orient yourself then on suitable top real estate agents in Lexmond for sales advice in this region.
Residents
3.000
Last year: 2025
Average WOZ
EUR 459.469
Last year: 2025
Average income per person.
EUR 33.428
Source: AllNumbers
Crimes (current year)
68
Total registered
| Year | Residents |
|---|---|
| 2021 | 2.960 |
| 2022 | 2.955 |
| 2023 | 2.970 |
| 2024 | 3.010 |
| 2025 | 3.000 |
| Year | Average WOZ |
|---|---|
| 2021 | EUR 312.929 |
| 2022 | EUR 378.381 |
| 2023 | EUR 434.143 |
| 2024 | EUR 439.333 |
| 2025 | EUR 459.469 |
Hoger
540
Praktisch
540
Middelbaar
1.110
Europa
115
Nederland
2.725
Buiten Europa
160
Label A
399
Label C
241
Label G
215
Label B
146
Label D
87
Label F
80
Label E
40
Label A+
36
Label A++
10
Label A+++
10
Label A++++
0
Label A+++++
0
| Year | Gas (m3) | Electricity (kWh) |
|---|---|---|
| 2020 | 1.366 | 3.110 |
| 2021 | 1.519 | 3.190 |
| 2022 | 1.205 | 3.014 |
| 2023 | 1.018 | 2.911 |
| 2024 | 989 | 3.012 |
Hoekwoning
Gas: 658 • Electricity: 1.765
Huurwoning
Gas: 876 • Electricity: 2.123
Koopwoning
Gas: 1.086 • Electricity: 3.245
Appartement
Gas: 806 • Electricity: 2.383
Tussenwoning
Gas: 561 • Electricity: 1.548
Vrijstaande woning
Gas: 1.360 • Electricity: 3.933
Twee-onder-één-kap woning
Gas: 1.086 • Electricity: 3.126
Total number of company establishments: 510
| Period | Crimes |
|---|---|
| jan 2026 | 7 |
| jul 2025 | 7 |
| jun 2025 | 10 |
| mei 2025 | 7 |
| mrt 2025 | 6 |
| mrt 2026 | 5 |
| nov 2024 | 5 |
| nov 2025 | 5 |
| okt 2024 | 6 |
| okt 2025 | 7 |
| sep 2024 | 2 |
| sep 2025 | 1 |
These figures give an indicative picture of safety trends in the living environment of Lexmond.
Short answers based on current local statistics, handy for a quick comparison of the living environment.
Lexmond telt in 2025 ongeveer 3.000 inwoners.
De gemiddelde WOZ-waarde in Lexmond is in 2025 circa € 459.469.
Het gemiddelde inkomen per inwoner in Lexmond ligt rond € 33.428 per jaar.
Voor het huidige jaar gaat het om ongeveer 68 geregistreerde misdrijven. Gebruik deze cijfers als indicatie en vergelijk trends per periode.
In Lexmond komt vooral "Vrijstaande woningen" veel voor, met ongeveer 357 woningen.