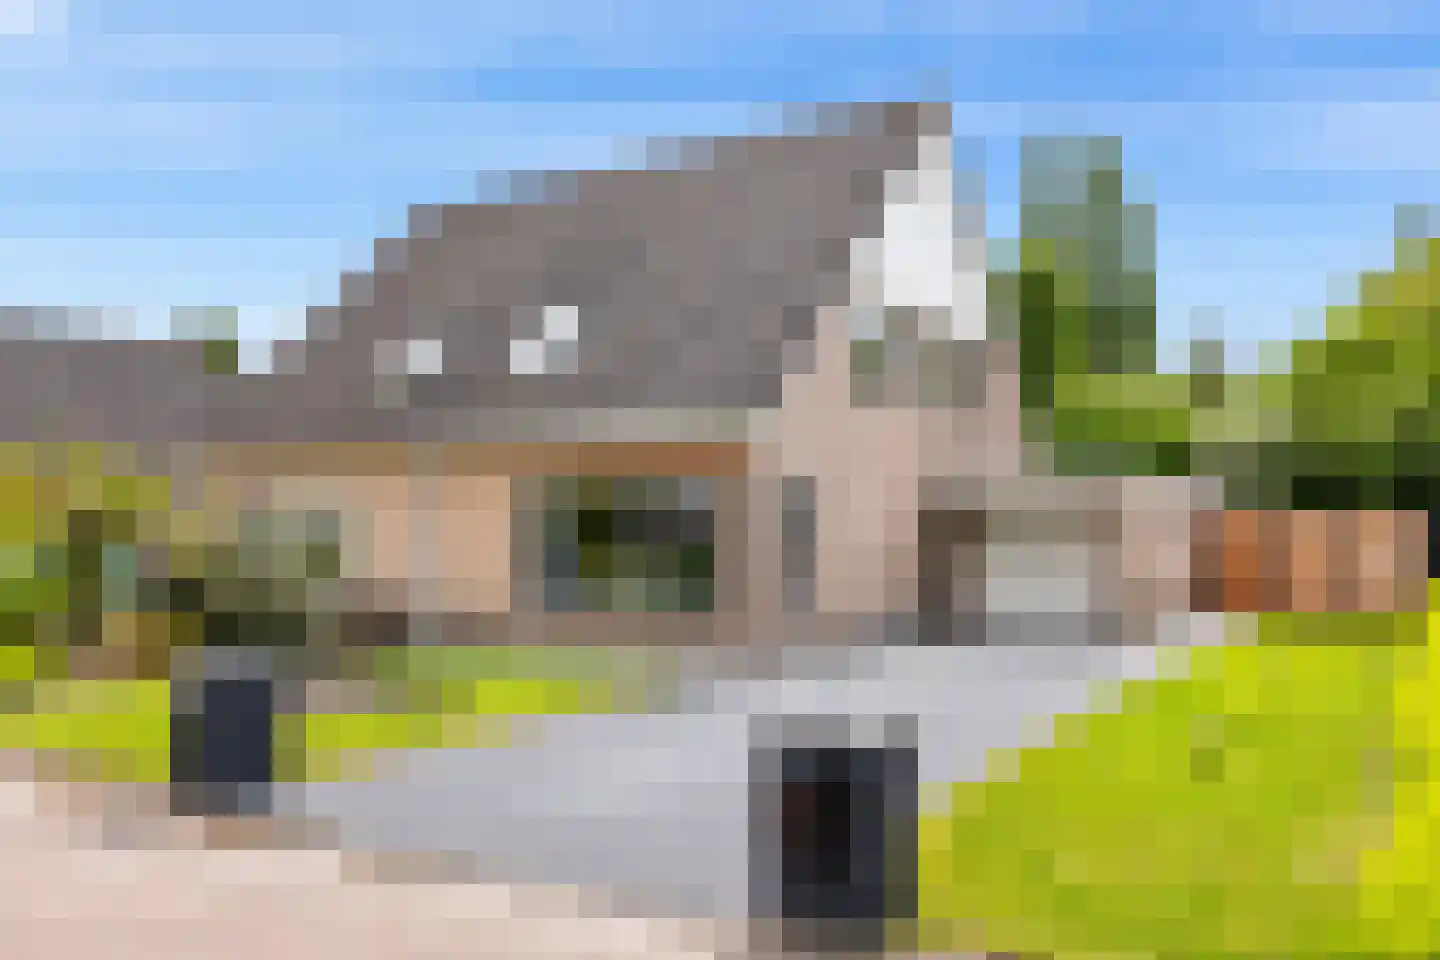
- Available
Parkstraat 11
9635AD Noordbroek
€ 249.500 k.k.
€ 2.772/m²
- Living area
- 90 m²
- Land area
- 356 m²
- Bedrooms
- 3
Searching in 28 houses in Noordbroek
Type to search. Use arrow down and arrow up to navigate through results and press Enter to open.
Hidden search suggestions.
View current properties in Noordbroek or search targeted on street, postal code and property characteristics.
View the current housing stock in Noordbroek and quickly filter by price, living area, rooms and more. There are currently 28 houses in this place within our selection. View also 11 sold houses in Noordbroek for extra insight into the local housing market.
9635AD Noordbroek
€ 249.500 k.k.
€ 2.772/m²
9635AP Noordbroek
€ 650.000 k.k.
€ 3.892/m²
9635TM Noordbroek
€ 435.000 k.k.
€ 2.900/m²
9635AR Noordbroek
€ 550.000 k.k.
€ 3.767/m²
9635AV Noordbroek
€ 185.000 k.k.
€ 1.468/m²
9635AT Noordbroek
€ 1.489.000 k.k.
€ 2.394/m²
9635BR Noordbroek
€ 428.000
€ 3.424/m²
9635BR Noordbroek
€ 428.000
€ 3.424/m²
9635BR Noordbroek
€ 428.000
€ 3.424/m²
9635BR Noordbroek
€ 428.000
€ 3.424/m²
9635BR Noordbroek
€ 428.000
€ 3.424/m²
9635BR Noordbroek
€ 428.000
€ 3.424/m²
9635AP Noordbroek
€ 375.000 k.k.
€ 3.289/m²
9635TV Noordbroek
€ 369.000 k.k.
€ 4.055/m²
9635TG Noordbroek
€ 399.500 k.k.
€ 1.354/m²
9635CC Noordbroek
€ 225.000 k.k.
€ 2.143/m²
9635CP Noordbroek
€ 399.500 k.k.
€ 3.567/m²
9635BK Noordbroek
€ 375.000 k.k.
€ 3.440/m²
9635AT Noordbroek
€ 425.000 k.k.
€ 2.322/m²
9635CK Noordbroek
€ 375.000 k.k.
€ 2.798/m²
9635BV Noordbroek
€ 259.500 k.k.
€ 3.126/m²
9635AB Noordbroek
€ 850.000 k.k.
€ 1.619/m²
9635BT Noordbroek
€ 285.000 k.k.
€ 2.544/m²
9635TV Noordbroek
€ 679.000 k.k.
€ 4.165/m²
9635AV Noordbroek
€ 699.500 k.k.
€ 2.927/m²
9635TG Noordbroek
€ 424.500 k.k.
€ 4.376/m²
9635BS Noordbroek
€ 259.500 k.k.
€ 3.370/m²
9635CB Noordbroek
€ 225.000 k.k.
€ 3.082/m²
Get free quotes from real estate agents with local market knowledge. Compare more than 18 real estate agents in Noordbroek.
Selling a home in Noordbroek? Compare all real estate agents in Noordbroek or view the top 10 real estate agents in Noordbroek for extra context for your choice.
Real estate agents make sharper offers when they know you're comparing — ask for quotes for sale or purchase.
Practical answers about housing supply, sales and comparing real estate agents in Noordbroek.
The costs of a real estate agent in Noordbroek depend on commission, setup costs, property presentation and the chosen service. Compare the 18 real estate agents in Noordbroek via the real estate agent page and request multiple quotes to compare rates and approach well.
Within our selection, we are currently showing 28 houses in Noordbroek. View also the sold houses in Noordbroek to compare the current offering with recent transactions.
Take into account not only price and living area but also maintenance, energy label, location, outdoor space and sales status. This way you compare houses in Noordbroek on more than just the asking price.
A local real estate agent knows the neighborhoods, recent transactions and demand in Noordbroek. By comparing 18 real estate agents in the region you get a better insight into prices, sales strategy and expected yield; the top 10 in Noordbroek provides a useful starting point.
Yes, when making a sales plan, a valuation in Noordbroek is wise. You gain insight into a realistic asking price and can then compare offers from real estate agents specifically.
View current location data on residents, WOZ development, housing stock, energy consumption, business activity and safety in Noordbroek. In 2025 were there 1.825 residents. The average WOZ value in 2025 is EUR 313.000.
These figures help to better assess and compare the housing stock in Noordbroek with recent sold homes. Orient yourself then on suitable top real estate agents in Noordbroek for sales advice in this region.
Residents
1.825
Last year: 2025
Average WOZ
EUR 313.000
Last year: 2025
Average income per person.
EUR 28.800
Source: AllNumbers
Crimes (current year)
30
Total registered
| Year | Residents |
|---|---|
| 2021 | 1.880 |
| 2022 | 1.865 |
| 2023 | 1.875 |
| 2024 | 1.850 |
| 2025 | 1.825 |
| Year | Average WOZ |
|---|---|
| 2021 | EUR 207.000 |
| 2022 | EUR 223.000 |
| 2023 | EUR 257.000 |
| 2024 | EUR 298.000 |
| 2025 | EUR 313.000 |
Hoger
310
Praktisch
360
Middelbaar
690
Europa
75
Nederland
1.670
Buiten Europa
75
Label G
203
Label A
163
Label B
157
Label C
110
Label D
70
Label F
65
Label A+
34
Label E
30
Label A++
4
Label A+++
1
Label A++++
1
Label A+++++
0
| Year | Gas (m3) | Electricity (kWh) |
|---|---|---|
| 2020 | 1.690 | 3.100 |
| 2021 | 1.900 | 3.120 |
| 2022 | 1.490 | 2.960 |
| 2023 | 1.210 | 2.840 |
| 2024 | 1.150 | 2.980 |
Hoekwoning
Gas: 1.240 • Electricity: 2.000
Huurwoning
Gas: 1.070 • Electricity: 2.200
Koopwoning
Gas: 1.280 • Electricity: 3.160
Appartement
Gas: 700 • Electricity: 1.570
Tussenwoning
Gas: 1.130 • Electricity: 2.260
Vrijstaande woning
Gas: 1.350 • Electricity: 3.250
Twee-onder-één-kap woning
Gas: 1.000 • Electricity: 2.480
Total number of company establishments: 220
| Period | Crimes |
|---|---|
| jan 2025 | 2 |
| jan 2026 | 2 |
| jul 2025 | 1 |
| jun 2025 | 3 |
| mei 2025 | 2 |
| mrt 2025 | 4 |
| nov 2024 | 3 |
| nov 2025 | 3 |
| okt 2024 | 1 |
| okt 2025 | 0 |
| sep 2024 | 1 |
| sep 2025 | 3 |
These figures give an indicative picture of safety trends in the living environment of Noordbroek.
Short answers based on current local statistics, handy for a quick comparison of the living environment.
Noordbroek telt in 2025 ongeveer 1.825 inwoners.
De gemiddelde WOZ-waarde in Noordbroek is in 2025 circa € 313.000.
Het gemiddelde inkomen per inwoner in Noordbroek ligt rond € 28.800 per jaar.
Voor het huidige jaar gaat het om ongeveer 30 geregistreerde misdrijven. Gebruik deze cijfers als indicatie en vergelijk trends per periode.
In Noordbroek komt vooral "Vrijstaande woningen" veel voor, met ongeveer 473 woningen.