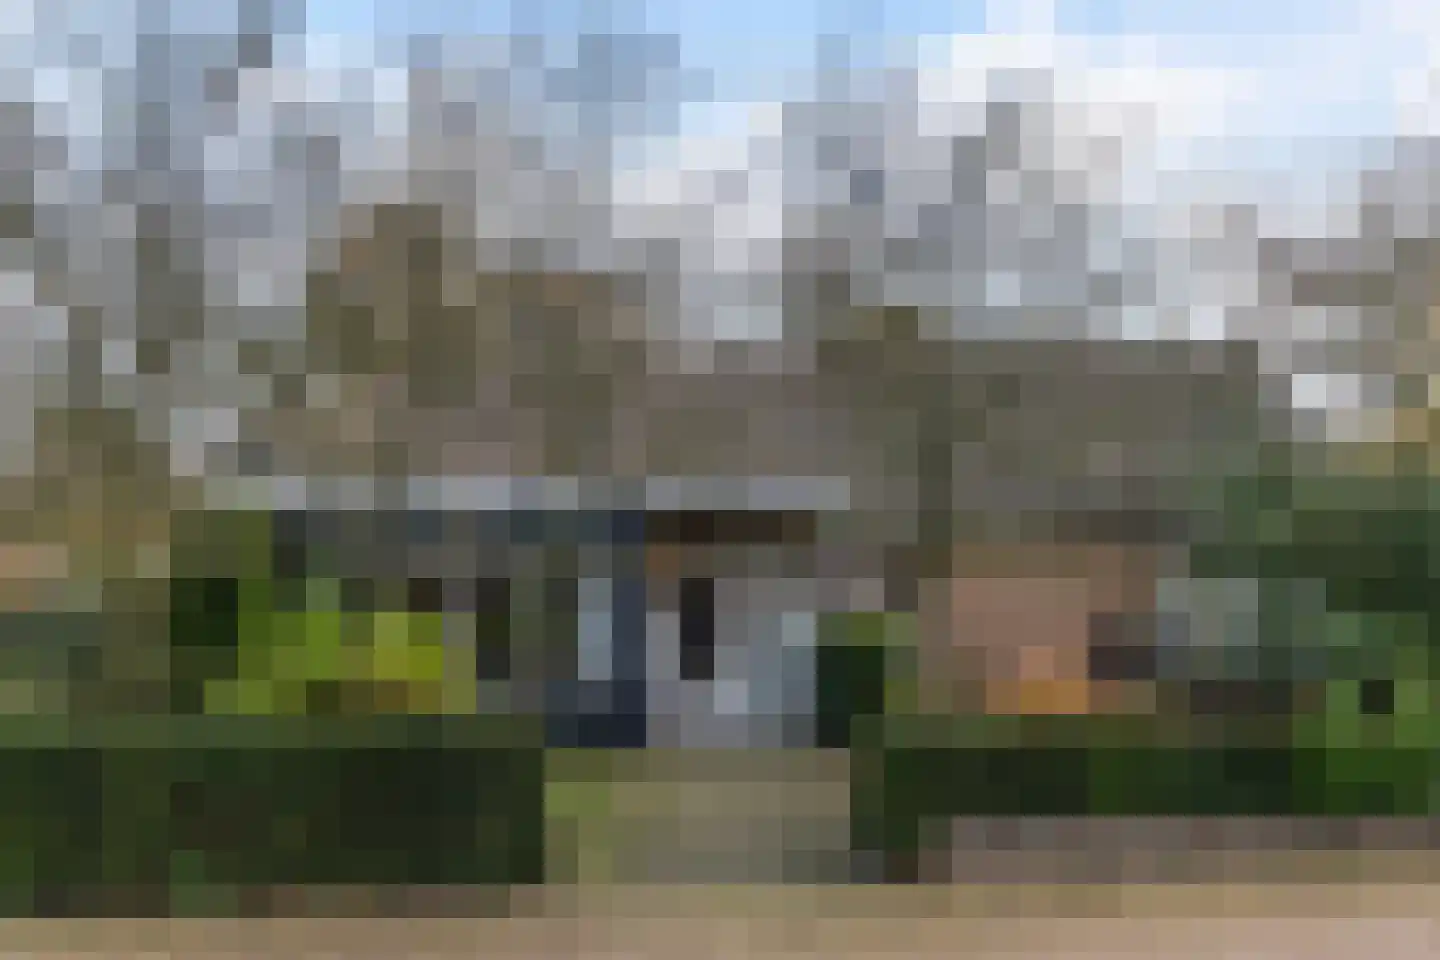
- Sold
Eperweg 9
8071AW Nunspeet
€ 879.000 k.k.
€ 2.949/m²
- Living area
- 298 m²
- Land area
- 454 m²
- Bedrooms
- 7
View 185 sold houses in Nunspeet
Type to search. Use arrow down and arrow up to navigate through results and press Enter to open.
Hidden search suggestions.
Compare sold homes in Nunspeet or view the current offering in this location directly.
On this page you will find recently sold homes in Nunspeet. Use this overview to better estimate selling prices, popular neighborhoods, and the local housing supply before you choose a real estate agent. Also view the current housing supply with 254 houses in Nunspeet.
8071AW Nunspeet
€ 879.000 k.k.
€ 2.949/m²
8071AT Nunspeet
€ 739.000 k.k.
€ 3.605/m²
8071ZA Nunspeet
€ 499.000 k.k.
€ 3.615/m²
8071NM Nunspeet
€ 449.000 k.k.
€ 4.317/m²
8071TJ Nunspeet
€ 350.000 k.k.
€ 4.666/m²
8072JC Nunspeet
€ 379.000 k.k.
€ 3.132/m²
8071BL Nunspeet
€ 719.000 k.k.
€ 4.108/m²
8071VJ Nunspeet
€ 489.000 k.k.
€ 3.326/m²
8071SZ Nunspeet
€ 1.395.000 k.k.
€ 3.321/m²
8072JW Nunspeet
€ 524.500 k.k.
€ 3.746/m²
8071HM Nunspeet
€ 399.000 k.k.
€ 4.694/m²
8072BW Nunspeet
€ 519.000 k.k.
€ 4.474/m²
8072ZA Nunspeet
€ 417.500 k.k.
€ 3.568/m²
8071DE Nunspeet
€ 569.000 k.k.
€ 4.183/m²
8071LT Nunspeet
€ 379.000 k.k.
€ 4.986/m²
8072ZN Nunspeet
€ 459.000 k.k.
€ 3.672/m²
8072CW Nunspeet
€ 399.000 k.k.
€ 4.865/m²
8072GS Nunspeet
€ 429.000 k.k.
€ 3.108/m²
8072AH Nunspeet
€ 389.000 k.k.
€ 3.382/m²
8071MR Nunspeet
€ 619.000 k.k.
€ 4.689/m²
8071TR Nunspeet
€ 500.000 k.k.
€ 3.937/m²
8072GP Nunspeet
€ 399.000 k.k.
€ 3.117/m²
8072AK Nunspeet
€ 395.000 k.k.
€ 3.495/m²
8072WG Nunspeet
€ 260.000 k.k.
€ 3.421/m²
8071MX Nunspeet
€ 775.000 k.k.
€ 4.754/m²
8071NT Nunspeet
€ 499.000 k.k.
€ 4.707/m²
8071TX Nunspeet
€ 850.000 k.k.
€ 5.666/m²
8072AK Nunspeet
€ 385.000 k.k.
€ 3.377/m²
Bekijk recente verkopen en ontvang gratis offertes van lokale makelaars. Vergelijk meer dan 23 makelaars in Nunspeet.
Recent verkocht in Nunspeet? Lees de verkoopgerichte gids huis verkopen in Nunspeet, vergelijk verkoopmakelaars in Nunspeet of bekijk de beste verkoopmakelaars in Nunspeet voor referentie bij jouw keuze.
Makelaars maken scherpere voorstellen als ze weten dat je vergelijkt — vraag offertes aan voor verkoop of aankoop.
Short answers about housing prices, sold homes and comparing real estate agents in Nunspeet.
De kosten van een makelaar in Nunspeet verschillen per kantoor, woningtype en verkoopaanpak. In Nunspeet kun je 23 real estate agents vergelijken; bekijk daarom ook de makelaars in Nunspeet om tarieven, presentatie en lokale ervaring beter naast elkaar te zetten.
On this page we currently show 185 sold houses in Nunspeet from our selection. This helps you to better assess recent transactions and the local housing market.
Houses sold in Nunspeet give insight into asking prices, house types and neighborhoods where recent transactions have taken place. Compare this also with the current housing stock in Nunspeet to better understand the market.
Je kunt verkochte woningen gebruiken als eerste marktindicatie, maar een lokale makelaar kan beter rekening houden met afwerking, ligging, onderhoud en actuele vraag in Nunspeet. Plan de volgende stap via de gids huis verkopen in Nunspeet.
Vergelijk de 23 real estate agents in Nunspeet op lokale verkoopervaring, reviews, verwachte opbrengst, courtage en marketingaanpak. Bekijk verkoopmakelaars in Nunspeet of de top 10 makelaars in Nunspeet om snel sterke kantoren te ontdekken.
View current location data on residents, WOZ development, housing stock, energy consumption, business activity and safety in Nunspeet. In 2026 were there 21.692 residents. The average WOZ value in 2025 is EUR 421.313.
These figures help to better assess and compare the housing stock in Nunspeet with recent sold homes. Orient yourself then on suitable top real estate agents in Nunspeet for sales advice in this region.
Residents
21.692
Last year: 2026
Average WOZ
EUR 421.313
Last year: 2025
Average income per person.
EUR 30.460
Source: AllNumbers
Crimes (current year)
725
Total registered
| Year | Residents |
|---|---|
| 2021 | 20.520 |
| 2022 | 20.640 |
| 2023 | 21.030 |
| 2024 | 21.235 |
| 2025 | 21.505 |
| 2026 | 21.692 |
| Year | Average WOZ |
|---|---|
| 2021 | EUR 296.910 |
| 2022 | EUR 328.274 |
| 2023 | EUR 371.395 |
| 2024 | EUR 398.051 |
| 2025 | EUR 421.313 |
Hoger
3.620
Praktisch
4.720
Middelbaar
6.810
Europa
790
Nederland
19.200
Buiten Europa
1.525
Label C
2.720
Label A
2.625
Label B
1.428
Label D
757
Label G
478
Label F
427
Label E
364
Label A+++
300
Label A++
252
Label A+
138
Label A++++
23
Label A+++++
6
| Year | Gas (m3) | Electricity (kWh) |
|---|---|---|
| 2020 | 1.275 | 2.928 |
| 2021 | 1.417 | 2.978 |
| 2022 | 1.122 | 2.809 |
| 2023 | 925 | 2.659 |
| 2024 | 896 | 2.751 |
Hoekwoning
Gas: 877 • Electricity: 2.680
Huurwoning
Gas: 742 • Electricity: 2.036
Koopwoning
Gas: 1.045 • Electricity: 3.028
Appartement
Gas: 662 • Electricity: 1.867
Tussenwoning
Gas: 787 • Electricity: 2.349
Vrijstaande woning
Gas: 1.394 • Electricity: 3.623
Twee-onder-één-kap woning
Gas: 1.069 • Electricity: 3.069
Total number of company establishments: 2.730
| Period | Crimes |
|---|---|
| jan 2026 | 45 |
| jul 2025 | 69 |
| jun 2025 | 70 |
| mei 2025 | 39 |
| mrt 2025 | 73 |
| mrt 2026 | 72 |
| nov 2024 | 63 |
| nov 2025 | 70 |
| okt 2024 | 49 |
| okt 2025 | 64 |
| sep 2024 | 60 |
| sep 2025 | 70 |
These figures give an indicative picture of safety trends in the living environment of Nunspeet.
Short answers based on current local statistics, handy for a quick comparison of the living environment.
Nunspeet telt in 2026 ongeveer 21.692 inwoners.
De gemiddelde WOZ-waarde in Nunspeet is in 2025 circa € 421.313.
Het gemiddelde inkomen per inwoner in Nunspeet ligt rond € 30.460 per jaar.
Voor het huidige jaar gaat het om ongeveer 725 geregistreerde misdrijven. Gebruik deze cijfers als indicatie en vergelijk trends per periode.
In Nunspeet komt vooral "Tussenwoningen" veel voor, met ongeveer 2.729 woningen.