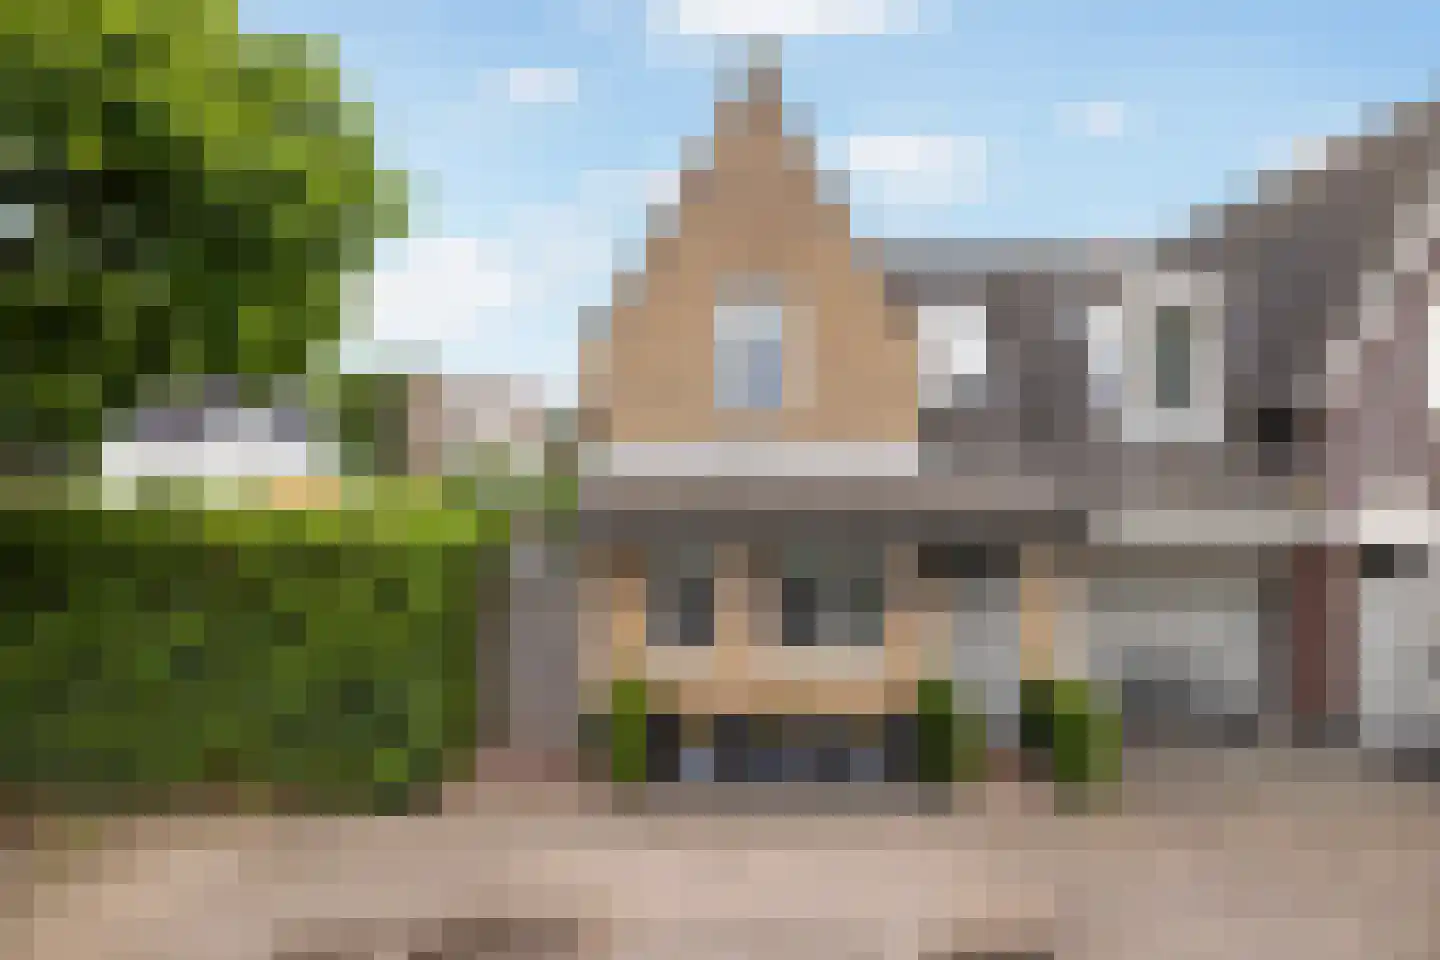
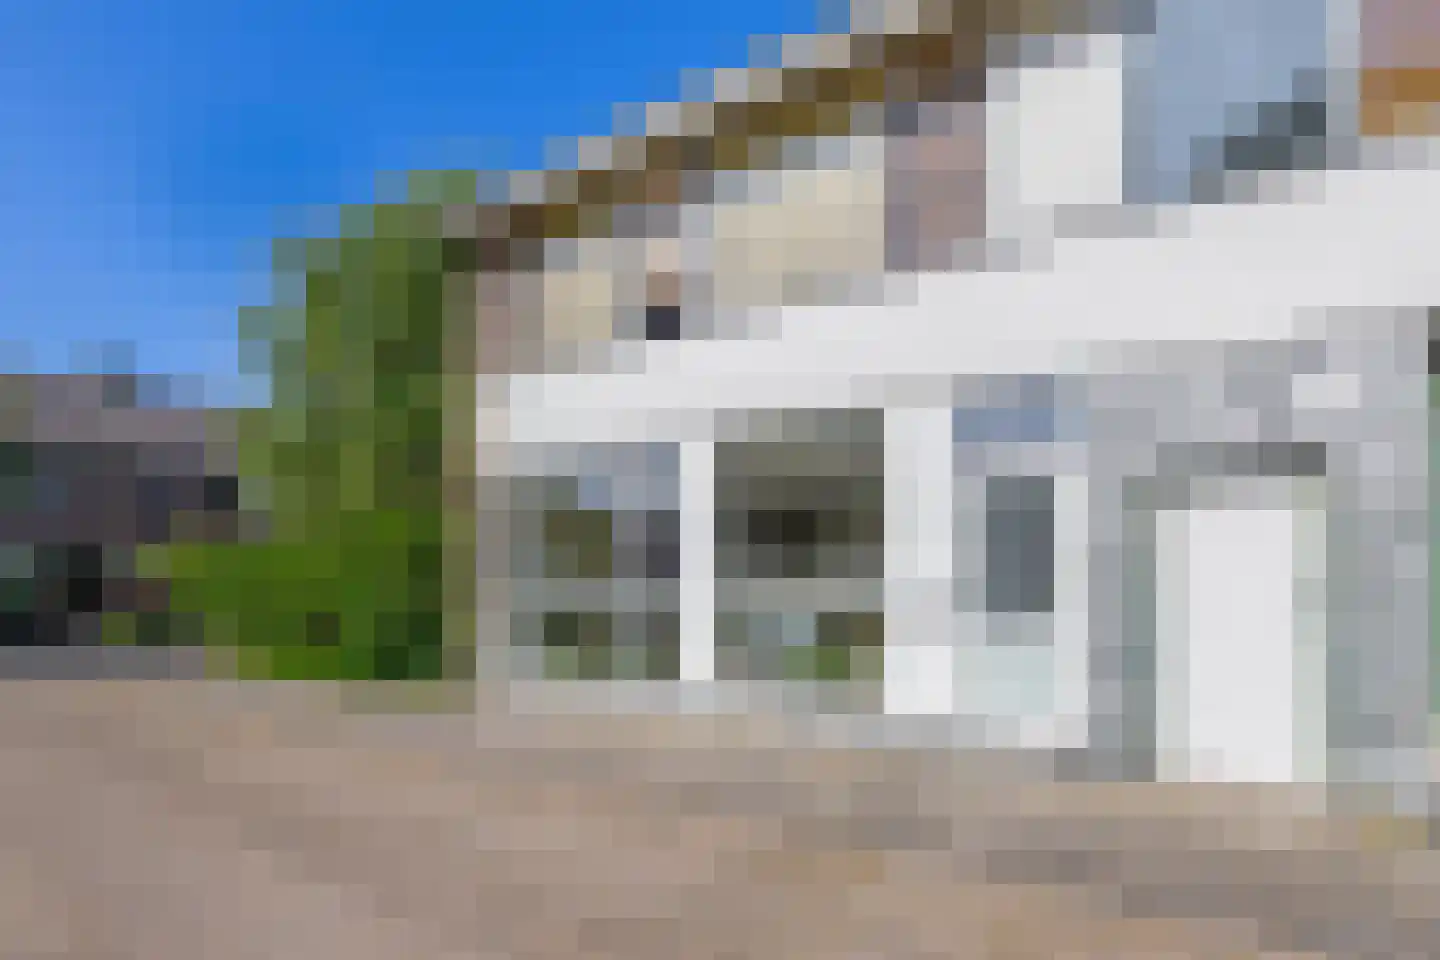
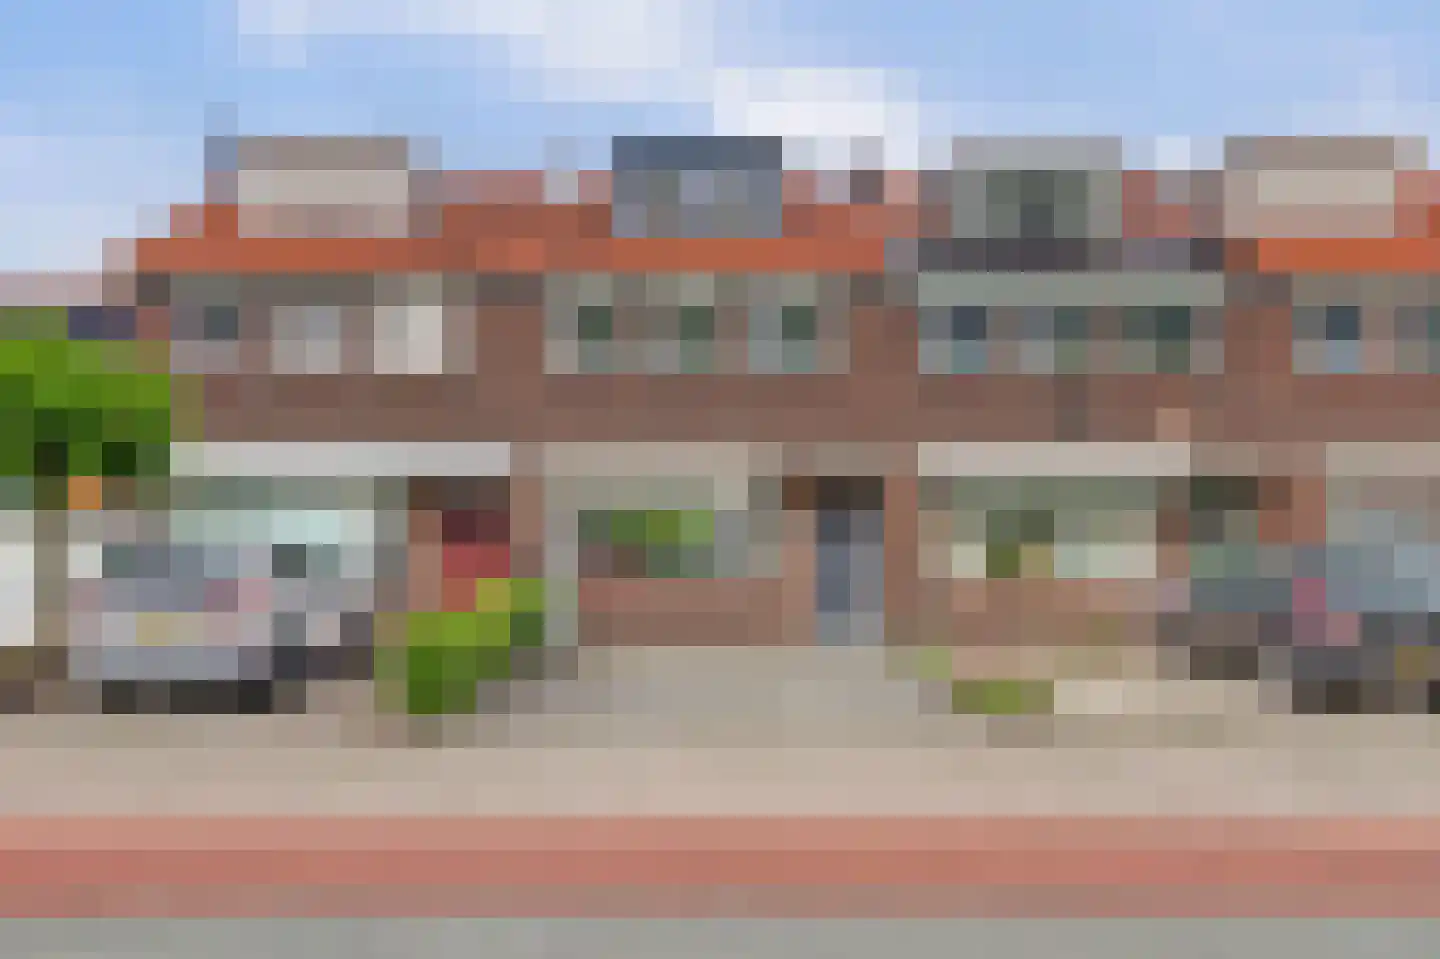
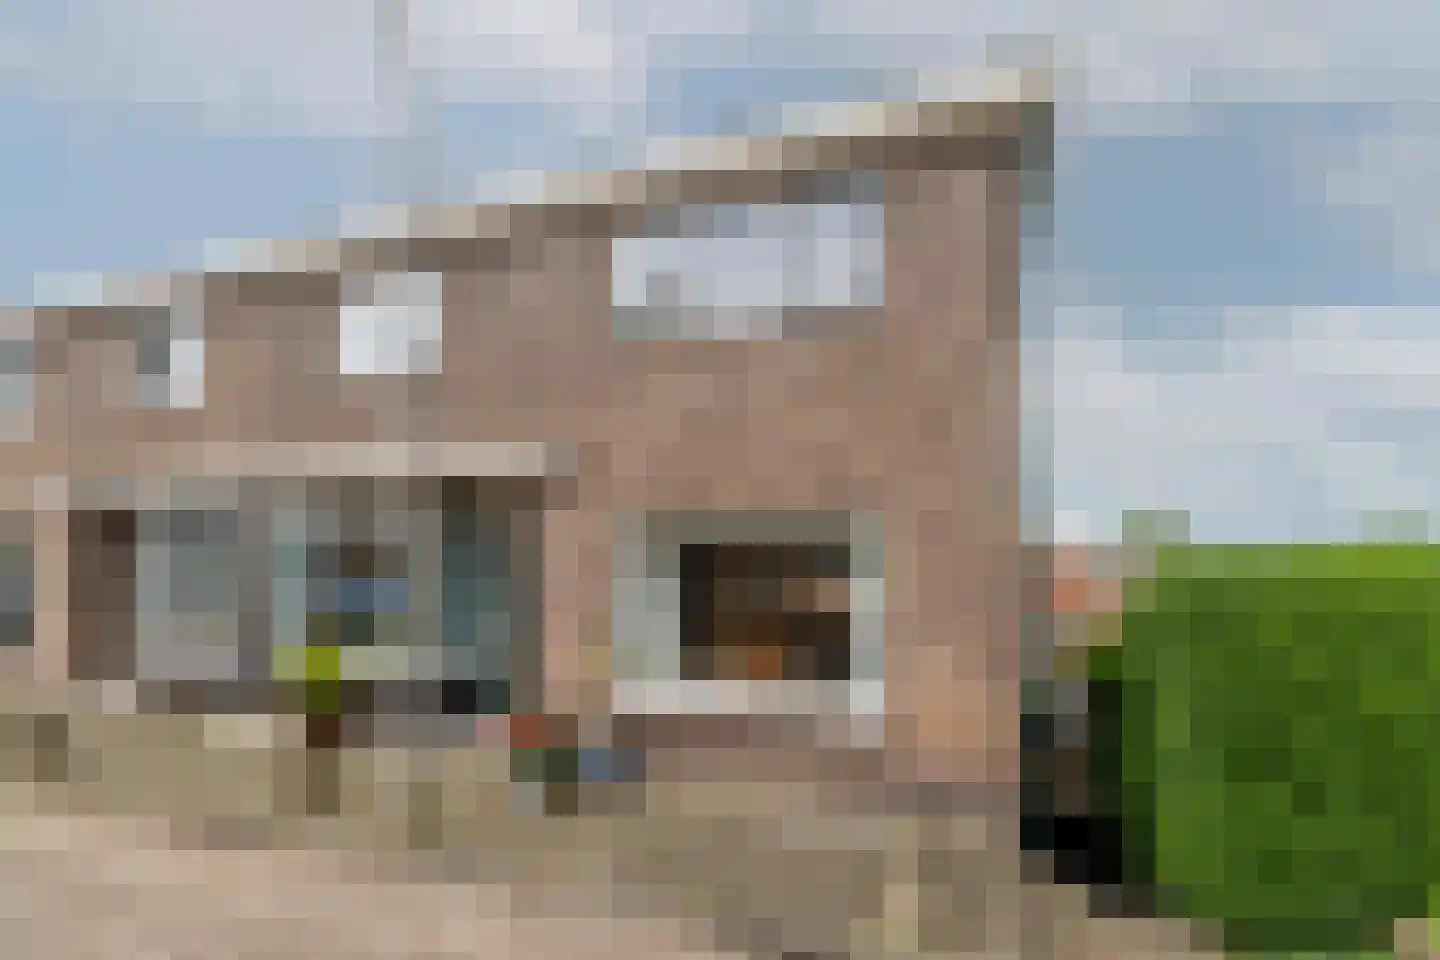
- Available
Markstraat 8
2987TD Ridderkerk
€ 389.000 k.k.
€ 3.325/m²
- Living area
- 117 m²
- Land area
- 140 m²
- Bedrooms
- 4
Searching in 561 houses in Ridderkerk
Type to search. Use arrow down and arrow up to navigate through results and press Enter to open.
Hidden search suggestions.
View current properties in Ridderkerk or search targeted on street, postal code and property characteristics.
View the current housing stock in Ridderkerk and quickly filter by price, living area, rooms and more. There are currently 561 houses in this place within our selection. View also 409 sold houses in Ridderkerk for extra insight into the local housing market.
2987TD Ridderkerk
€ 389.000 k.k.
€ 3.325/m²
2981CP Ridderkerk
€ 300.000 k.k.
€ 4.000/m²
2981BD Ridderkerk
€ 1.100.000 k.k.
€ 3.833/m²
2988BJ Ridderkerk
€ 519.000 k.k.
€ 5.521/m²
2983HD Ridderkerk
€ 375.000 k.k.
€ 5.068/m²
2989AC Ridderkerk
€ 368.800 k.k.
€ 4.191/m²
2985AR Ridderkerk
€ 580.000 k.k.
€ 5.421/m²
2983SN Ridderkerk
€ 475.000 k.k.
€ 4.358/m²
2987VK Ridderkerk
€ 425.000 k.k.
€ 4.942/m²
2985BL Ridderkerk
€ 375.000 k.k.
€ 3.713/m²
2987XS Ridderkerk
€ 435.000 k.k.
€ 3.991/m²
2982XJ Ridderkerk
€ 500.000 k.k.
€ 2.959/m²
2984XH Ridderkerk
€ 495.000 k.k.
€ 4.853/m²
2982BE Ridderkerk
€ 325.000 k.k.
€ 4.851/m²
2983EH Ridderkerk
€ 300.000 k.k.
€ 4.839/m²
2986CP Ridderkerk
€ 397.500 k.k.
€ 3.715/m²
2988BP Ridderkerk
€ 450.000 k.k.
€ 3.285/m²
2982SJ Ridderkerk
€ 300.000 k.k.
€ 4.688/m²
2981AM Ridderkerk
€ 395.000 k.k.
€ 3.911/m²
2983BL Ridderkerk
€ 430.000 k.k.
€ 3.440/m²
2985CN Ridderkerk
€ 418.800 k.k.
€ 3.878/m²
2983GH Ridderkerk
€ 685.000 k.k.
€ 4.448/m²
2982XJ Ridderkerk
€ 550.000 k.k.
€ 3.313/m²
2987AD Ridderkerk
€ 275.000 k.k.
€ 4.297/m²
2984GL Ridderkerk
€ 699.500 k.k.
€ 4.858/m²
2984GC Ridderkerk
€ 525.000 k.k.
€ 4.730/m²
2982RC Ridderkerk
€ 315.000 k.k.
€ 4.565/m²
2983RH Ridderkerk
€ 485.000 k.k.
€ 4.709/m²
Get free quotes from real estate agents with local market knowledge. Compare more than 210 real estate agents in Ridderkerk.
Selling a home in Ridderkerk? View the sales-oriented guide sell a house in Ridderkerk, compare all real estate agents in Ridderkerk or view the top 10 real estate agents in Ridderkerk for extra context to your choice.
Real estate agents make sharper offers when they know you're comparing — ask for quotes for sale or purchase.
Practical answers about housing supply, sales and comparing real estate agents in Ridderkerk.
The costs of a real estate agent in Ridderkerk depend on commission, setup costs, property presentation and the chosen service. Compare the 210 real estate agents in Ridderkerk via the real estate agent page and request multiple quotes to compare rates and approach well.
Within our selection, we are currently showing 561 houses in Ridderkerk. View also the sold houses in Ridderkerk to compare the current offering with recent transactions.
Take into account not only price and living area but also maintenance, energy label, location, outdoor space and sales status. This way you compare houses in Ridderkerk on more than just the asking price.
A local real estate agent knows the neighborhoods, recent transactions and demand in Ridderkerk. By comparing 210 real estate agents in the region you get a better insight into prices, sales strategy and expected yield; the top 10 in Ridderkerk provides a useful starting point.
Yes, when making a sales plan, a valuation in Ridderkerk is wise. You gain insight into a realistic asking price and can then compare offers from real estate agents specifically.
View current location data on residents, WOZ development, housing stock, energy consumption, business activity and safety in Ridderkerk. In 2026 were there 48.070 residents. The average WOZ value in 2025 is EUR 346.000.
These figures help to better assess and compare the housing stock in Ridderkerk with recent sold homes. Orient yourself then on suitable top real estate agents in Ridderkerk for sales advice in this region.
Residents
48.070
Last year: 2026
Average WOZ
EUR 346.000
Last year: 2025
Average income per person.
EUR 32.800
Source: AllNumbers
Crimes (current year)
1.807
Total registered
| Year | Residents |
|---|---|
| 2022 | 47.099 |
| 2023 | 47.477 |
| 2024 | 47.721 |
| 2025 | 47.999 |
| 2026 | 48.070 |
| Year | Average WOZ |
|---|---|
| 2021 | EUR 257.000 |
| 2022 | EUR 285.000 |
| 2023 | EUR 330.000 |
| 2024 | EUR 342.000 |
| 2025 | EUR 346.000 |
Hoger
24
Praktisch
31
Middelbaar
45
Europa
2.917
Nederland
35.759
Buiten Europa
9.323
Label C
6.571
Label A
4.786
Label B
3.788
Label E
2.238
Label D
1.964
Label G
1.137
Label F
1.016
Label A+++
591
Label A+
367
Label A++++
165
Label A++
108
Label A+++++
41
| Year | Gas (m3) | Electricity (kWh) |
|---|---|---|
| 2020 | 1.000 | 2.770 |
| 2021 | 1.140 | 2.820 |
| 2022 | 870 | 2.670 |
| 2023 | 750 | 2.510 |
| 2024 | 740 | 2.550 |
Hoekwoning
Gas: 930 • Electricity: 2.840
Huurwoning
Gas: 650 • Electricity: 2.050
Koopwoning
Gas: 830 • Electricity: 2.860
Appartement
Gas: 560 • Electricity: 2.040
Tussenwoning
Gas: 780 • Electricity: 2.610
Vrijstaande woning
Gas: 1.460 • Electricity: 4.240
Twee-onder-één-kap woning
Gas: 1.020 • Electricity: 3.250
Total number of company establishments: 5.895
| Period | Crimes |
|---|---|
| jan 2025 | 126 |
| jan 2026 | 189 |
| jul 2025 | 187 |
| jun 2025 | 151 |
| mei 2025 | 144 |
| mrt 2025 | 147 |
| nov 2024 | 134 |
| nov 2025 | 176 |
| okt 2024 | 180 |
| okt 2025 | 157 |
| sep 2024 | 149 |
| sep 2025 | 138 |
These figures give an indicative picture of safety trends in the living environment of Ridderkerk.
Short answers based on current local statistics, handy for a quick comparison of the living environment.
Ridderkerk telt in 2026 ongeveer 48.070 inwoners.
De gemiddelde WOZ-waarde in Ridderkerk is in 2025 circa € 346.000.
Het gemiddelde inkomen per inwoner in Ridderkerk ligt rond € 32.800 per jaar.
Voor het huidige jaar gaat het om ongeveer 1.807 geregistreerde misdrijven. Gebruik deze cijfers als indicatie en vergelijk trends per periode.
In Ridderkerk komt vooral "Appartementen" veel voor, met ongeveer 9.916 woningen.