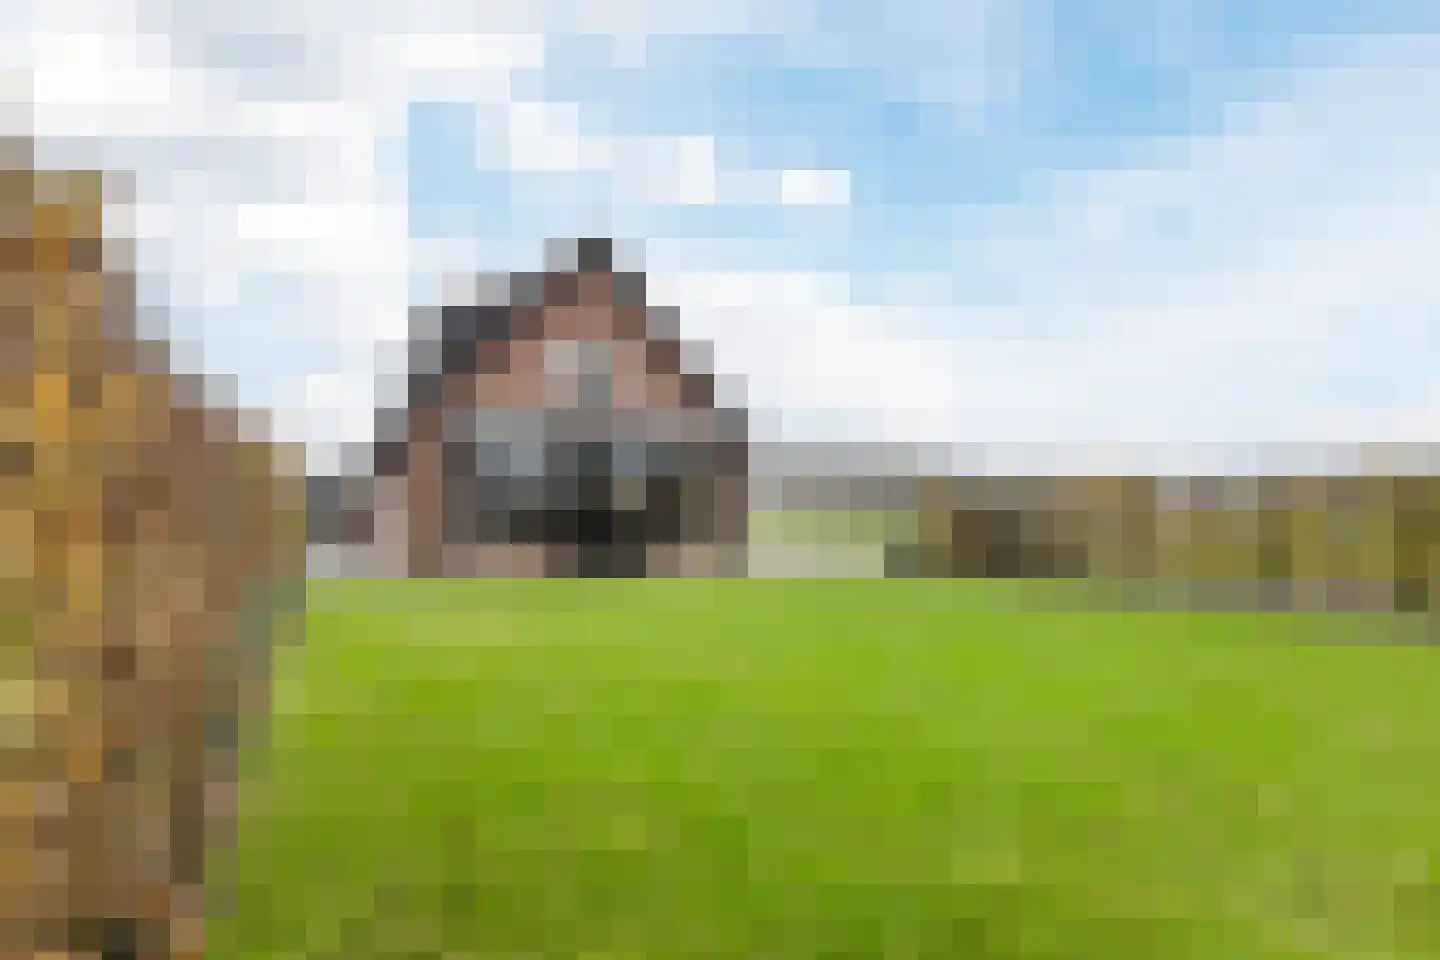
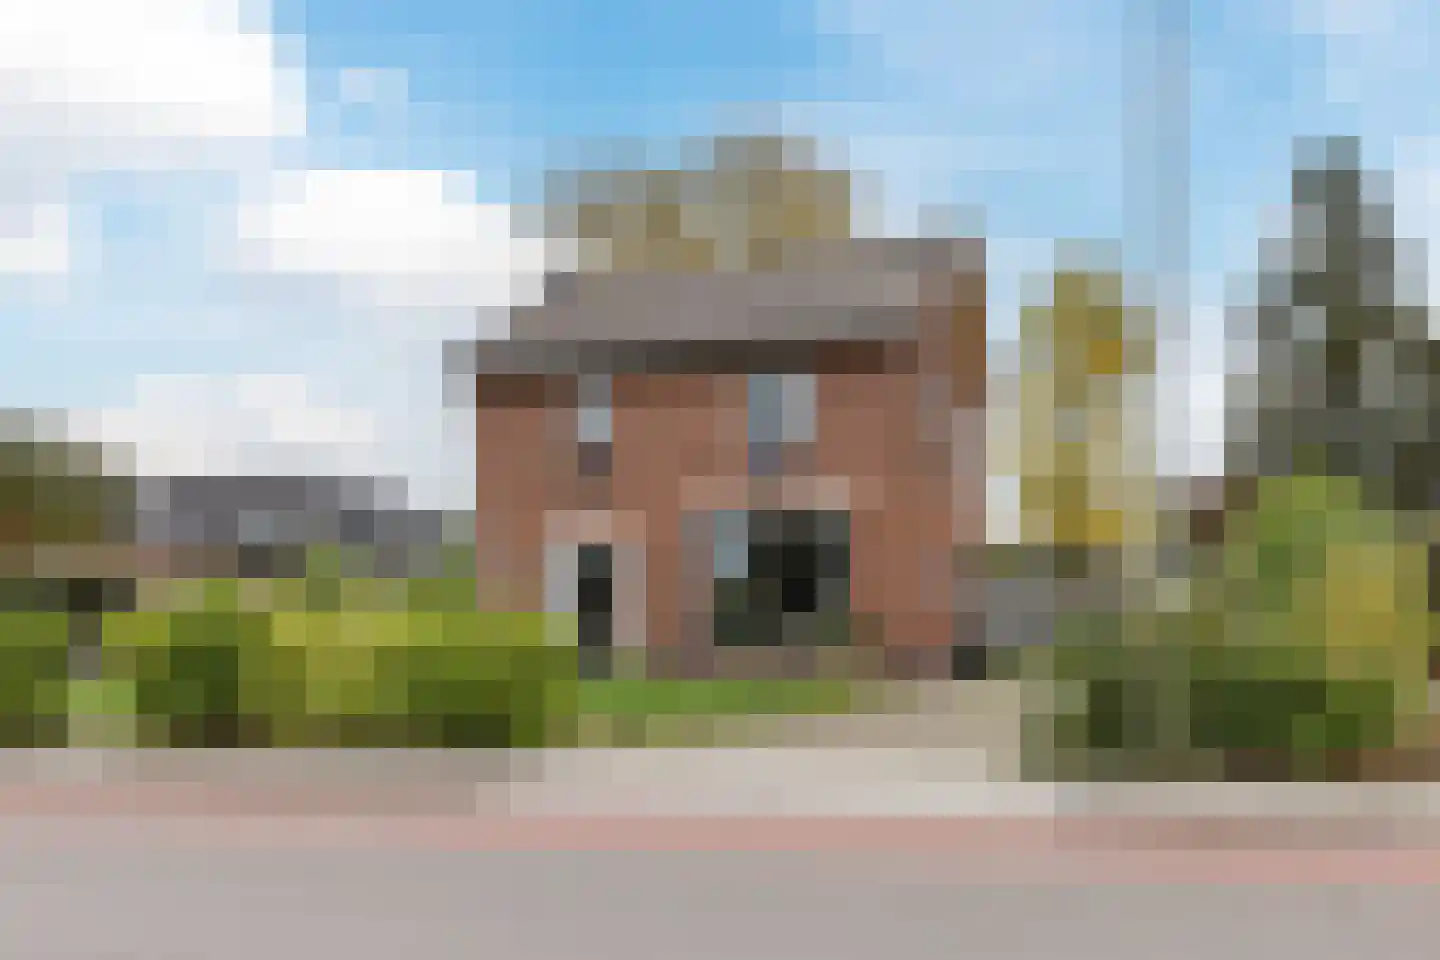
Houses sold in Ruurlo

View 59 sold houses in Ruurlo

Connected to: Vastgoed Nederland NVM Makelaars

On this page you will find recently sold homes in Ruurlo. Use this overview to better estimate selling prices, popular neighborhoods, and the local housing supply before you choose a real estate agent. Also view the current housing supply with 77 houses in Ruurlo.

Selection

Search and filter homes

Set your preferences and discover homes that suit you.

Total supply 242.022
Filters

Set price, area and other characteristics. Adjust a filter or click on Show homes. Location changes directly above.

Reset filters

You search for

  • Place Ruurlo
  • Status Sold

Huis verkopen in Ruurlo? Vergelijk verkoopmakelaars

Bekijk recente verkopen en ontvang gratis offertes van lokale makelaars. Vergelijk meer dan 15 makelaars in Ruurlo.

Free request a quote

  • Quotes in Ruurlo
  • Non-binding
  • Personal
  • Compare free rates

Zelf je woning verkopen in Ruurlo? Vergelijk verkoopmakelaars in Ruurlo of bekijk de beste verkoopmakelaars in Ruurlo als referentie bij jouw keuze.

Vergelijk meerdere offertes

Makelaars maken scherpere voorstellen als ze weten dat je vergelijkt — vraag offertes aan voor verkoop of aankoop.

Frequently asked questions about sold homes in Ruurlo

Short answers about housing prices, sold homes and comparing real estate agents in Ruurlo.

Residential and neighborhood statistics in Ruurlo

View current location data on residents, WOZ development, housing stock, energy consumption, business activity and safety in Ruurlo. In 2026 were there 7.780 residents. The average WOZ value in 2025 is EUR 441.000.

These figures help to better assess and compare the housing stock in Ruurlo with recent sold homes. Orient yourself then on suitable top real estate agents in Ruurlo for sales advice in this region.

Residents

7.780

Last year: 2026

Average WOZ

EUR 441.000

Last year: 2025

Average income per person.

EUR 34.100

Source: AllNumbers

Crimes (current year)

175

Total registered

Demographics and WOZ development

Inhabitants per year

Inhabitants per year in Ruurlo
Year Residents
2021 7.730
2022 7.755
2023 7.775
2024 7.760
2025 7.760
2026 7.780

Annual WOZ value

WOZ value per year in Ruurlo
Year Average WOZ
2021 EUR 308.000
2022 EUR 341.000
2023 EUR 417.000
2024 EUR 426.000
2025 EUR 441.000

Composition of residents

Age build-up

65+: 2.465 0-15: 895 15-25: 815 25-45: 1.315 45-65: 2.300

Education level

Hoger

1.590

Praktisch

1.290

Middelbaar

2.760

Origin of residents (2025)

Europa

265

Nederland

7.210

Buiten Europa

280

Housing stock and construction periods

Types of homes

Hoekwoningen 425
Appartementen 597
Tussenwoningen 600
Vrijstaande woningen 1.153
Twee-onder-één-kap woningen 791

Construction period of buildings

Voor 1700 2
1700 tot 1900 121
1900 tot 1925 254
1925 tot 1950 285
1950 tot 1970 615
1970 tot 1980 481
1980 tot 1990 444
1990 tot 2000 561
2000 tot 2010 517
2010 tot 2020 137
2020 en later 162

Energy and sustainability

Energy label distribution

Label B

874

Label A

845

Label C

663

Label G

396

Label D

336

Label F

135

Label E

94

Label A+++

72

Label A+

65

Label A++

40

Label A++++

4

Label A+++++

2

Average energy consumption per year

Average energy consumption per year in Ruurlo
Year Gas (m3) Electricity (kWh)
2020 1.460 3.160
2021 1.640 3.220
2022 1.280 3.060
2023 1.040 2.940
2024 1.010 2.990

Consumption per house type

Hoekwoning

Gas: 890 • Electricity: 2.360

Huurwoning

Gas: 800 • Electricity: 2.120

Koopwoning

Gas: 1.120 • Electricity: 3.220

Appartement

Gas: 880 • Electricity: 2.440

Tussenwoning

Gas: 840 • Electricity: 2.350

Vrijstaande woning

Gas: 1.300 • Electricity: 3.710

Twee-onder-één-kap woning

Gas: 1.030 • Electricity: 2.980

Business activity in Ruurlo (2025)

Handel en HORECA 185
Nijverheid en energie 110
Zakelijke dienstverlening 245
Overheid, onderwijs en zorg 165
Landbouw, bosbouw en visserij 155
Vervoer, informatie en communicatie 45
Financiele diensten en onroerendgoed 45
Cultuur, recreatie en overige diensten 100

Total number of company establishments: 1.040

Recent crime statistics

Recent crime statistics in Ruurlo
Period Crimes
jan 2026 4
jul 2025 17
jun 2025 24
mei 2025 18
mrt 2025 15
mrt 2026 10
nov 2024 12
nov 2025 5
okt 2024 7
okt 2025 10
sep 2024 10
sep 2025 12

These figures give an indicative picture of safety trends in the living environment of Ruurlo.

Frequently asked questions about living in Ruurlo

Short answers based on current local statistics, handy for a quick comparison of the living environment.

Hoeveel inwoners heeft Ruurlo?

Ruurlo telt in 2026 ongeveer 7.780 inwoners.

Wat is de gemiddelde WOZ-waarde in Ruurlo?

De gemiddelde WOZ-waarde in Ruurlo is in 2025 circa € 441.000.

Wat is het gemiddelde inkomen per inwoner in Ruurlo?

Het gemiddelde inkomen per inwoner in Ruurlo ligt rond € 34.100 per jaar.

Hoe veilig is wonen in Ruurlo?

Voor het huidige jaar gaat het om ongeveer 175 geregistreerde misdrijven. Gebruik deze cijfers als indicatie en vergelijk trends per periode.

Welke woningtypen komen het meest voor in Ruurlo?

In Ruurlo komt vooral "Vrijstaande woningen" veel voor, met ongeveer 1.153 woningen.

Receive free, non-binding quotes

Compare multiple real estate agents and choose the best match.