- Sold
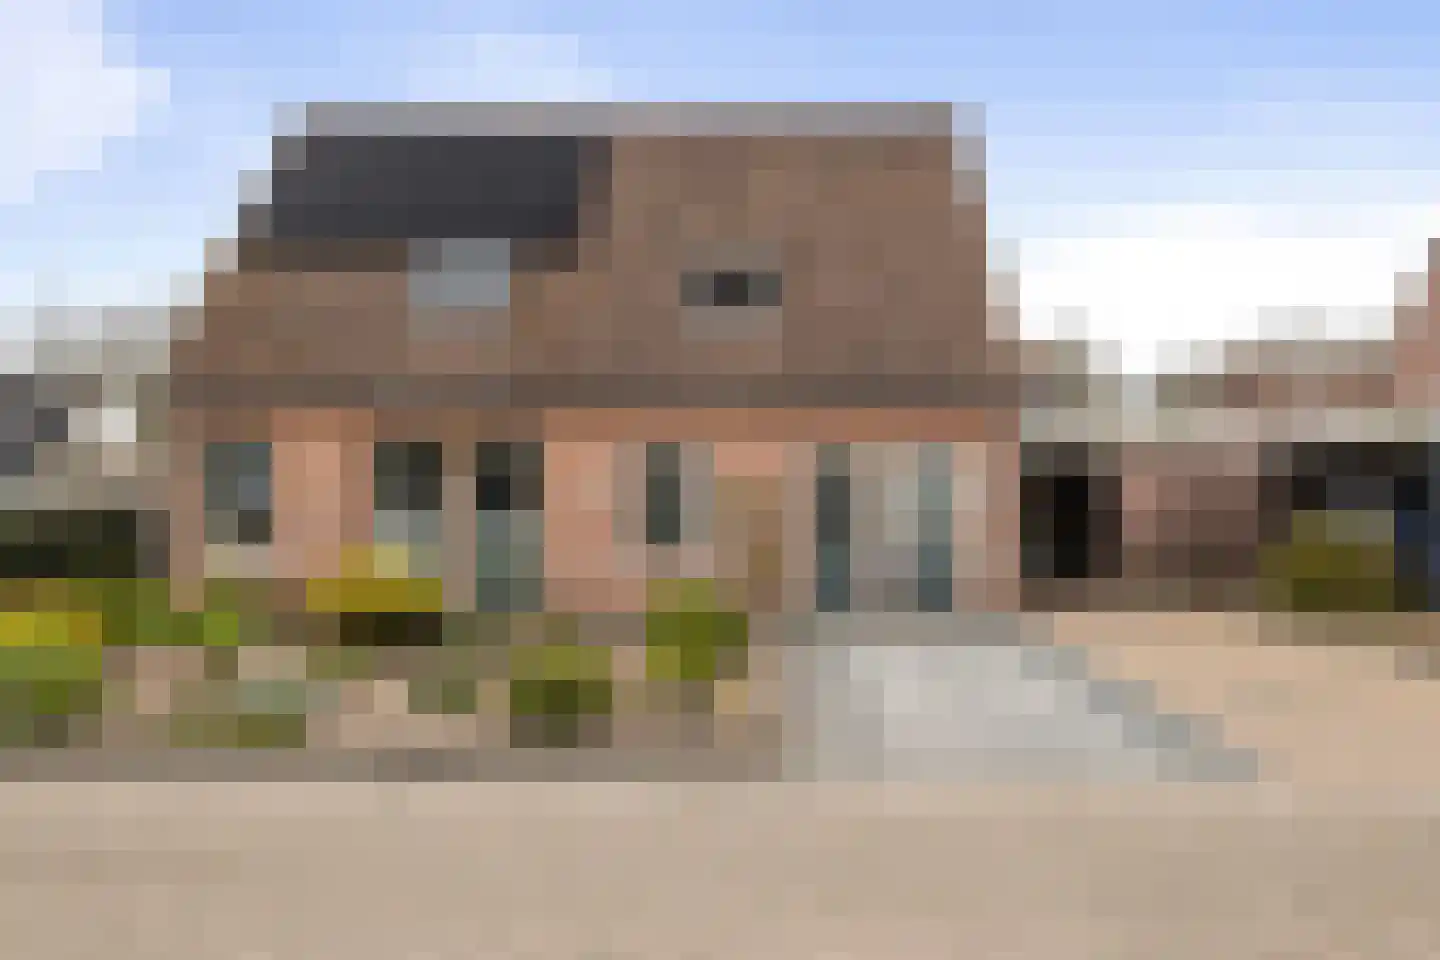
Oosterbroekstraat 26
7841EL Sleen
€ 340.000 k.k.
€ 3.009/m²
- Living area
- 113 m²
- Land area
- 275 m²
- Bedrooms
- 4
View 24 sold houses in Sleen
Type to search. Use arrow down and arrow up to navigate through results and press Enter to open.
Hidden search suggestions.
Compare sold homes in Sleen or view the current offering in this location directly.
On this page you will find recently sold homes in Sleen. Use this overview to better estimate selling prices, popular neighborhoods, and the local housing supply before you choose a real estate agent. Also view the current housing supply with 31 houses in Sleen.
7841EL Sleen
€ 340.000 k.k.
€ 3.009/m²
7841KA Sleen
€ 475.000 k.k.
€ 3.518/m²
7841CK Sleen
€ 445.000 k.k.
€ 2.367/m²
7841AV Sleen
€ 250.000 k.k.
€ 2.272/m²
7841GM Sleen
€ 449.000 k.k.
€ 3.033/m²
7841GR Sleen
€ 425.000 k.k.
€ 2.852/m²
7841AK Sleen
€ 365.000 k.k.
€ 3.578/m²
7841CK Sleen
€ 250.000 k.k.
€ 2.688/m²
7841AL Sleen
€ 395.000 k.k.
€ 2.598/m²
7841GB Sleen
€ 369.000 k.k.
€ 0/m²
7841AM Sleen
€ 395.000 k.k.
€ 2.615/m²
7841CM Sleen
€ 375.000 k.k.
€ 3.177/m²
7841HB Sleen
€ 375.000 k.k.
€ 3.605/m²
7841BG Sleen
€ 385.000 k.k.
€ 2.830/m²
7841AV Sleen
€ 350.000 k.k.
€ 2.713/m²
7841CE Sleen
€ 675.000 k.k.
€ 4.891/m²
7841AR Sleen
€ 250.000 k.k.
€ 2.336/m²
7841AD Sleen
€ 495.000 k.k.
€ 4.057/m²
7841AN Sleen
€ 299.000 k.k.
€ 2.450/m²
7841HC Sleen
€ 795.000 k.k.
€ 4.937/m²
7841CK Sleen
€ 525.000 k.k.
€ 3.220/m²
7841GL Sleen
€ 375.000 k.k.
€ 3.125/m²
7841AM Sleen
€ 385.000 k.k.
€ 2.655/m²
7841GR Sleen
€ 395.000 k.k.
€ 3.590/m²
Bekijk recente verkopen en ontvang gratis offertes van lokale verkoopmakelaars in Sleen.
Recent verkocht in Sleen? Lees de verkoopgerichte gids huis verkopen in Sleen, vergelijk verkoopmakelaars in Sleen of bekijk de beste verkoopmakelaars in Sleen voor referentie bij jouw keuze.
Makelaars maken scherpere voorstellen als ze weten dat je vergelijkt — vraag offertes aan voor verkoop of aankoop.
Short answers about housing prices, sold homes and comparing real estate agents in Sleen.
The costs of a real estate agent in Sleen vary per office, property type and sales approach. Therefore, compare multiple quotes and also look at the real estate agents in Sleen to better compare rates, presentation and local experience.
On this page we currently show 24 sold houses in Sleen from our selection. This helps you to better assess recent transactions and the local housing market.
Houses sold in Sleen give insight into asking prices, house types and neighborhoods where recent transactions have taken place. Compare this also with the current housing stock in Sleen to better understand the market.
Je kunt verkochte woningen gebruiken als eerste marktindicatie, maar een lokale makelaar kan beter rekening houden met afwerking, ligging, onderhoud en actuele vraag in Sleen. Plan de volgende stap via de gids huis verkopen in Sleen.
Vergelijk makelaars in Sleen op lokale verkoopervaring, reviews, verwachte opbrengst, courtage en marketingaanpak. Bekijk verkoopmakelaars in Sleen of de top 10 makelaars in Sleen om snel sterke kantoren te ontdekken.
View current location data on residents, WOZ development, housing stock, energy consumption, business activity and safety in Sleen. In 2026 were there 2.217 residents. The average WOZ value in 2025 is EUR 345.000.
These figures help to better assess and compare the housing stock in Sleen with recent sold homes. Orient yourself then on suitable top real estate agents in Sleen for sales advice in this region.
Residents
2.217
Last year: 2026
Average WOZ
EUR 345.000
Last year: 2025
Average income per person.
EUR 31.100
Source: AllNumbers
Crimes (current year)
38
Total registered
| Year | Residents |
|---|---|
| 2021 | 2.195 |
| 2022 | 2.190 |
| 2023 | 2.205 |
| 2024 | 2.215 |
| 2025 | 2.220 |
| 2026 | 2.217 |
| Year | Average WOZ |
|---|---|
| 2021 | EUR 239.000 |
| 2022 | EUR 272.000 |
| 2023 | EUR 311.000 |
| 2024 | EUR 326.000 |
| 2025 | EUR 345.000 |
Hoger
490
Praktisch
310
Middelbaar
740
Europa
90
Nederland
2.025
Buiten Europa
110
Label C
290
Label A
237
Label B
228
Label D
115
Label F
55
Label G
54
Label E
19
Label A+++
19
Label A++++
18
Label A++
15
Label A+
6
Label A+++++
0
| Year | Gas (m3) | Electricity (kWh) |
|---|---|---|
| 2020 | 1.550 | 2.930 |
| 2021 | 1.720 | 2.970 |
| 2022 | 1.360 | 2.780 |
| 2023 | 1.120 | 2.700 |
| 2024 | 1.040 | 2.900 |
Hoekwoning
Gas: 980 • Electricity: 2.300
Huurwoning
Gas: 880 • Electricity: 1.960
Koopwoning
Gas: 1.200 • Electricity: 2.970
Appartement
Gas: 750 • Electricity: 1.850
Tussenwoning
Gas: 950 • Electricity: 1.840
Vrijstaande woning
Gas: 1.360 • Electricity: 3.350
Twee-onder-één-kap woning
Gas: 980 • Electricity: 2.450
Total number of company establishments: 240
| Period | Crimes |
|---|---|
| jan 2026 | 2 |
| jul 2025 | 3 |
| jun 2025 | 3 |
| mei 2025 | 7 |
| mrt 2025 | 1 |
| mrt 2026 | 2 |
| nov 2024 | 6 |
| nov 2025 | 2 |
| okt 2024 | 4 |
| okt 2025 | 5 |
| sep 2024 | 7 |
| sep 2025 | 1 |
These figures give an indicative picture of safety trends in the living environment of Sleen.
Short answers based on current local statistics, handy for a quick comparison of the living environment.
Sleen telt in 2026 ongeveer 2.217 inwoners.
De gemiddelde WOZ-waarde in Sleen is in 2025 circa € 345.000.
Het gemiddelde inkomen per inwoner in Sleen ligt rond € 31.100 per jaar.
Voor het huidige jaar gaat het om ongeveer 38 geregistreerde misdrijven. Gebruik deze cijfers als indicatie en vergelijk trends per periode.
In Sleen komt vooral "Vrijstaande woningen" veel voor, met ongeveer 430 woningen.