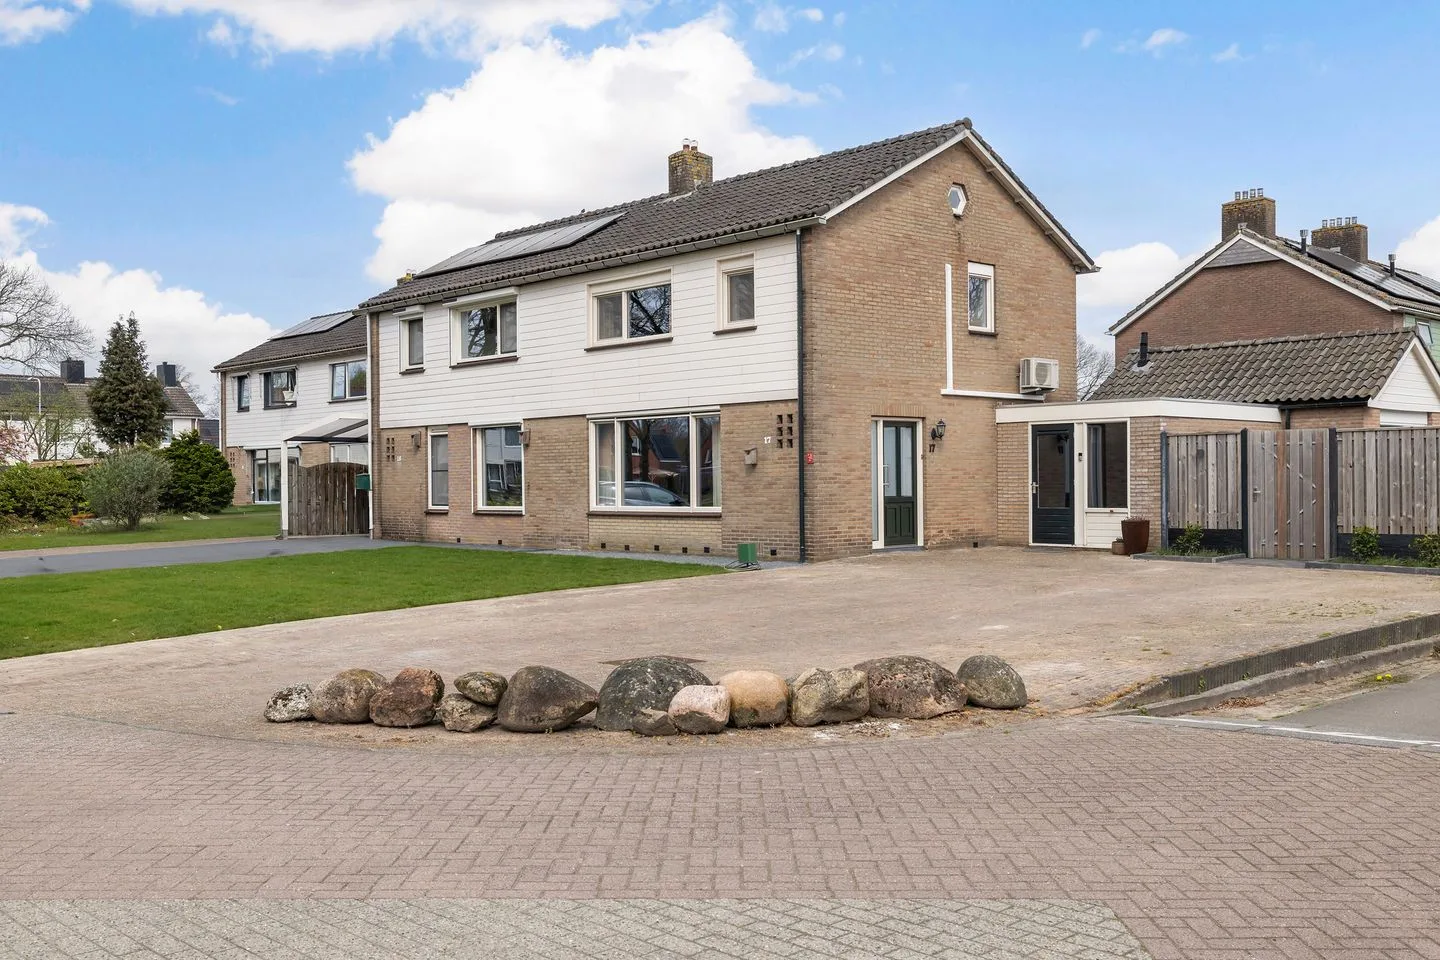
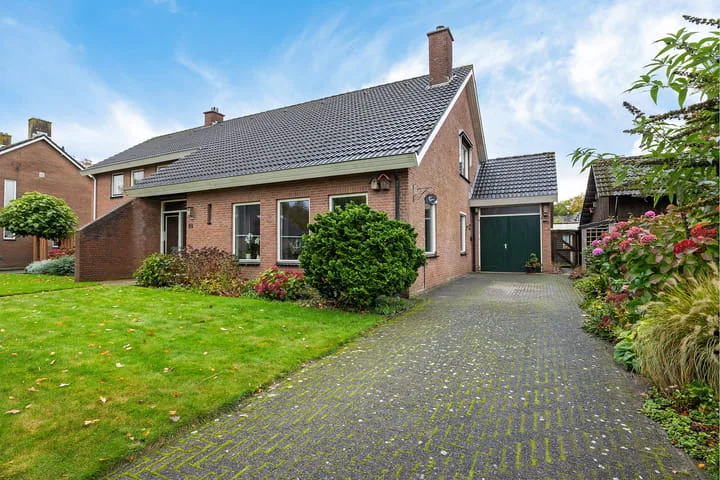
Housing offer in Sleen

Searching in 27 houses in Sleen

Connected to: Vastgoed Nederland NVM Makelaars

View the current housing stock in Sleen and quickly filter by price, living area, rooms and more. There are currently 27 houses in this place within our selection. View also 23 sold houses in Sleen for extra insight into the local housing market.

Selection

Search and filter homes

Set your preferences and discover homes that suit you.

Total supply 242.650
Filters

Set price, area and other characteristics. Adjust a filter or click on Show homes. Location changes directly above.

Reset filters

You search for

  • Place Sleen

Selling a home in Sleen? Compare realtor offers

Get free quotes from real estate agents with local market knowledge. Compare more than 30 real estate agents in Sleen.

Free request a quote

  • Quotes in Sleen
  • Non-binding
  • Personal
  • Compare free rates

Selling a home in Sleen? View the sales-oriented guide sell a house in Sleen, compare all real estate agents in Sleen or view the top 10 real estate agents in Sleen for extra context to your choice.

Compare multiple quotes

Real estate agents make sharper offers when they know you're comparing — ask for quotes for sale or purchase.

Frequently asked questions about homes in Sleen

Practical answers about housing supply, sales and comparing real estate agents in Sleen.

Residential and neighborhood statistics in Sleen

View current location data on residents, WOZ development, housing stock, energy consumption, business activity and safety in Sleen. In 2026 were there 2.217 residents. The average WOZ value in 2025 is EUR 345.000.

These figures help to better assess and compare the housing stock in Sleen with recent sold homes. Orient yourself then on suitable top real estate agents in Sleen for sales advice in this region.

Residents

2.217

Last year: 2026

Average WOZ

EUR 345.000

Last year: 2025

Average income per person.

EUR 31.100

Source: AllNumbers

Crimes (current year)

38

Total registered

Demographics and WOZ development

Inhabitants per year

Inhabitants per year in Sleen
Year Residents
2021 2.195
2022 2.190
2023 2.205
2024 2.215
2025 2.220
2026 2.217

Annual WOZ value

WOZ value per year in Sleen
Year Average WOZ
2021 EUR 239.000
2022 EUR 272.000
2023 EUR 311.000
2024 EUR 326.000
2025 EUR 345.000

Composition of residents

Age build-up

65+: 730 0-15: 305 15-25: 190 25-45: 415 45-65: 580

Education level

Hoger

490

Praktisch

310

Middelbaar

740

Origin of residents (2025)

Europa

90

Nederland

2.025

Buiten Europa

110

Housing stock and construction periods

Types of homes

Hoekwoningen 94
Appartementen 73
Tussenwoningen 92
Vrijstaande woningen 430
Twee-onder-één-kap woningen 377

Construction period of buildings

Voor 1700 0
1700 tot 1900 20
1900 tot 1925 39
1925 tot 1950 67
1950 tot 1970 273
1970 tot 1980 192
1980 tot 1990 128
1990 tot 2000 158
2000 tot 2010 72
2010 tot 2020 64
2020 en later 42

Energy and sustainability

Energy label distribution

Label C

290

Label A

237

Label B

228

Label D

115

Label F

55

Label G

54

Label E

19

Label A+++

19

Label A++++

18

Label A++

15

Label A+

6

Label A+++++

0

Average energy consumption per year

Average energy consumption per year in Sleen
Year Gas (m3) Electricity (kWh)
2020 1.550 2.930
2021 1.720 2.970
2022 1.360 2.780
2023 1.120 2.700
2024 1.040 2.900

Consumption per house type

Hoekwoning

Gas: 980 • Electricity: 2.300

Huurwoning

Gas: 880 • Electricity: 1.960

Koopwoning

Gas: 1.200 • Electricity: 2.970

Appartement

Gas: 750 • Electricity: 1.850

Tussenwoning

Gas: 950 • Electricity: 1.840

Vrijstaande woning

Gas: 1.360 • Electricity: 3.350

Twee-onder-één-kap woning

Gas: 980 • Electricity: 2.450

Business activity in Sleen (2025)

Handel en HORECA 40
Nijverheid en energie 25
Zakelijke dienstverlening 50
Overheid, onderwijs en zorg 50
Landbouw, bosbouw en visserij 10
Vervoer, informatie en communicatie 15
Financiele diensten en onroerendgoed 15
Cultuur, recreatie en overige diensten 40

Total number of company establishments: 240

Recent crime statistics

Recent crime statistics in Sleen
Period Crimes
jan 2026 2
jul 2025 3
jun 2025 3
mei 2025 7
mrt 2025 1
mrt 2026 2
nov 2024 6
nov 2025 2
okt 2024 4
okt 2025 5
sep 2024 7
sep 2025 1

These figures give an indicative picture of safety trends in the living environment of Sleen.

Frequently asked questions about living in Sleen

Short answers based on current local statistics, handy for a quick comparison of the living environment.

Hoeveel inwoners heeft Sleen?

Sleen telt in 2026 ongeveer 2.217 inwoners.

Wat is de gemiddelde WOZ-waarde in Sleen?

De gemiddelde WOZ-waarde in Sleen is in 2025 circa € 345.000.

Wat is het gemiddelde inkomen per inwoner in Sleen?

Het gemiddelde inkomen per inwoner in Sleen ligt rond € 31.100 per jaar.

Hoe veilig is wonen in Sleen?

Voor het huidige jaar gaat het om ongeveer 38 geregistreerde misdrijven. Gebruik deze cijfers als indicatie en vergelijk trends per periode.

Welke woningtypen komen het meest voor in Sleen?

In Sleen komt vooral "Vrijstaande woningen" veel voor, met ongeveer 430 woningen.

Receive free, non-binding quotes

Compare multiple real estate agents and choose the best match.