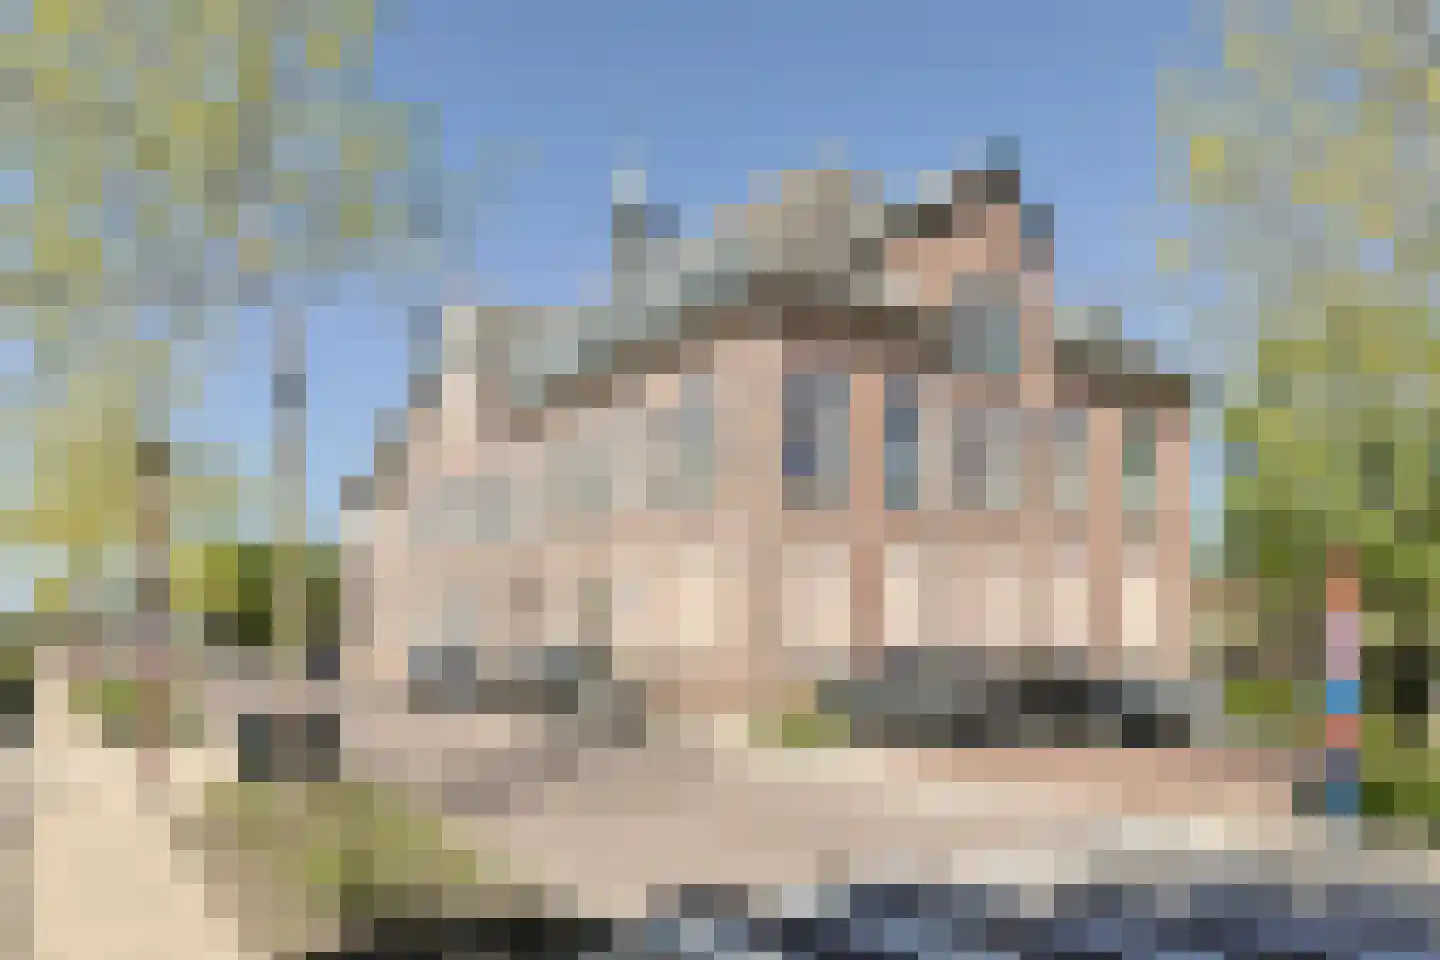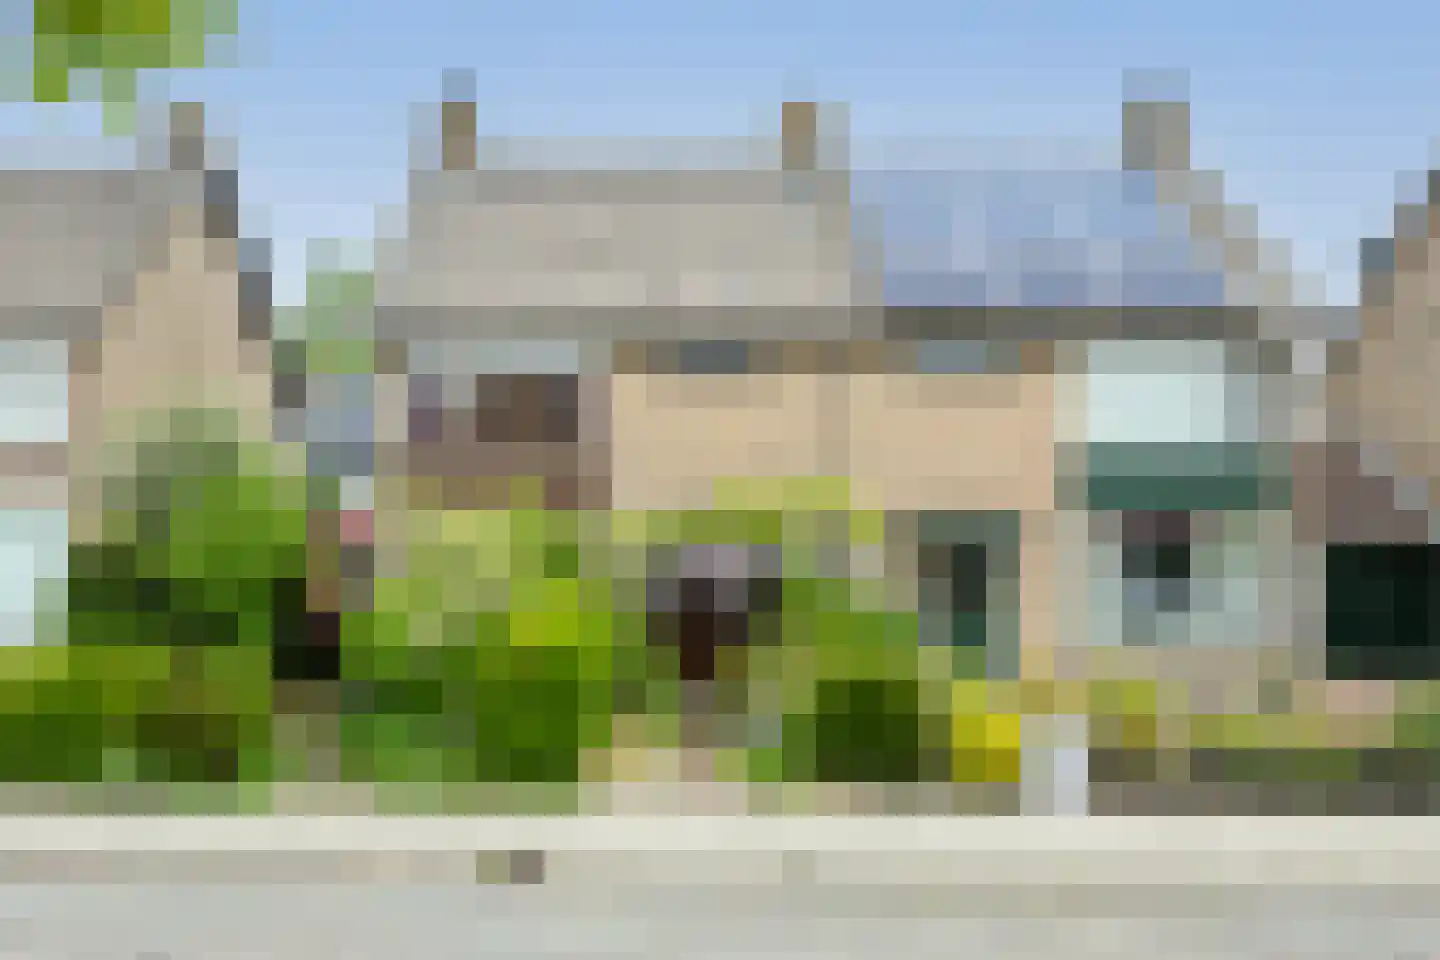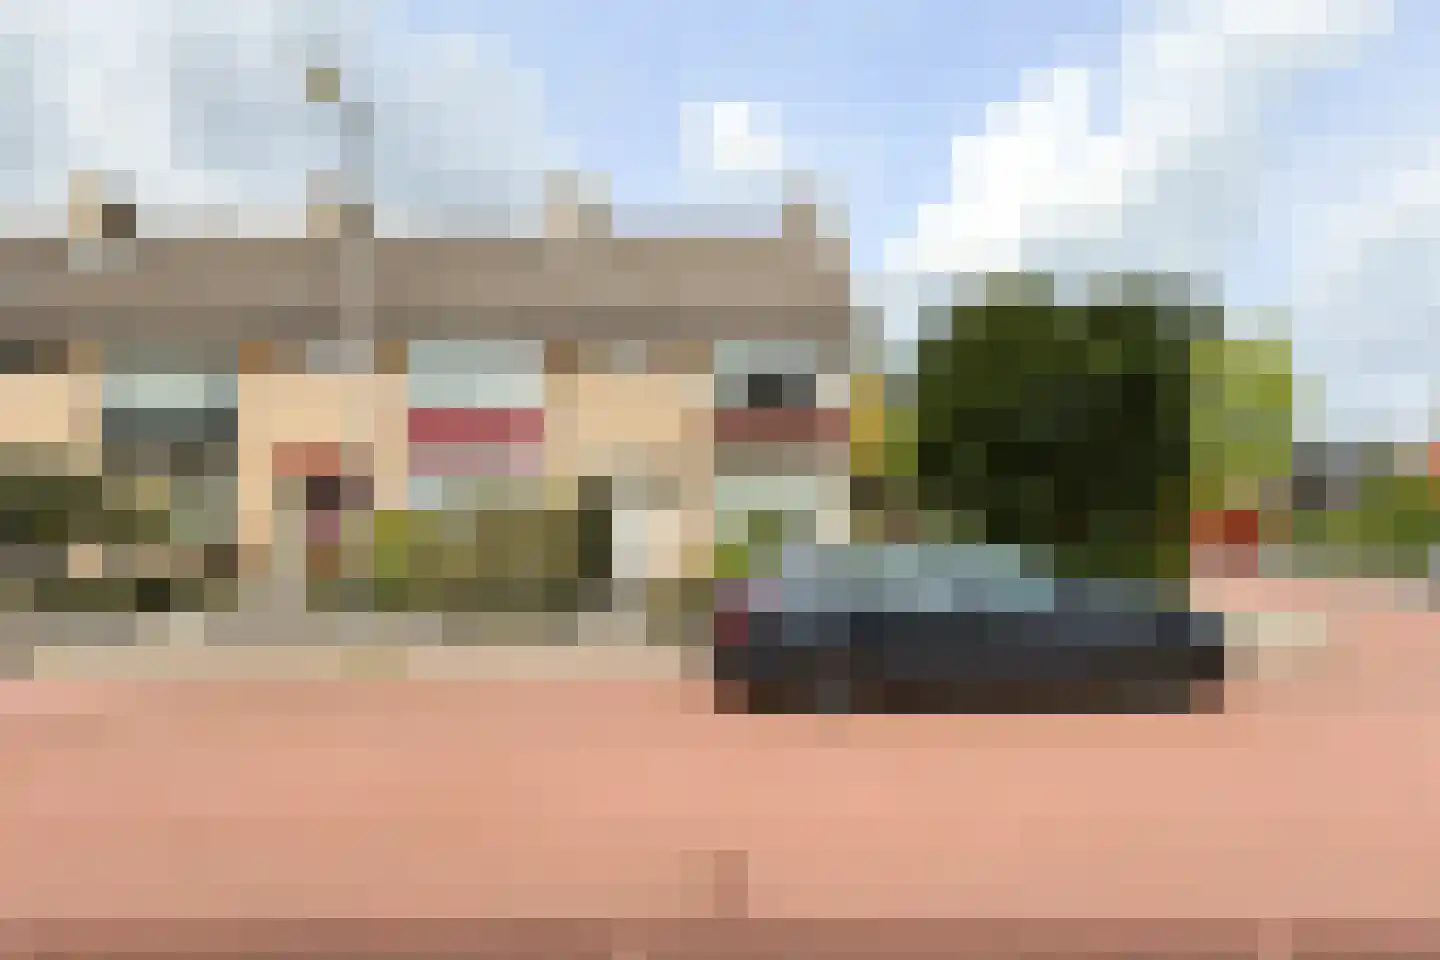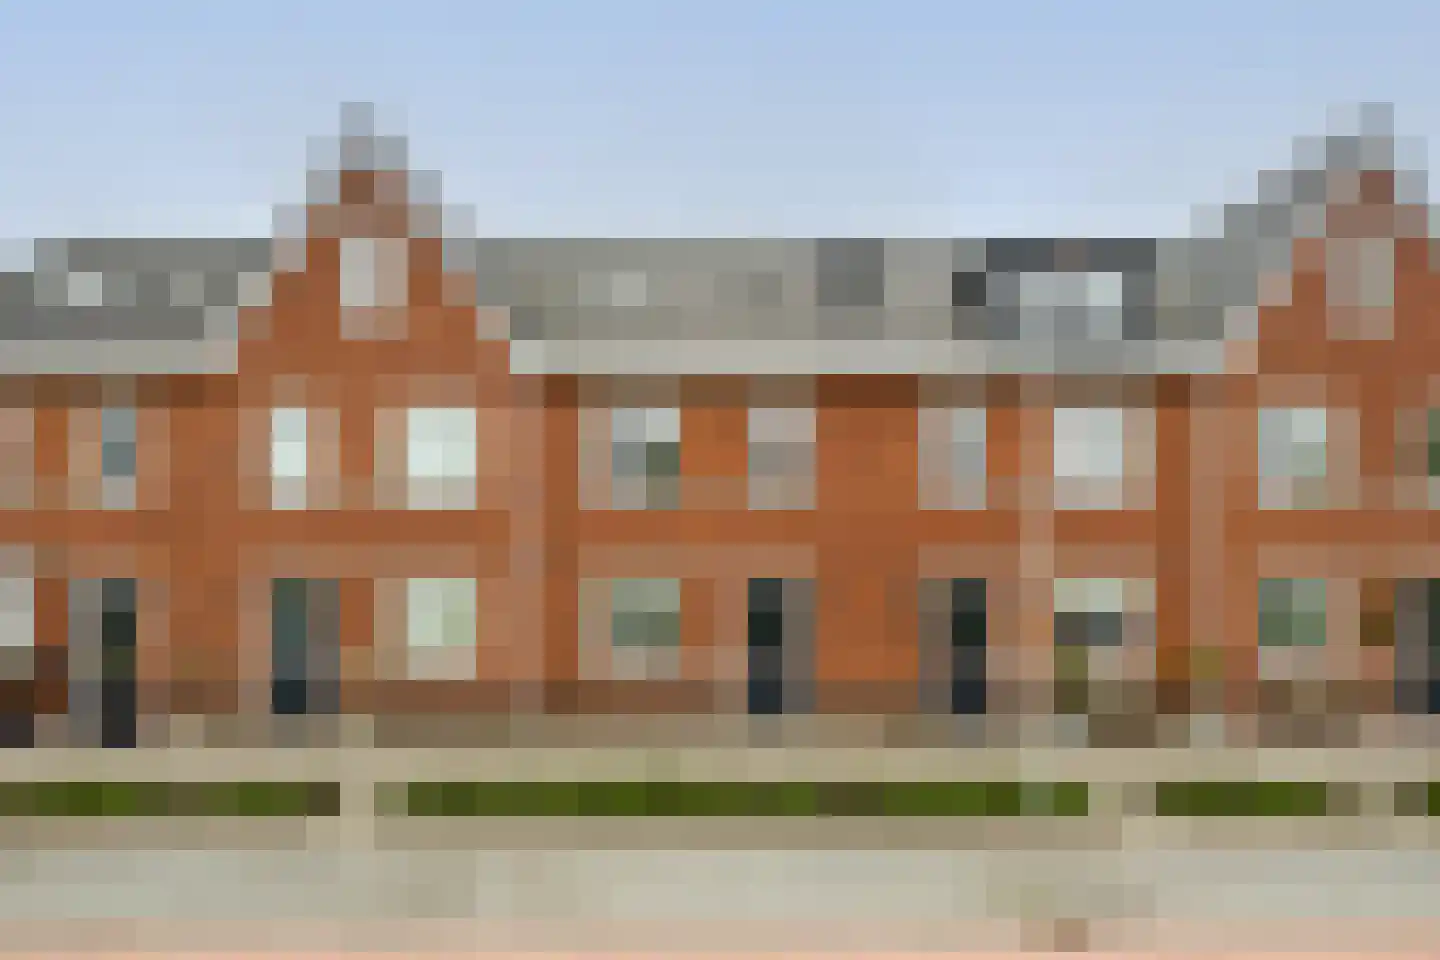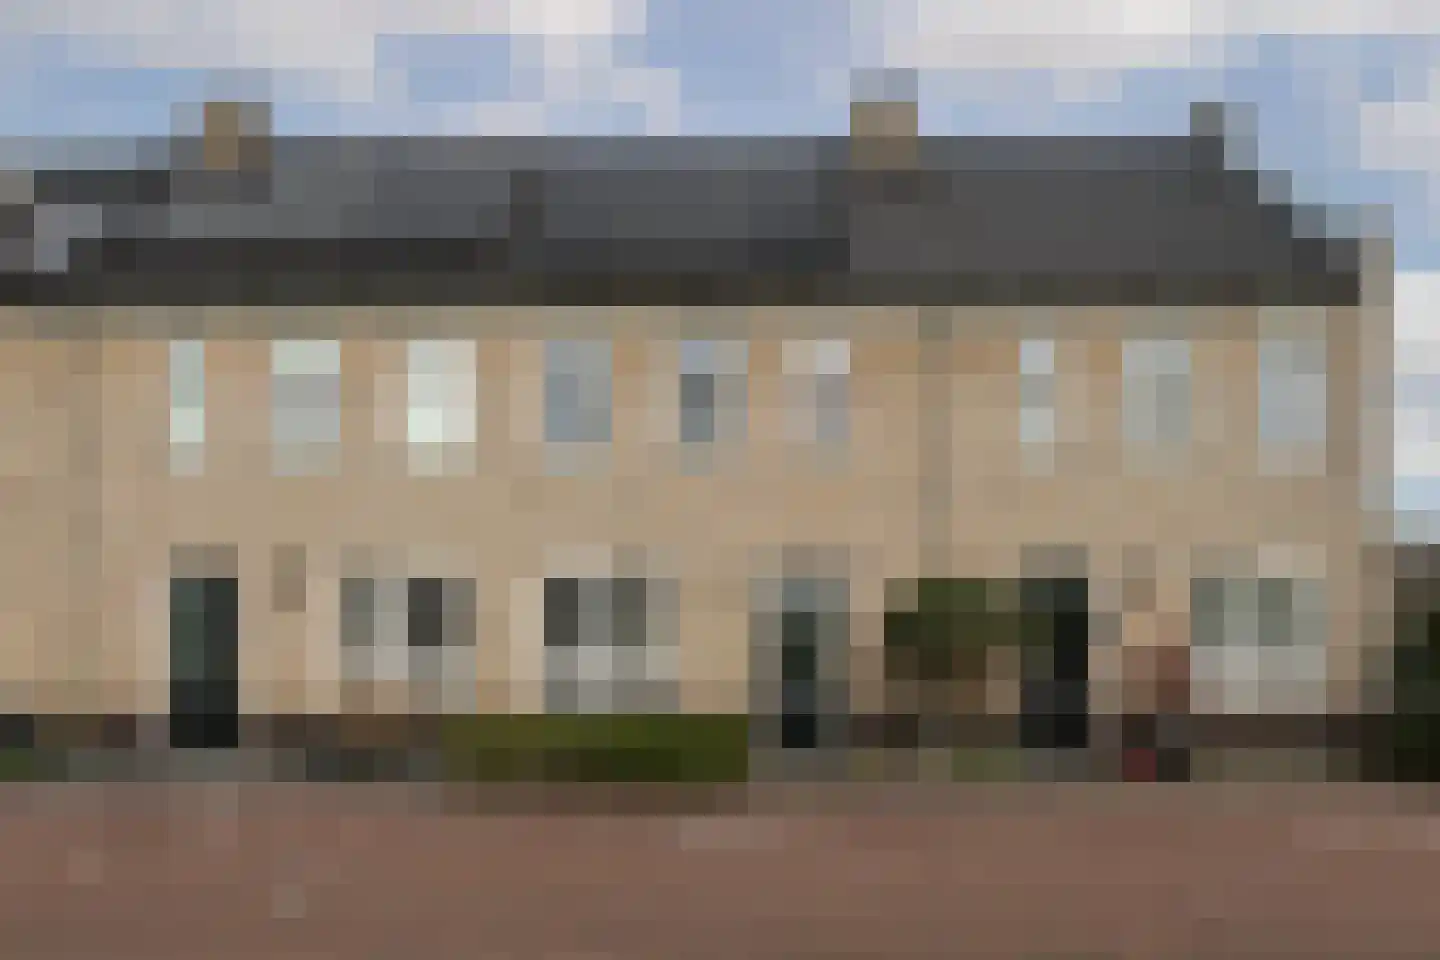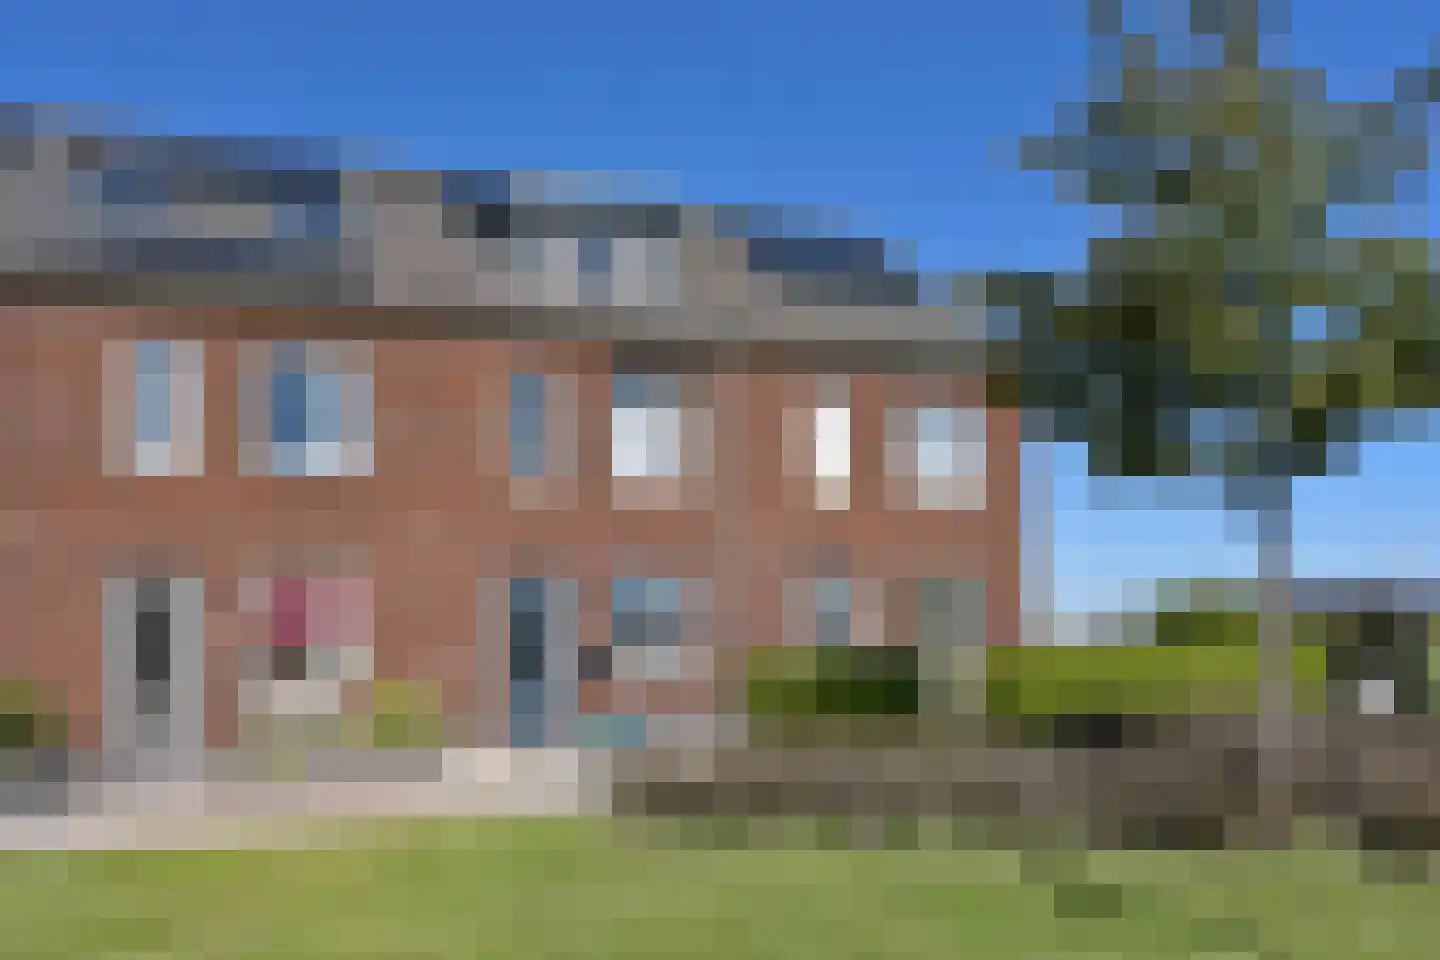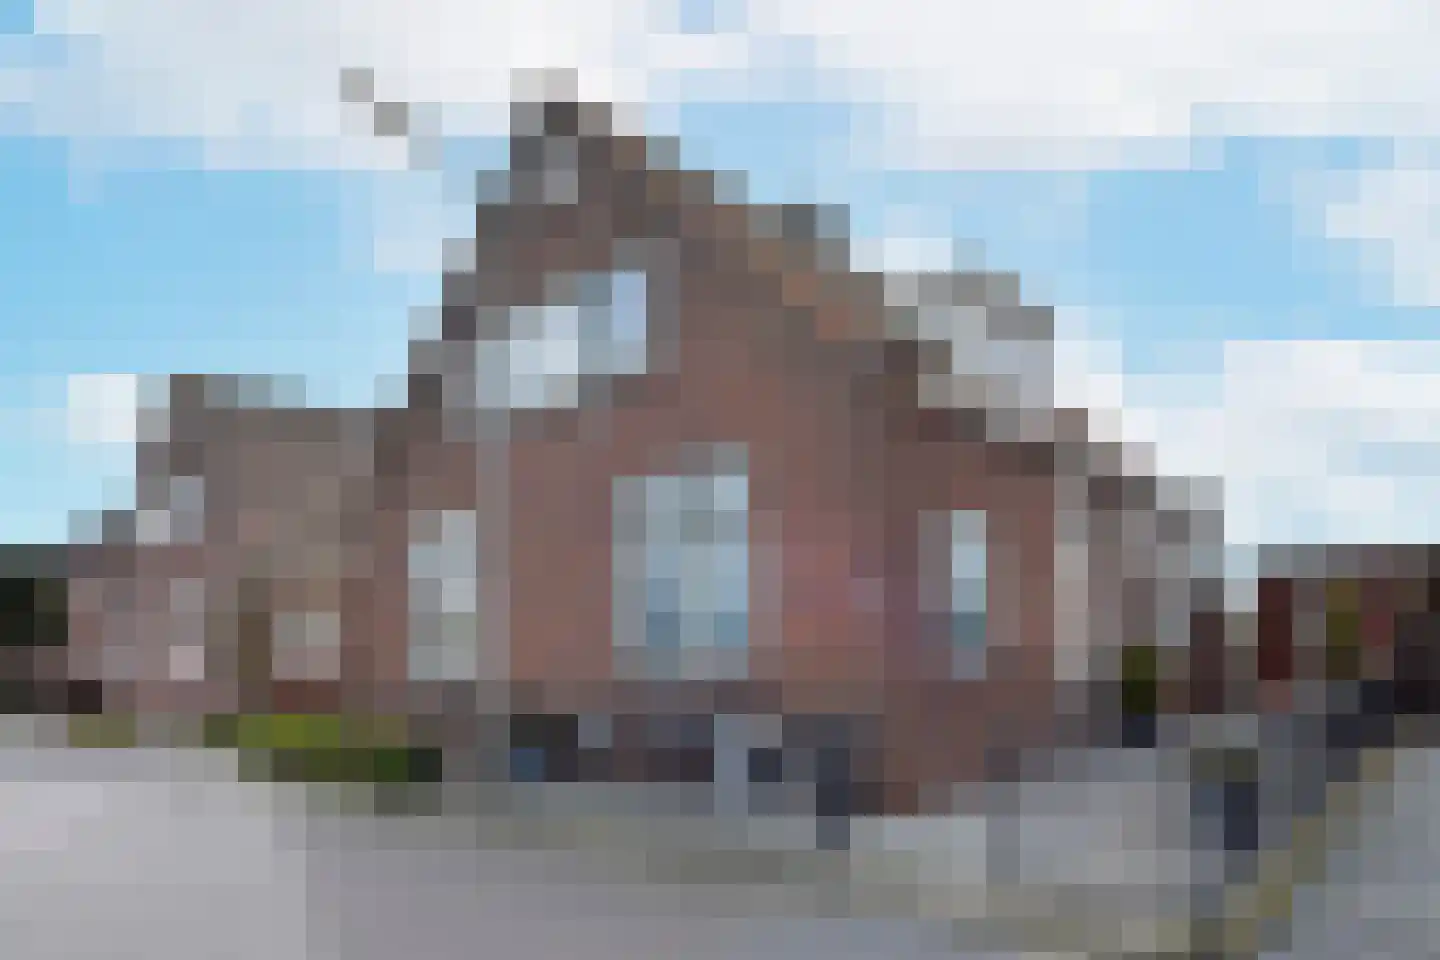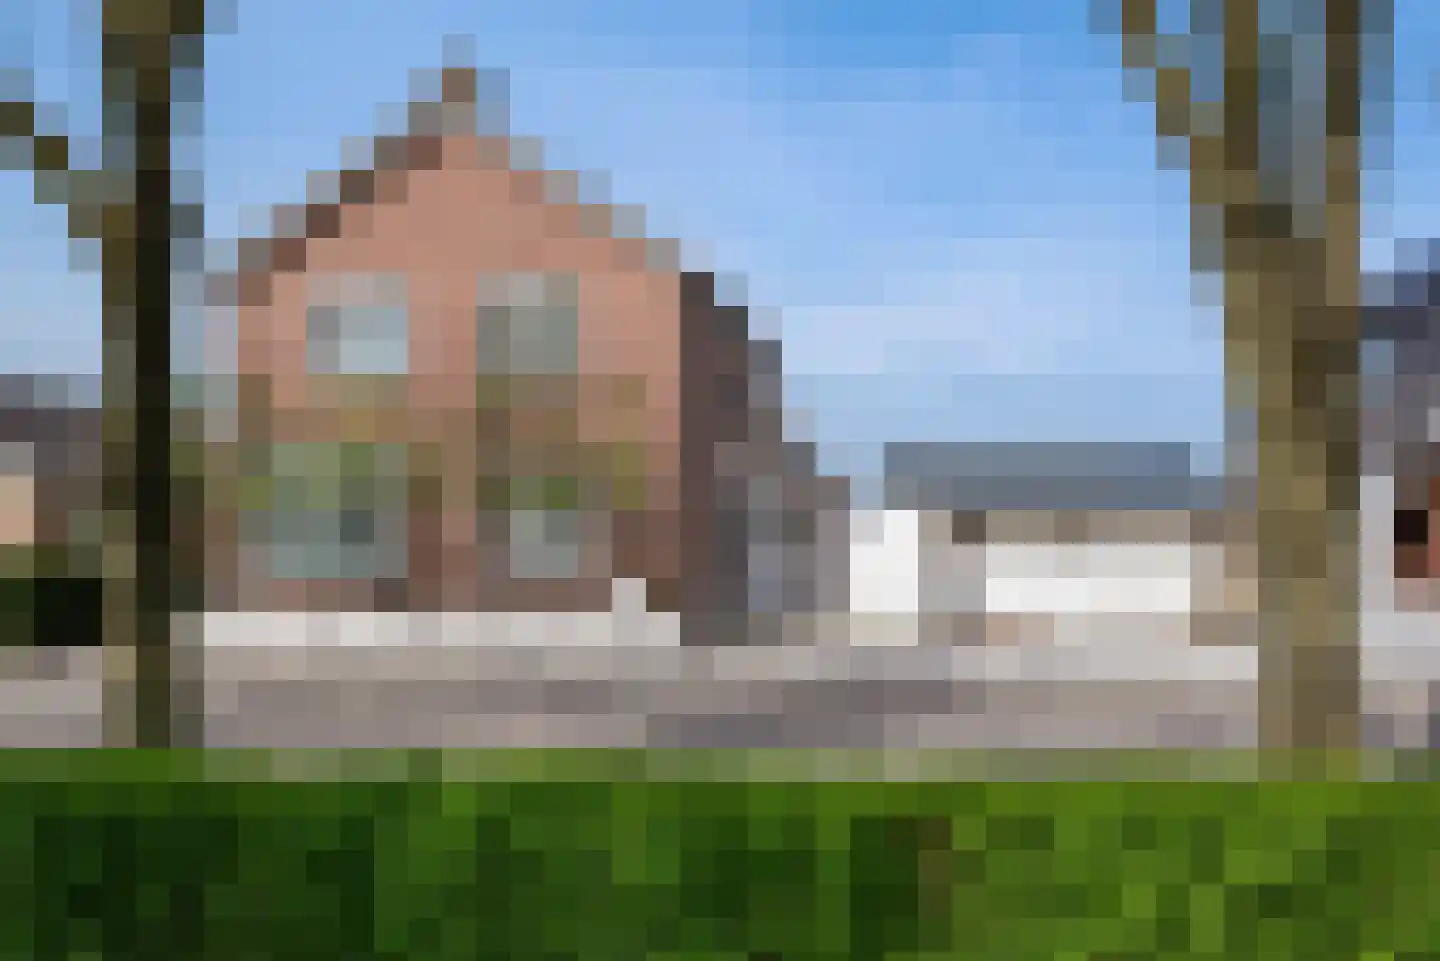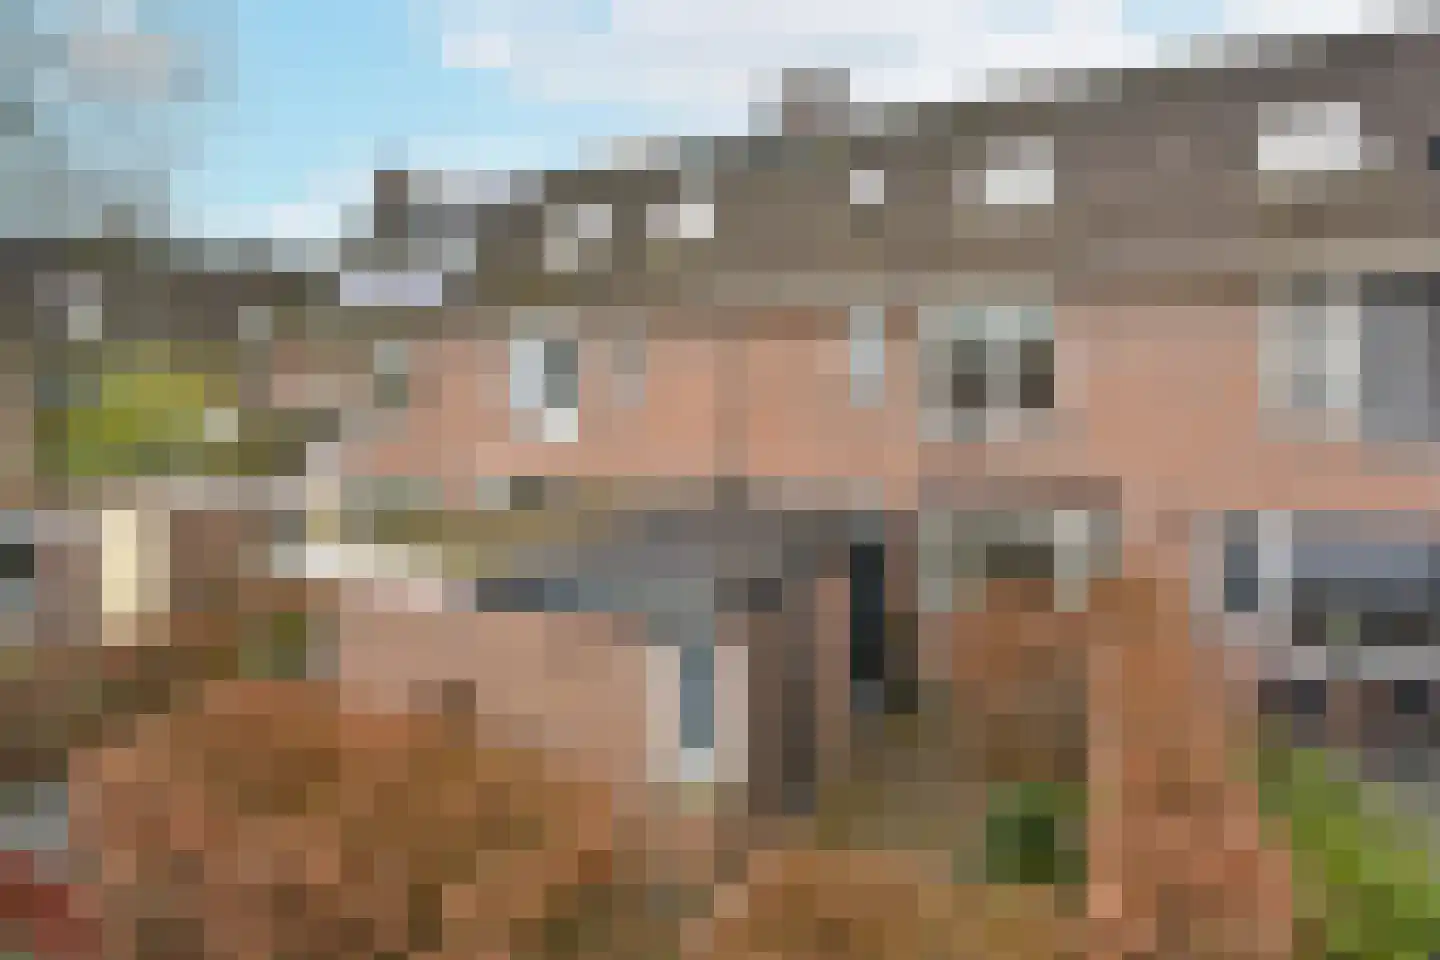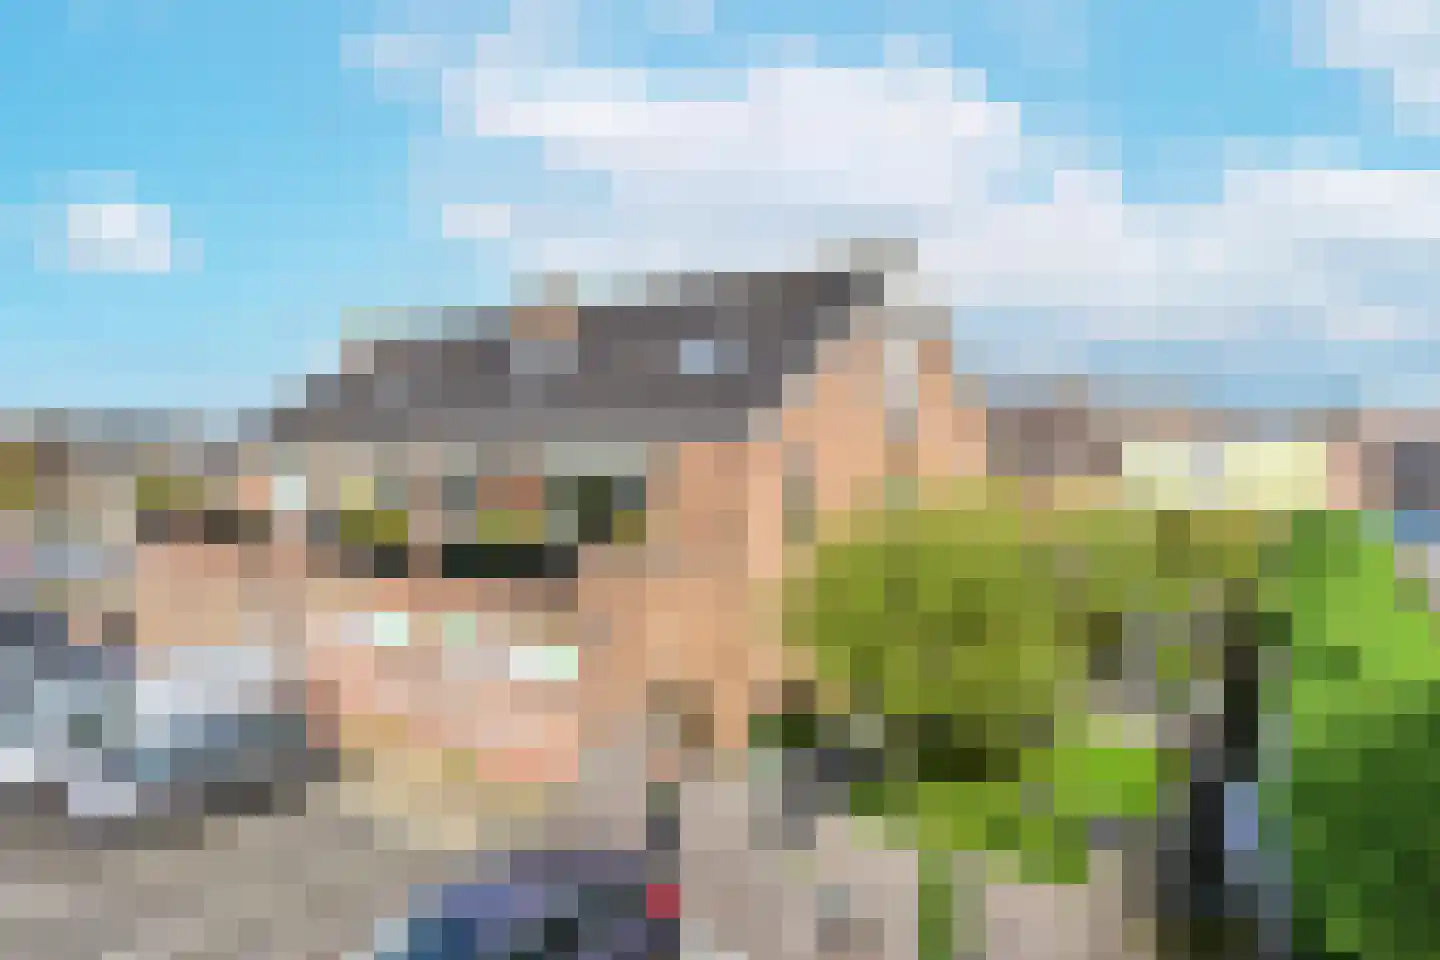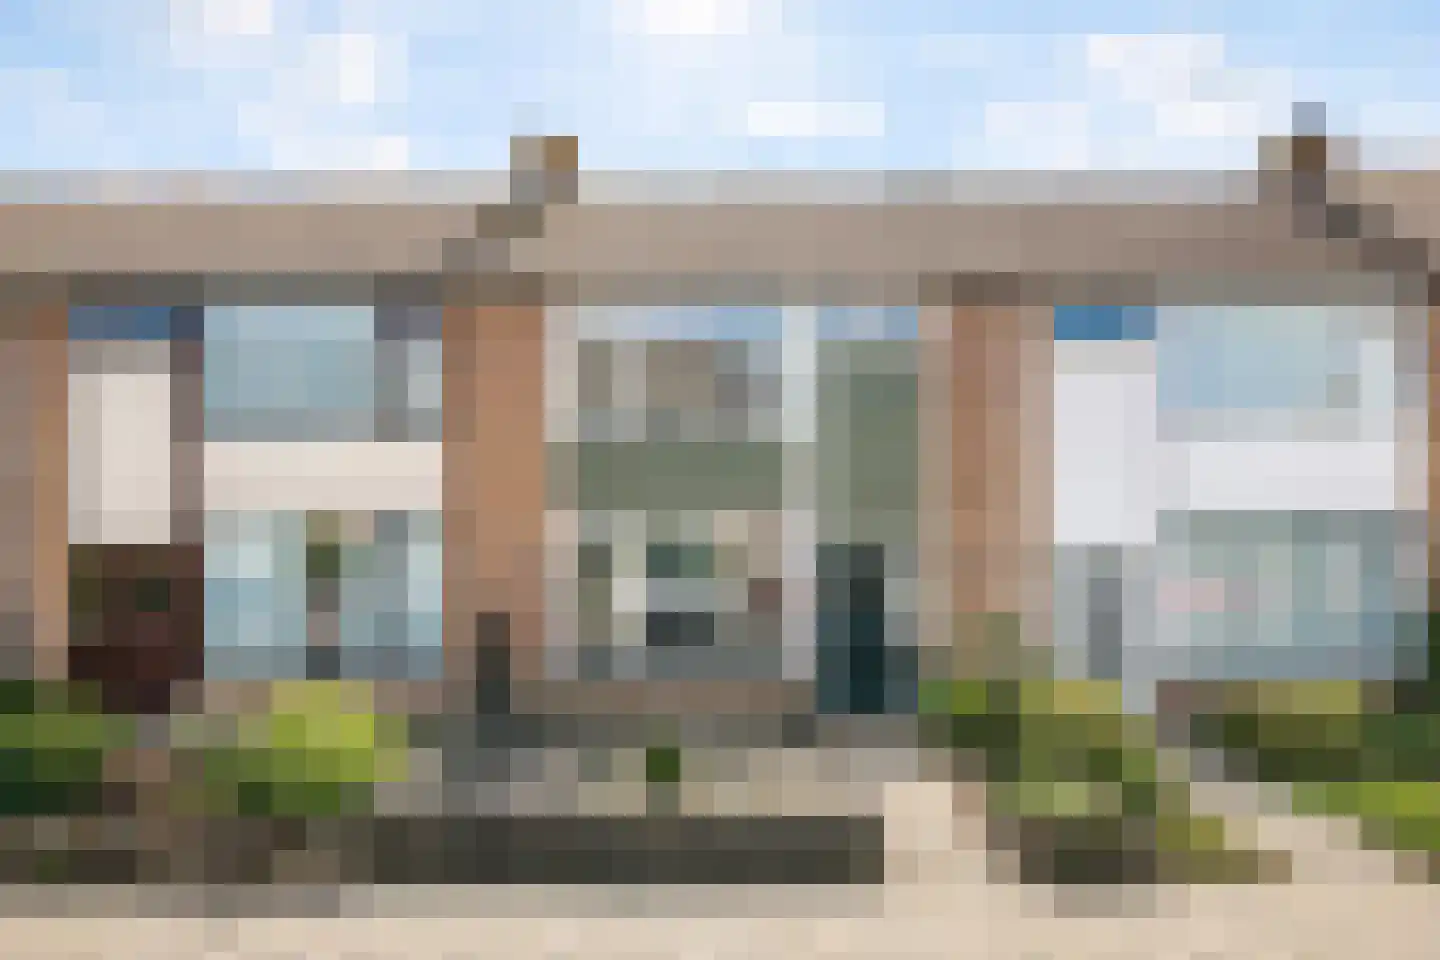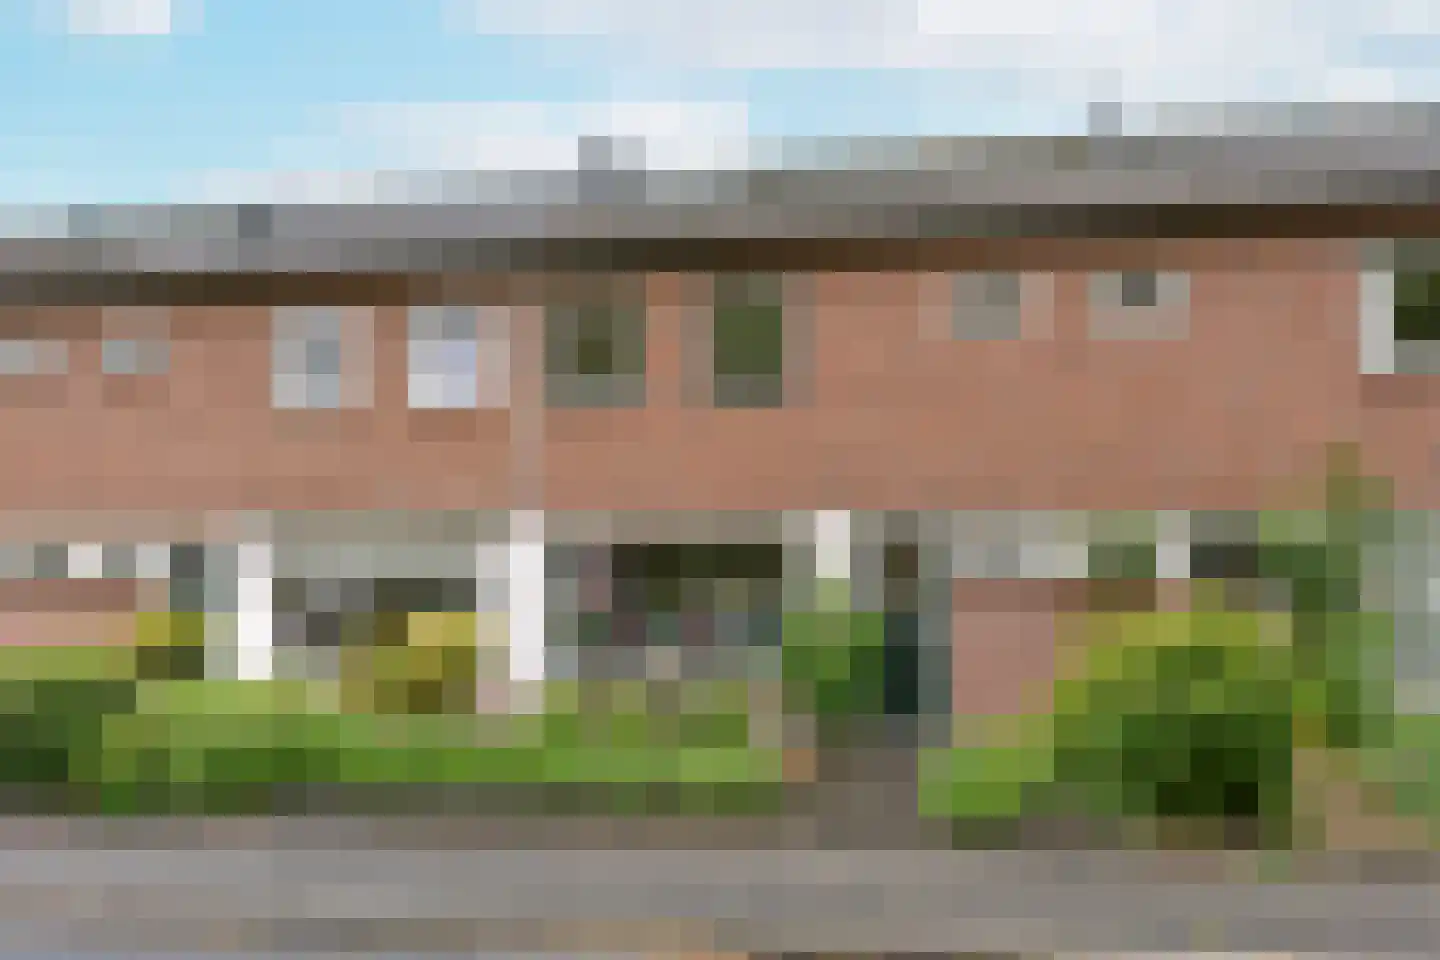
- Available
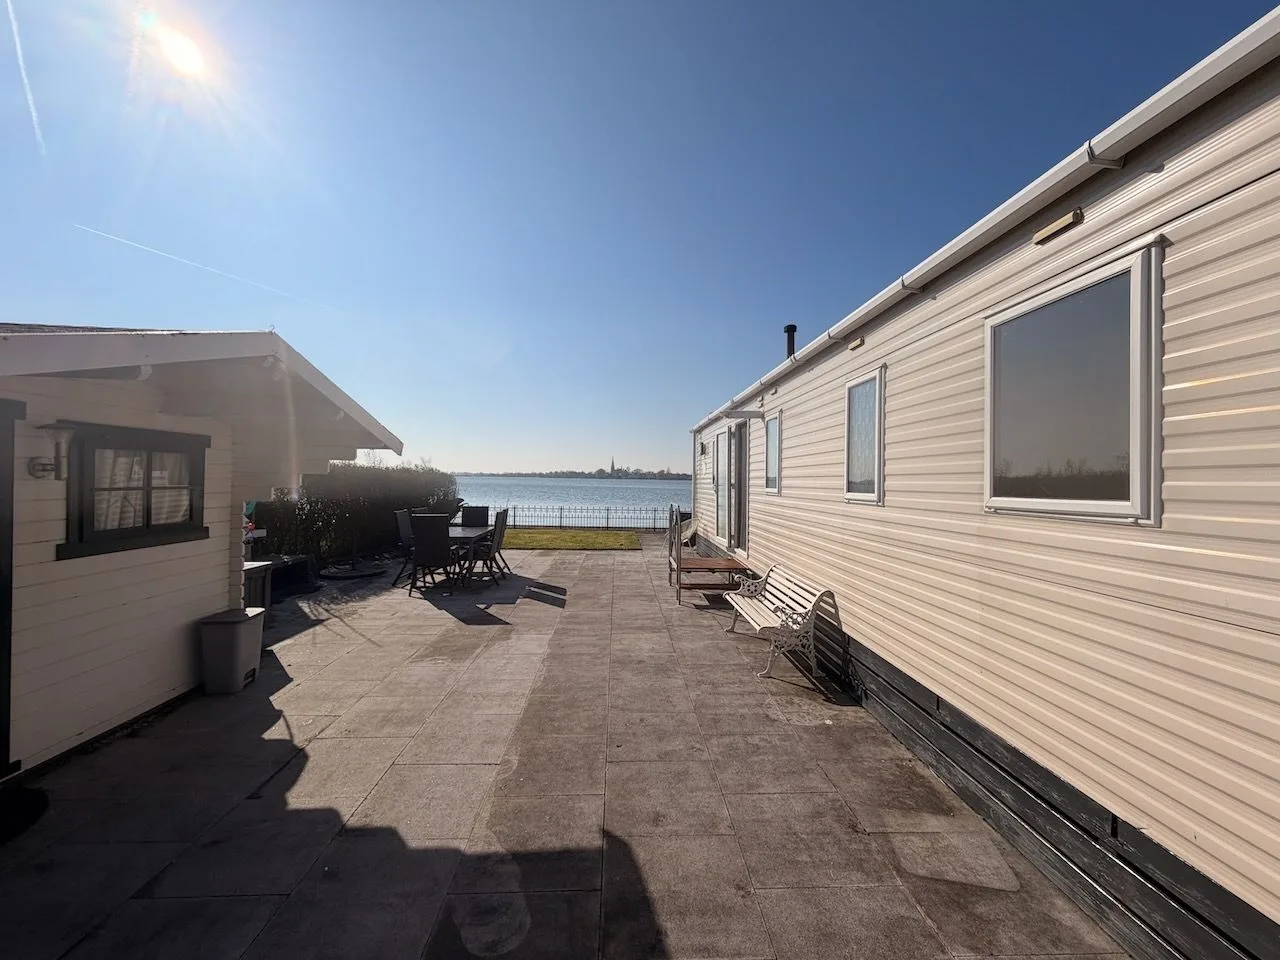
P. van Schravendijkstraat 24
2461VN Ter Aar
€ 449.000 k.k.
€ 5.102/m²
A
Save as favorite
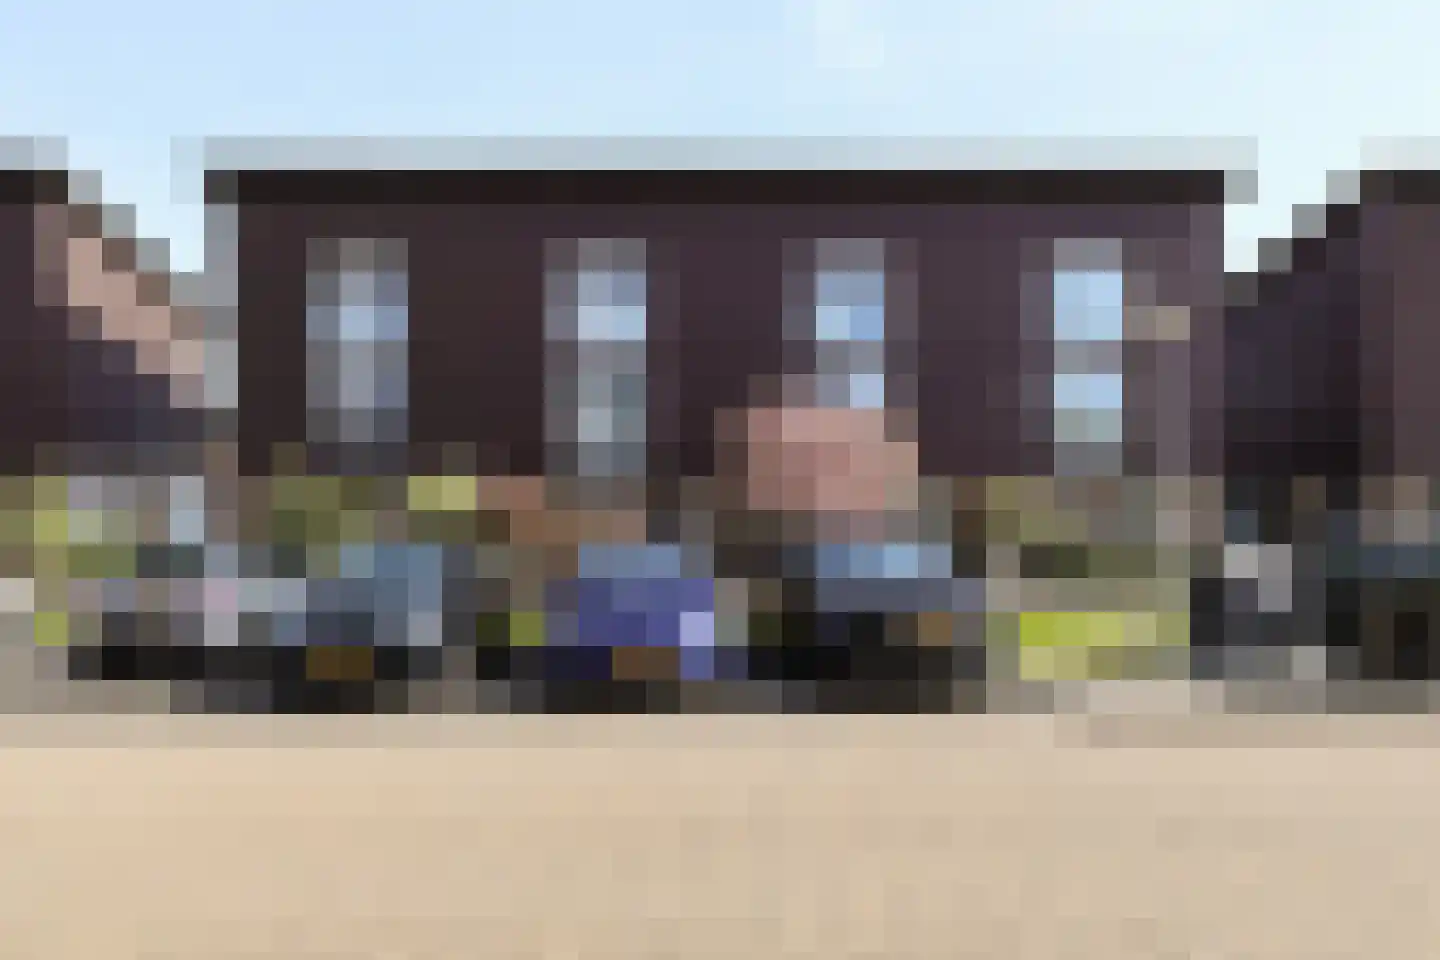
- Living area
- 88 m²
- Land area
- 186 m²
- Bedrooms
- 2