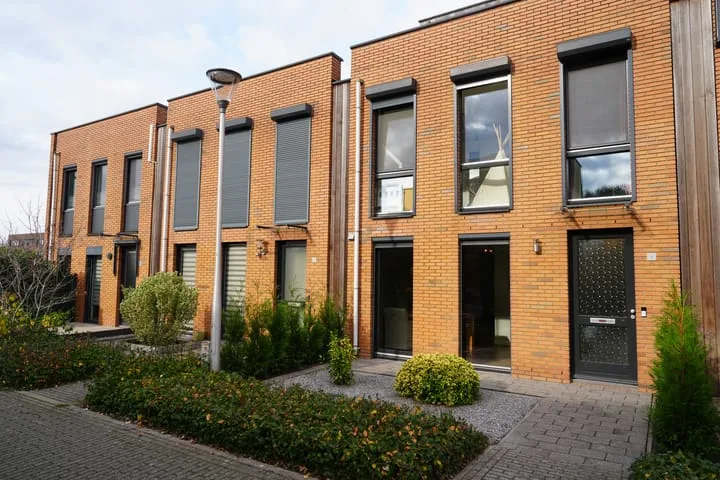
- Sold
Molenstraat 15
5014NA Tilburg
€ 425.000 k.k.
€ 3.320/m²
- Living area
- 128 m²
- Land area
- 156 m²
- Bedrooms
- 3
View 1.968 sold houses in Tilburg
Type to search. Use arrow down and arrow up to navigate through results and press Enter to open.
Hidden search suggestions.
Compare sold homes in Tilburg or view the current offering in this location directly.
On this page you will find recently sold homes in Tilburg. Use this overview to better estimate selling prices, popular neighborhoods, and the local housing supply before you choose a real estate agent. Also view the current housing supply with 2.903 houses in Tilburg.
5014NA Tilburg
€ 425.000 k.k.
€ 3.320/m²
5025KD Tilburg
€ 350.000 k.k.
€ 3.645/m²
5036WP Tilburg
€ 575.000 k.k.
€ 3.527/m²
5043AP Tilburg
€ 447.500 k.k.
€ 4.302/m²
5041KA Tilburg
€ 375.000 k.k.
€ 3.826/m²
5025JM Tilburg
€ 150.000 k.k.
€ 6.250/m²
5038ML Tilburg
€ 374.500 k.k.
€ 3.942/m²
5049CB Tilburg
€ 325.000 k.k.
€ 3.217/m²
5045ML Tilburg
€ 585.000 k.k.
€ 4.208/m²
5022BC Tilburg
€ 575.000 k.k.
€ 3.422/m²
5046GB Tilburg
€ 235.000 k.k.
€ 4.433/m²
5038LK Tilburg
€ 319.000 k.k.
€ 3.797/m²
5041JP Tilburg
€ 279.000 k.k.
€ 3.623/m²
5036AM Tilburg
€ 547.500 k.k.
€ 3.555/m²
5014AS Tilburg
€ 450.000 k.k.
€ 4.128/m²
5017CG Tilburg
€ 385.000 k.k.
€ 5.273/m²
5021TB Tilburg
€ 350.000 k.k.
€ 4.216/m²
5045NE Tilburg
€ 530.000 k.k.
€ 5.300/m²
5011VG Tilburg
€ 550.000 k.k.
€ 3.691/m²
5045SR Tilburg
€ 490.000 k.k.
€ 3.333/m²
5045ED Tilburg
€ 400.000 k.k.
€ 3.571/m²
5043LG Tilburg
€ 400.000 k.k.
€ 3.448/m²
5035LN Tilburg
€ 415.000 k.k.
€ 3.458/m²
5036TL Tilburg
€ 400.000 k.k.
€ 3.478/m²
5038CT Tilburg
€ 339.500 k.k.
€ 6.172/m²
5011LJ Tilburg
€ 387.500 k.k.
€ 2.636/m²
5012BL Tilburg
€ 525.000 k.k.
€ 5.585/m²
5038KG Tilburg
€ 350.000 k.k.
€ 3.240/m²
Bekijk recente verkopen en ontvang gratis offertes van lokale verkoopmakelaars in Tilburg.
Recent verkocht in Tilburg? Lees de verkoopgerichte gids huis verkopen in Tilburg, vergelijk verkoopmakelaars in Tilburg of bekijk de beste verkoopmakelaars in Tilburg voor referentie bij jouw keuze.
Makelaars maken scherpere voorstellen als ze weten dat je vergelijkt — vraag offertes aan voor verkoop of aankoop.
Short answers about housing prices, sold homes and comparing real estate agents in Tilburg.
The costs of a real estate agent in Tilburg vary per office, property type and sales approach. Therefore, compare multiple quotes and also look at the real estate agents in Tilburg to better compare rates, presentation and local experience.
On this page we currently show 1.968 sold houses in Tilburg from our selection. This helps you to better assess recent transactions and the local housing market.
Houses sold in Tilburg give insight into asking prices, house types and neighborhoods where recent transactions have taken place. Compare this also with the current housing stock in Tilburg to better understand the market.
Je kunt verkochte woningen gebruiken als eerste marktindicatie, maar een lokale makelaar kan beter rekening houden met afwerking, ligging, onderhoud en actuele vraag in Tilburg. Plan de volgende stap via de gids huis verkopen in Tilburg.
Vergelijk makelaars in Tilburg op lokale verkoopervaring, reviews, verwachte opbrengst, courtage en marketingaanpak. Bekijk verkoopmakelaars in Tilburg of de top 10 makelaars in Tilburg om snel sterke kantoren te ontdekken.
View current location data on residents, WOZ development, housing stock, energy consumption, business activity and safety in Tilburg. In 2025 were there 205.405 residents. The average WOZ value in 2025 is EUR 322.731.
These figures help to better assess and compare the housing stock in Tilburg with recent sold homes. Orient yourself then on suitable top real estate agents in Tilburg for sales advice in this region.
Residents
205.405
Last year: 2025
Average WOZ
EUR 322.731
Last year: 2025
Average income per person.
EUR 28.412
Source: AllNumbers
Crimes (current year)
12.957
Total registered
| Year | Residents |
|---|---|
| 2021 | 199.305 |
| 2022 | 201.225 |
| 2023 | 203.690 |
| 2024 | 205.150 |
| 2025 | 205.405 |
| Year | Average WOZ |
|---|---|
| 2021 | EUR 231.843 |
| 2022 | EUR 254.105 |
| 2023 | EUR 297.891 |
| 2024 | EUR 310.367 |
| 2025 | EUR 322.731 |
Hoger
51.490
Praktisch
44.420
Middelbaar
64.370
Europa
27.245
Nederland
130.890
Buiten Europa
47.220
Label A
29.423
Label C
21.916
Label B
15.038
Label D
7.166
Label F
7.080
Label E
6.710
Label G
3.778
Label A+
3.558
Label A++
2.474
Label A+++
2.128
Label A++++
451
Label A+++++
26
| Year | Gas (m3) | Electricity (kWh) |
|---|---|---|
| 2020 | 753 | 2.660 |
| 2021 | 836 | 2.692 |
| 2022 | 652 | 2.522 |
| 2023 | 566 | 2.354 |
| 2024 | 552 | 2.372 |
Hoekwoning
Gas: 815 • Electricity: 2.684
Huurwoning
Gas: 475 • Electricity: 2.019
Koopwoning
Gas: 696 • Electricity: 2.671
Appartement
Gas: 347 • Electricity: 1.721
Tussenwoning
Gas: 710 • Electricity: 2.546
Vrijstaande woning
Gas: 1.202 • Electricity: 3.800
Twee-onder-één-kap woning
Gas: 958 • Electricity: 2.934
Total number of company establishments: 25.405
| Period | Crimes |
|---|---|
| jan 2026 | 1.021 |
| jul 2025 | 1.135 |
| jun 2025 | 1.132 |
| mei 2025 | 1.047 |
| mrt 2025 | 1.157 |
| mrt 2026 | 1.062 |
| nov 2024 | 982 |
| nov 2025 | 1.171 |
| okt 2024 | 1.069 |
| okt 2025 | 1.030 |
| sep 2024 | 993 |
| sep 2025 | 1.127 |
These figures give an indicative picture of safety trends in the living environment of Tilburg.
Short answers based on current local statistics, handy for a quick comparison of the living environment.
Tilburg telt in 2025 ongeveer 205.405 inwoners.
De gemiddelde WOZ-waarde in Tilburg is in 2025 circa € 322.731.
Het gemiddelde inkomen per inwoner in Tilburg ligt rond € 28.412 per jaar.
Voor het huidige jaar gaat het om ongeveer 12.957 geregistreerde misdrijven. Gebruik deze cijfers als indicatie en vergelijk trends per periode.
In Tilburg komt vooral "Appartementen" veel voor, met ongeveer 42.224 woningen.