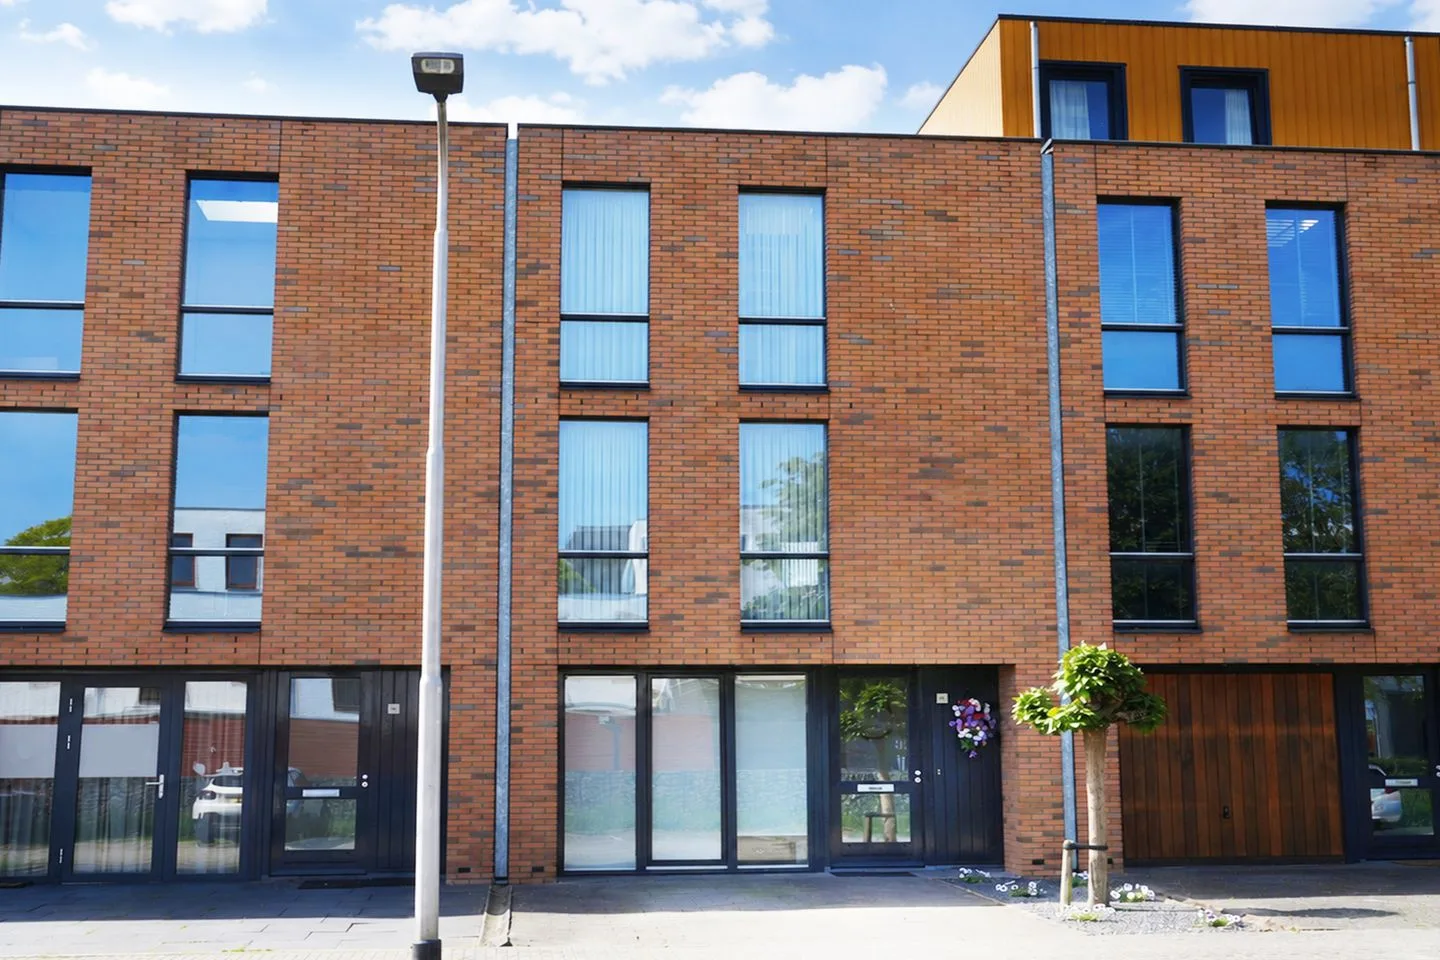
- Available
Beertastraat 35
5043BZ Tilburg
€ 475.000 k.k.
€ 4.481/m²
- Living area
- 106 m²
- Land area
- 266 m²
- Bedrooms
- 5
Searching in 2.892 houses in Tilburg
Type to search. Use arrow down and arrow up to navigate through results and press Enter to open.
Hidden search suggestions.
View current properties in Tilburg or search targeted on street, postal code and property characteristics.
View the current housing stock in Tilburg and quickly filter by price, living area, rooms and more. There are currently 2.892 houses in this place within our selection. View also 1.944 sold houses in Tilburg for extra insight into the local housing market.
5043BZ Tilburg
€ 475.000 k.k.
€ 4.481/m²
5043BB Tilburg
€ 435.000 k.k.
€ 3.850/m²
5021CA Tilburg
€ 425.000 k.k.
€ 3.295/m²
5022EM Tilburg
€ 425.000 k.k.
€ 4.250/m²
5049NP Tilburg
€ 360.000 k.k.
€ 4.045/m²
5011AB Tilburg
€ 350.000 k.k.
€ 2.800/m²
5041KP Tilburg
€ 350.000 k.k.
€ 3.933/m²
5046GH Tilburg
€ 725.000 k.k.
€ 4.290/m²
5026CG Tilburg
€ 650.000 k.k.
€ 4.851/m²
5045ZS Tilburg
€ 450.000 k.k.
€ 3.659/m²
5037EC Tilburg
€ 450.000 k.k.
€ 4.327/m²
5044AR Tilburg
€ 375.000 k.k.
€ 2.930/m²
5022HH Tilburg
€ 375.000 k.k.
€ 3.233/m²
5046JB Tilburg
€ 360.000 k.k.
€ 3.711/m²
5041AH Tilburg
€ 975 p/m
€ 35/m²
5041BD Tilburg
€ 845 p/m
€ 30/m²
5021LL Tilburg
€ 460.000 k.k.
€ 3.966/m²
5046AE Tilburg
€ 675 p/m
€ 31/m²
5025TE Tilburg
€ 315.000 k.k.
€ 4.632/m²
5011SP Tilburg
€ 300.000 k.k.
€ 3.093/m²
5022MD Tilburg
€ 550.000 k.k.
€ 3.986/m²
5035MB Tilburg
€ 550.000 k.k.
€ 4.264/m²
5045KV Tilburg
€ 375.000 k.k.
€ 3.606/m²
5045CC Tilburg
€ 419.000 k.k.
€ 3.150/m²
5014GD Tilburg
€ 500.000 k.k.
€ 3.106/m²
5036BB Tilburg
€ 499.500 k.k.
€ 3.673/m²
5038BV Tilburg
€ 319.000 k.k.
€ 5.063/m²
5043XA Tilburg
€ 750 p/m
€ 29/m²
Get free quotes from real estate agents with local market knowledge. Compare more than 92 real estate agents in Tilburg.
Selling a home in Tilburg? View the sales-oriented guide sell a house in Tilburg, compare all real estate agents in Tilburg or view the top 10 real estate agents in Tilburg for extra context to your choice.
Real estate agents make sharper offers when they know you're comparing — ask for quotes for sale or purchase.
Practical answers about housing supply, sales and comparing real estate agents in Tilburg.
The costs of a real estate agent in Tilburg depend on commission, setup costs, property presentation and the chosen service. Compare the 92 real estate agents in Tilburg via the real estate agent page and request multiple quotes to compare rates and approach well.
Within our selection, we are currently showing 2.892 houses in Tilburg. View also the sold houses in Tilburg to compare the current offering with recent transactions.
Take into account not only price and living area but also maintenance, energy label, location, outdoor space and sales status. This way you compare houses in Tilburg on more than just the asking price.
A local real estate agent knows the neighborhoods, recent transactions and demand in Tilburg. By comparing 92 real estate agents in the region you get a better insight into prices, sales strategy and expected yield; the top 10 in Tilburg provides a useful starting point.
Yes, when making a sales plan, a valuation in Tilburg is wise. You gain insight into a realistic asking price and can then compare offers from real estate agents specifically.
View current location data on residents, WOZ development, housing stock, energy consumption, business activity and safety in Tilburg. In 2025 were there 205.405 residents. The average WOZ value in 2025 is EUR 322.731.
These figures help to better assess and compare the housing stock in Tilburg with recent sold homes. Orient yourself then on suitable top real estate agents in Tilburg for sales advice in this region.
Residents
205.405
Last year: 2025
Average WOZ
EUR 322.731
Last year: 2025
Average income per person.
EUR 28.412
Source: AllNumbers
Crimes (current year)
12.957
Total registered
| Year | Residents |
|---|---|
| 2021 | 199.305 |
| 2022 | 201.225 |
| 2023 | 203.690 |
| 2024 | 205.150 |
| 2025 | 205.405 |
| Year | Average WOZ |
|---|---|
| 2021 | EUR 231.843 |
| 2022 | EUR 254.105 |
| 2023 | EUR 297.891 |
| 2024 | EUR 310.367 |
| 2025 | EUR 322.731 |
Hoger
51.490
Praktisch
44.420
Middelbaar
64.370
Europa
27.245
Nederland
130.890
Buiten Europa
47.220
Label A
29.423
Label C
21.916
Label B
15.038
Label D
7.166
Label F
7.080
Label E
6.710
Label G
3.778
Label A+
3.558
Label A++
2.474
Label A+++
2.128
Label A++++
451
Label A+++++
26
| Year | Gas (m3) | Electricity (kWh) |
|---|---|---|
| 2020 | 753 | 2.660 |
| 2021 | 836 | 2.692 |
| 2022 | 652 | 2.522 |
| 2023 | 566 | 2.354 |
| 2024 | 552 | 2.372 |
Hoekwoning
Gas: 815 • Electricity: 2.684
Huurwoning
Gas: 475 • Electricity: 2.019
Koopwoning
Gas: 696 • Electricity: 2.671
Appartement
Gas: 347 • Electricity: 1.721
Tussenwoning
Gas: 710 • Electricity: 2.546
Vrijstaande woning
Gas: 1.202 • Electricity: 3.800
Twee-onder-één-kap woning
Gas: 958 • Electricity: 2.934
Total number of company establishments: 25.405
| Period | Crimes |
|---|---|
| jan 2026 | 1.021 |
| jul 2025 | 1.135 |
| jun 2025 | 1.132 |
| mei 2025 | 1.047 |
| mrt 2025 | 1.157 |
| mrt 2026 | 1.062 |
| nov 2024 | 982 |
| nov 2025 | 1.171 |
| okt 2024 | 1.069 |
| okt 2025 | 1.030 |
| sep 2024 | 993 |
| sep 2025 | 1.127 |
These figures give an indicative picture of safety trends in the living environment of Tilburg.
Short answers based on current local statistics, handy for a quick comparison of the living environment.
Tilburg telt in 2025 ongeveer 205.405 inwoners.
De gemiddelde WOZ-waarde in Tilburg is in 2025 circa € 322.731.
Het gemiddelde inkomen per inwoner in Tilburg ligt rond € 28.412 per jaar.
Voor het huidige jaar gaat het om ongeveer 12.957 geregistreerde misdrijven. Gebruik deze cijfers als indicatie en vergelijk trends per periode.
In Tilburg komt vooral "Appartementen" veel voor, met ongeveer 42.224 woningen.