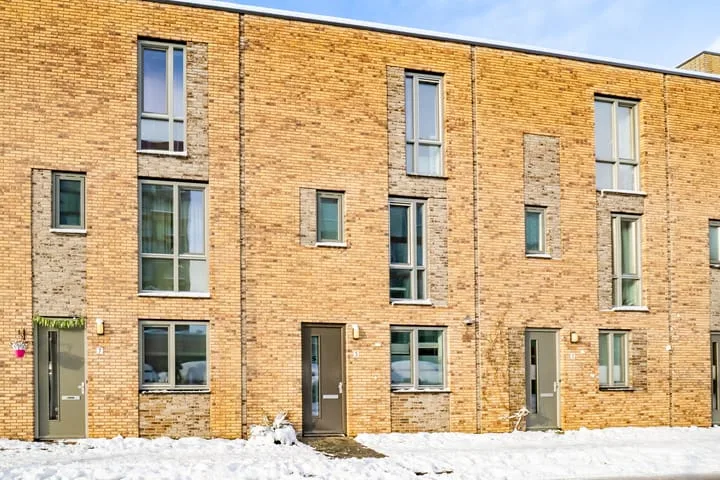
- Sold
Lombokstraat 39
3531RB Utrecht
€ 599.000 k.k.
€ 5.759/m²
- Living area
- 104 m²
- Land area
- 88 m²
- Bedrooms
- 3
View 3.946 sold houses in Utrecht
Type to search. Use arrow down and arrow up to navigate through results and press Enter to open.
Hidden search suggestions.
Compare sold homes in Utrecht or view the current offering in this location directly.
On this page you will find recently sold homes in Utrecht. Use this overview to better estimate selling prices, popular neighborhoods, and the local housing supply before you choose a real estate agent. Also view the current housing supply with 5.091 houses in Utrecht.
3531RB Utrecht
€ 599.000 k.k.
€ 5.759/m²
3531EN Utrecht
€ 575.000 k.k.
€ 4.389/m²
3541DC Utrecht
€ 550.000 k.k.
€ 5.555/m²
3523TW Utrecht
€ 539.000 k.k.
€ 4.944/m²
3572GX Utrecht
€ 795.000 k.k.
€ 7.644/m²
3543GD Utrecht
€ 725.000 k.k.
€ 5.330/m²
3584HL Utrecht
€ 400.000 k.k.
€ 5.000/m²
3583HP Utrecht
€ 1.195.000 k.k.
€ 6.751/m²
3513VT Utrecht
€ 565.000 k.k.
€ 7.739/m²
3513GT Utrecht
€ 525.000 k.k.
€ 4.861/m²
3572JN Utrecht
€ 1.350.000 k.k.
€ 7.848/m²
3515CS Utrecht
€ 815.000 k.k.
€ 5.905/m²
3525VM Utrecht
€ 600.000 k.k.
€ 6.122/m²
3561ES Utrecht
€ 590.000 k.k.
€ 4.836/m²
3531VL Utrecht
€ 575.000 k.k.
€ 6.052/m²
3564JE Utrecht
€ 475.000 k.k.
€ 4.025/m²
3532BP Utrecht
€ 465.000 k.k.
€ 5.812/m²
3582KR Utrecht
€ 350.000 k.k.
€ 8.333/m²
3583VR Utrecht
€ 1.175.000 k.k.
€ 6.714/m²
3551GL Utrecht
€ 485.000 k.k.
€ 6.554/m²
3564JE Utrecht
€ 495.000 k.k.
€ 4.194/m²
3541CN Utrecht
€ 525.000 k.k.
€ 5.965/m²
3543HT Utrecht
€ 600.000 k.k.
€ 4.651/m²
3522BB Utrecht
€ 475.000 k.k.
€ 6.418/m²
3513EW Utrecht
€ 250.000 k.k.
€ 8.620/m²
3511TA Utrecht
€ 525.000 k.k.
€ 5.833/m²
3531SR Utrecht
€ 400.000 k.k.
€ 7.142/m²
3551BH Utrecht
€ 495.000 k.k.
€ 5.625/m²
Bekijk recente verkopen en ontvang gratis offertes van lokale verkoopmakelaars in Utrecht.
Recent verkocht in Utrecht? Lees de verkoopgerichte gids huis verkopen in Utrecht, vergelijk verkoopmakelaars in Utrecht of bekijk de beste verkoopmakelaars in Utrecht voor referentie bij jouw keuze.
Makelaars maken scherpere voorstellen als ze weten dat je vergelijkt — vraag offertes aan voor verkoop of aankoop.
Short answers about housing prices, sold homes and comparing real estate agents in Utrecht.
The costs of a real estate agent in Utrecht vary per office, property type and sales approach. Therefore, compare multiple quotes and also look at the real estate agents in Utrecht to better compare rates, presentation and local experience.
On this page we currently show 3.946 sold houses in Utrecht from our selection. This helps you to better assess recent transactions and the local housing market.
Houses sold in Utrecht give insight into asking prices, house types and neighborhoods where recent transactions have taken place. Compare this also with the current housing stock in Utrecht to better understand the market.
Je kunt verkochte woningen gebruiken als eerste marktindicatie, maar een lokale makelaar kan beter rekening houden met afwerking, ligging, onderhoud en actuele vraag in Utrecht. Plan de volgende stap via de gids huis verkopen in Utrecht.
Vergelijk makelaars in Utrecht op lokale verkoopervaring, reviews, verwachte opbrengst, courtage en marketingaanpak. Bekijk verkoopmakelaars in Utrecht of de top 10 makelaars in Utrecht om snel sterke kantoren te ontdekken.
View current location data on residents, WOZ development, housing stock, energy consumption, business activity and safety in Utrecht. In 2025 were there 325.510 residents. The average WOZ value in 2025 is EUR 474.416.
These figures help to better assess and compare the housing stock in Utrecht with recent sold homes. Orient yourself then on suitable top real estate agents in Utrecht for sales advice in this region.
Residents
325.510
Last year: 2025
Average WOZ
EUR 474.416
Last year: 2025
Average income per person.
EUR 38.255
Source: AllNumbers
Crimes (current year)
25.985
Total registered
| Year | Residents |
|---|---|
| 2021 | 308.685 |
| 2022 | 310.610 |
| 2023 | 316.460 |
| 2024 | 323.020 |
| 2025 | 325.510 |
| Year | Average WOZ |
|---|---|
| 2021 | EUR 349.277 |
| 2022 | EUR 381.193 |
| 2023 | EUR 442.579 |
| 2024 | EUR 435.454 |
| 2025 | EUR 474.416 |
Hoger
148.860
Praktisch
45.840
Middelbaar
67.680
Europa
37.515
Nederland
186.915
Buiten Europa
101.045
Label A
47.799
Label C
25.699
Label B
17.523
Label D
13.066
Label F
12.655
Label G
11.728
Label E
11.306
Label A+
9.677
Label A++
5.013
Label A+++
4.232
Label A++++
725
Label A+++++
21
| Year | Gas (m3) | Electricity (kWh) |
|---|---|---|
| 2020 | 664 | 2.253 |
| 2021 | 740 | 2.328 |
| 2022 | 572 | 2.170 |
| 2023 | 484 | 2.028 |
| 2024 | 468 | 2.042 |
Hoekwoning
Gas: 791 • Electricity: 2.601
Huurwoning
Gas: 421 • Electricity: 1.821
Koopwoning
Gas: 587 • Electricity: 2.316
Appartement
Gas: 368 • Electricity: 1.760
Tussenwoning
Gas: 700 • Electricity: 2.361
Vrijstaande woning
Gas: 1.325 • Electricity: 3.953
Twee-onder-één-kap woning
Gas: 898 • Electricity: 3.142
Total number of company establishments: 55.750
| Period | Crimes |
|---|---|
| jan 2025 | 1.938 |
| jan 2026 | 2.042 |
| jul 2025 | 2.284 |
| jun 2025 | 2.296 |
| mei 2025 | 2.085 |
| mrt 2025 | 2.095 |
| nov 2024 | 2.183 |
| nov 2025 | 2.313 |
| okt 2024 | 2.124 |
| okt 2025 | 2.340 |
| sep 2024 | 1.881 |
| sep 2025 | 2.221 |
These figures give an indicative picture of safety trends in the living environment of Utrecht.
Short answers based on current local statistics, handy for a quick comparison of the living environment.
Utrecht telt in 2025 ongeveer 325.510 inwoners.
De gemiddelde WOZ-waarde in Utrecht is in 2025 circa € 474.416.
Het gemiddelde inkomen per inwoner in Utrecht ligt rond € 38.255 per jaar.
Voor het huidige jaar gaat het om ongeveer 25.985 geregistreerde misdrijven. Gebruik deze cijfers als indicatie en vergelijk trends per periode.
In Utrecht komt vooral "Appartementen" veel voor, met ongeveer 108.137 woningen.