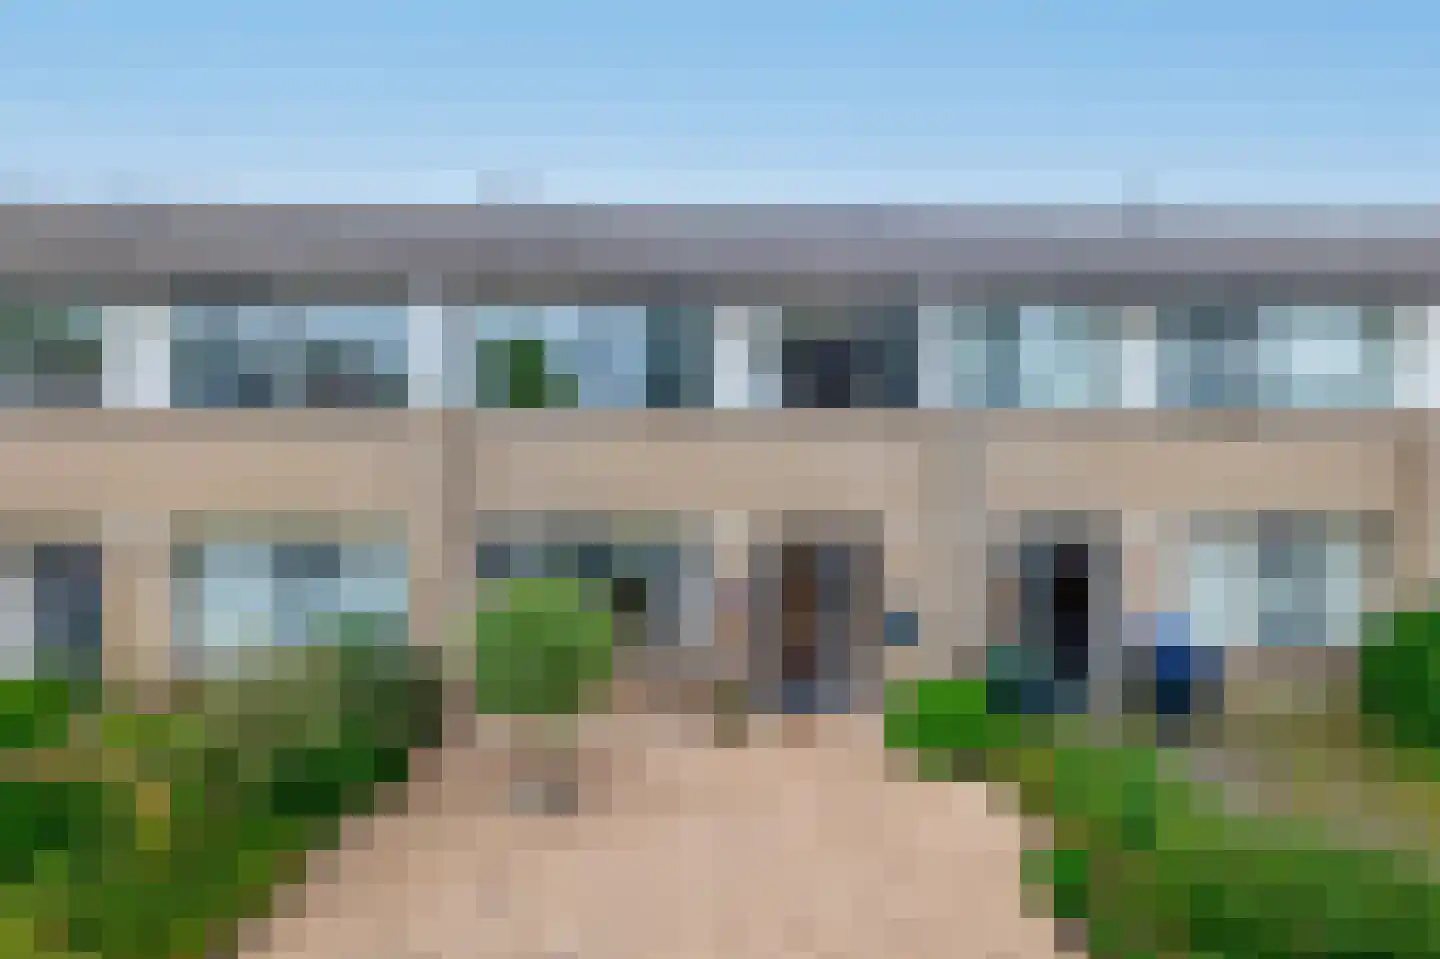
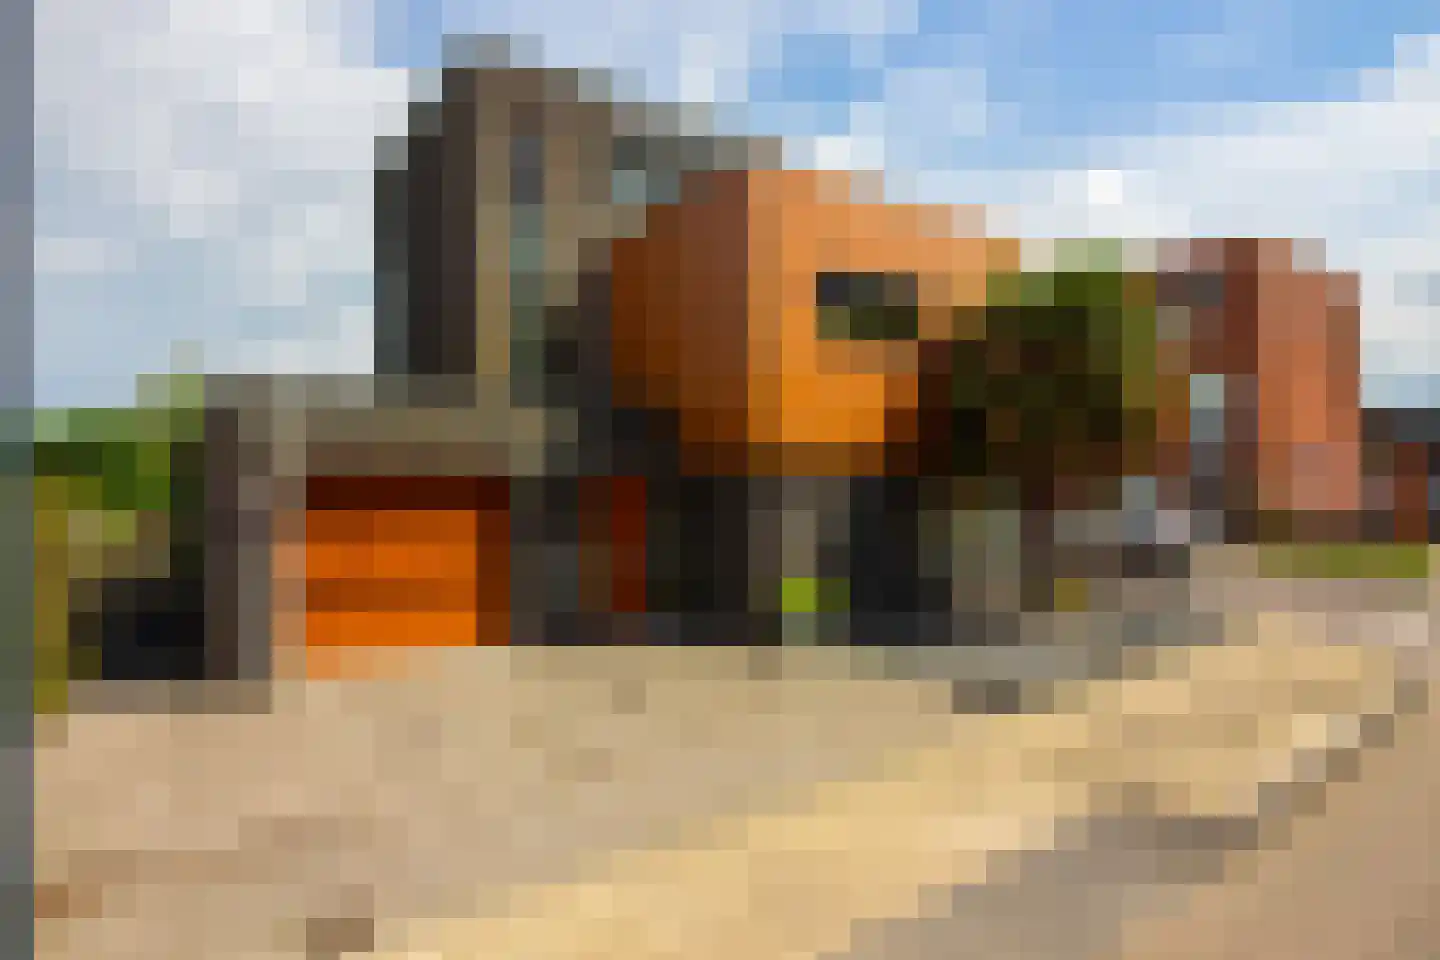
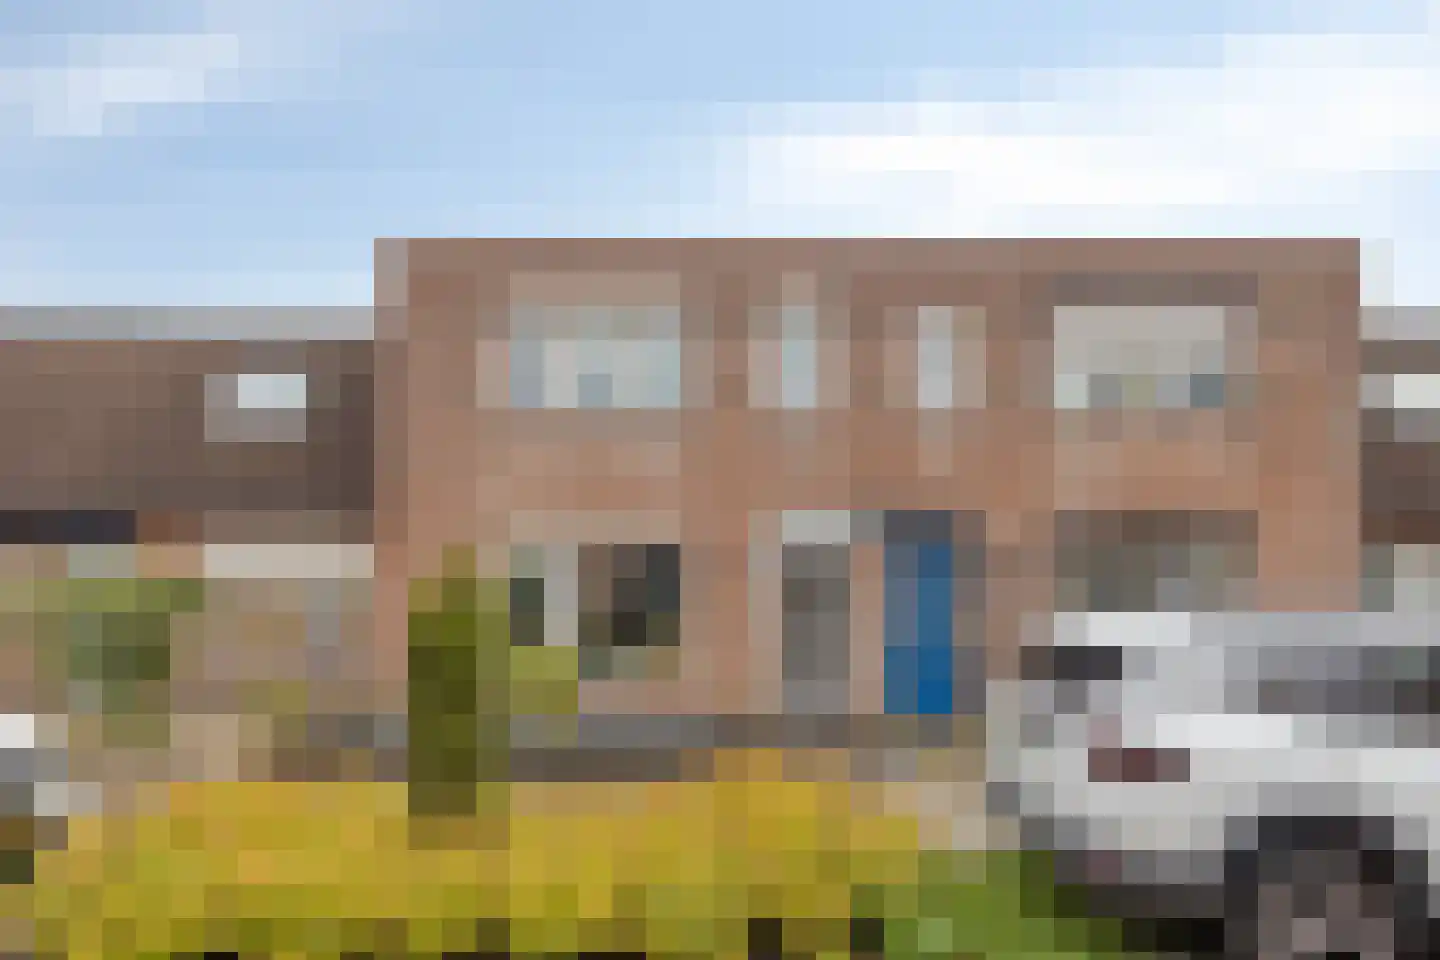
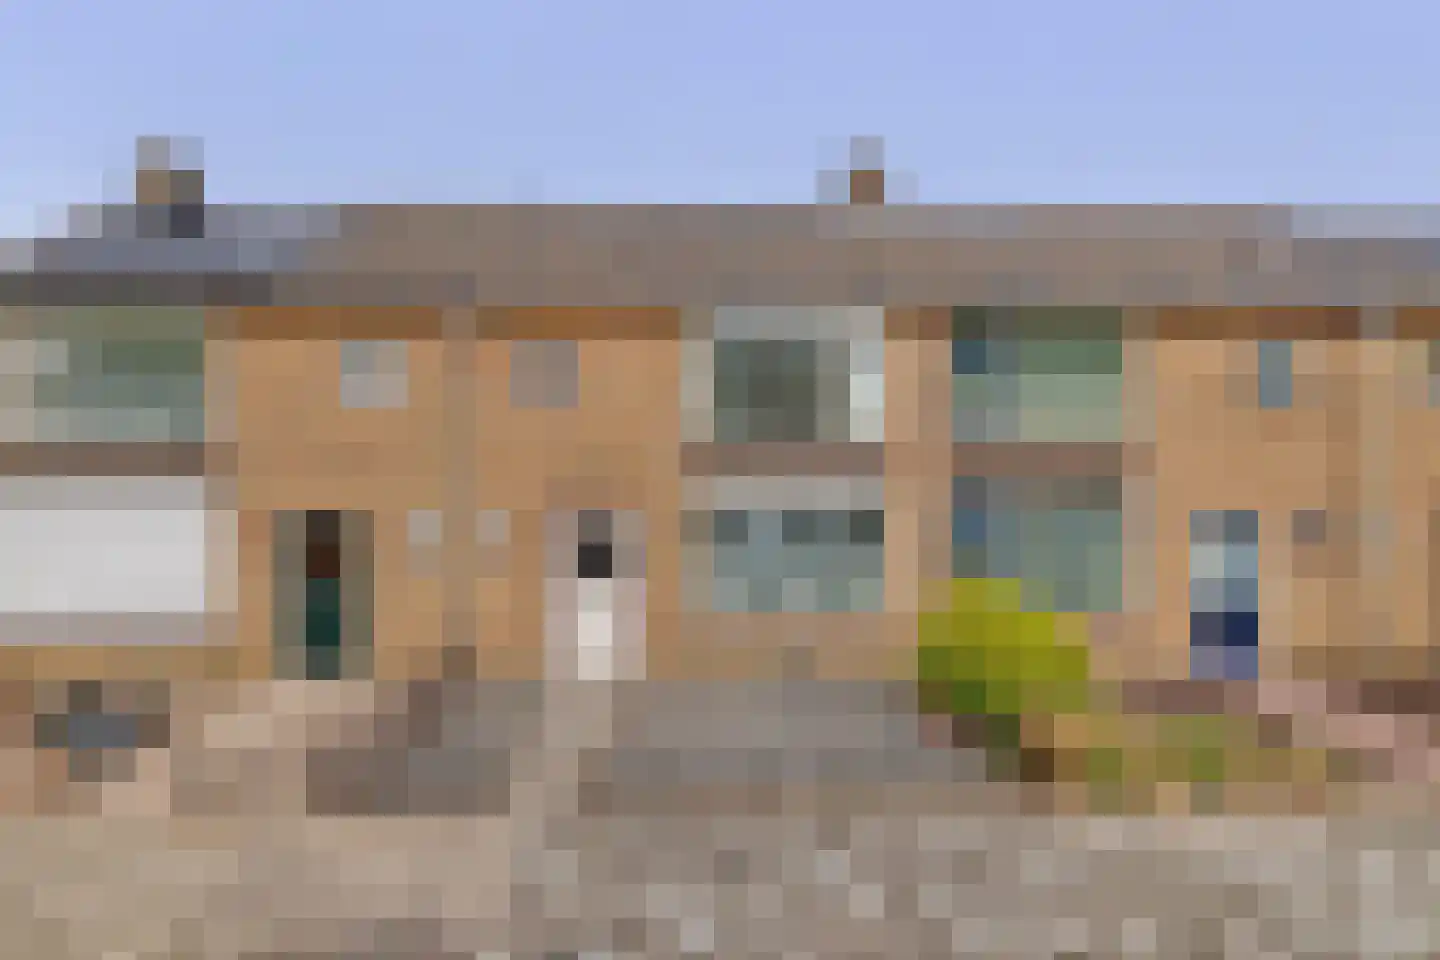
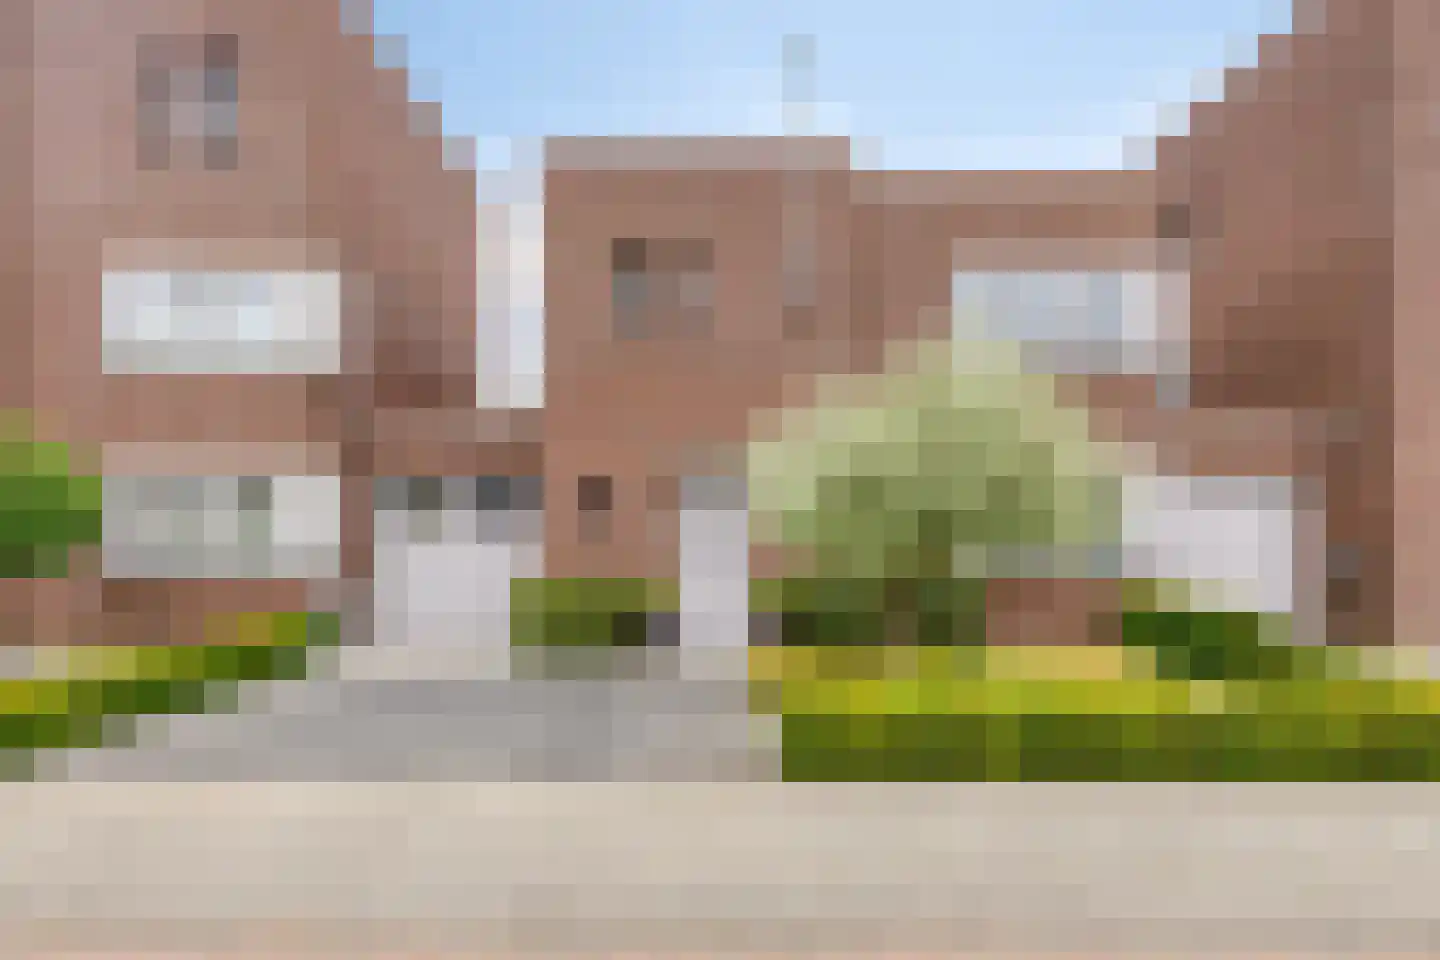
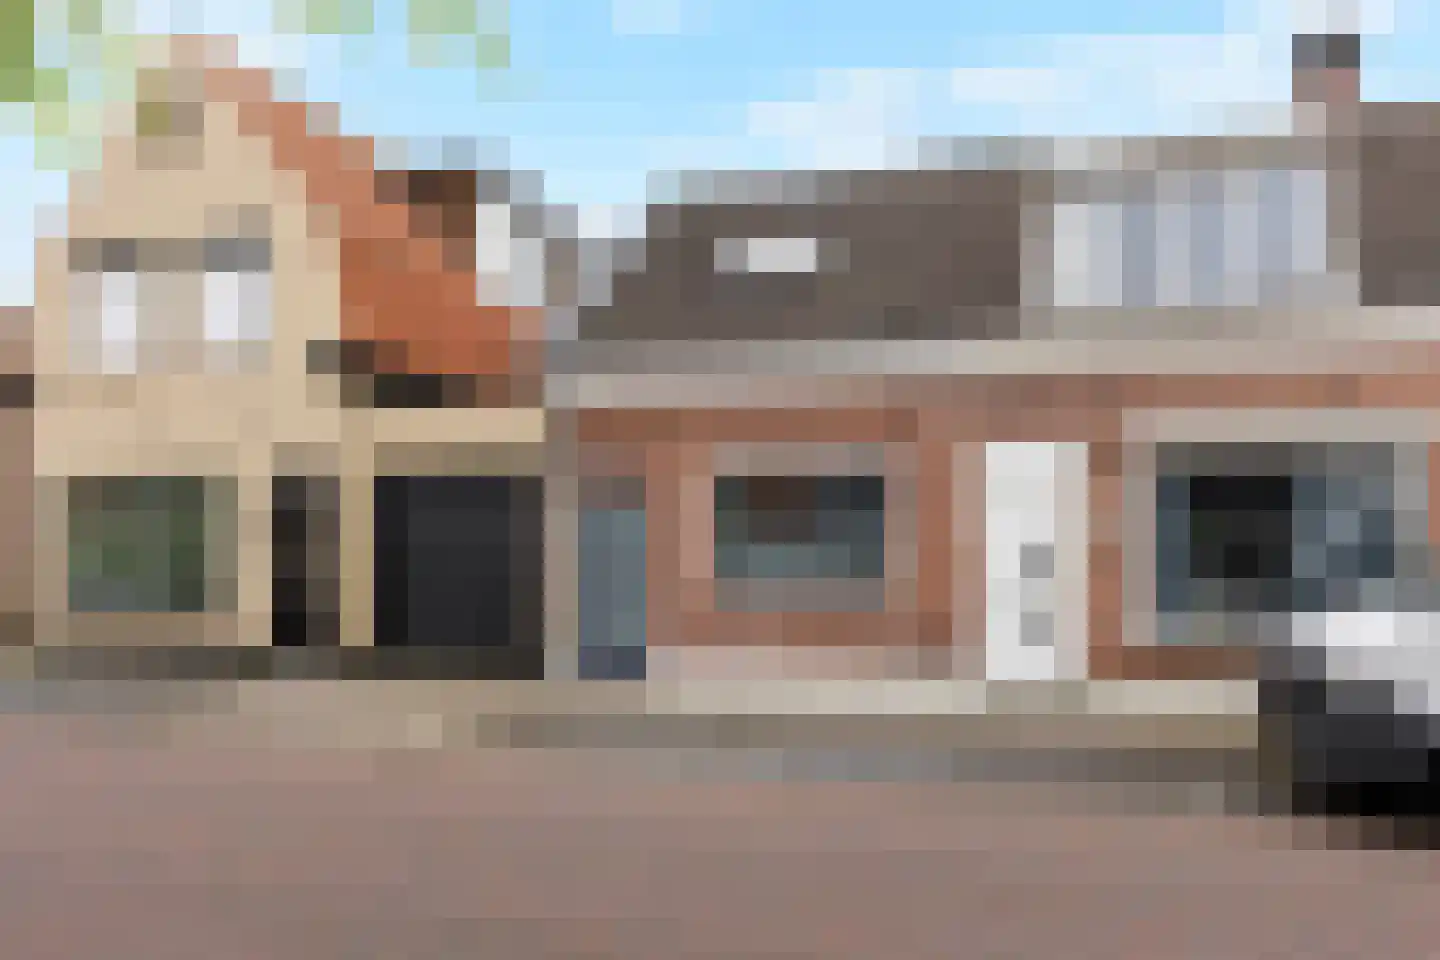
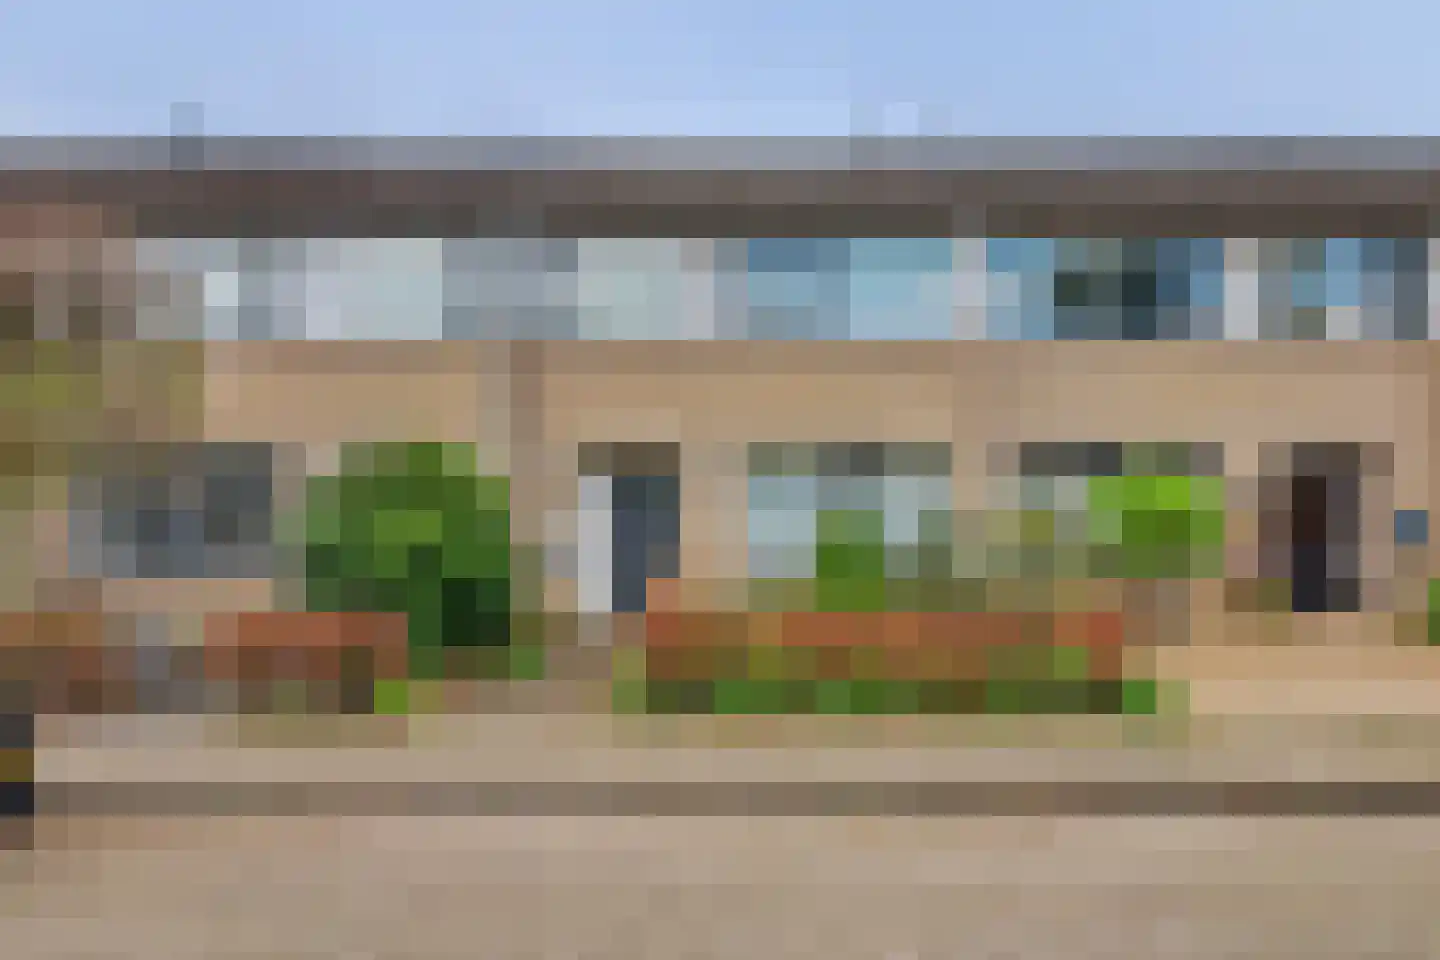
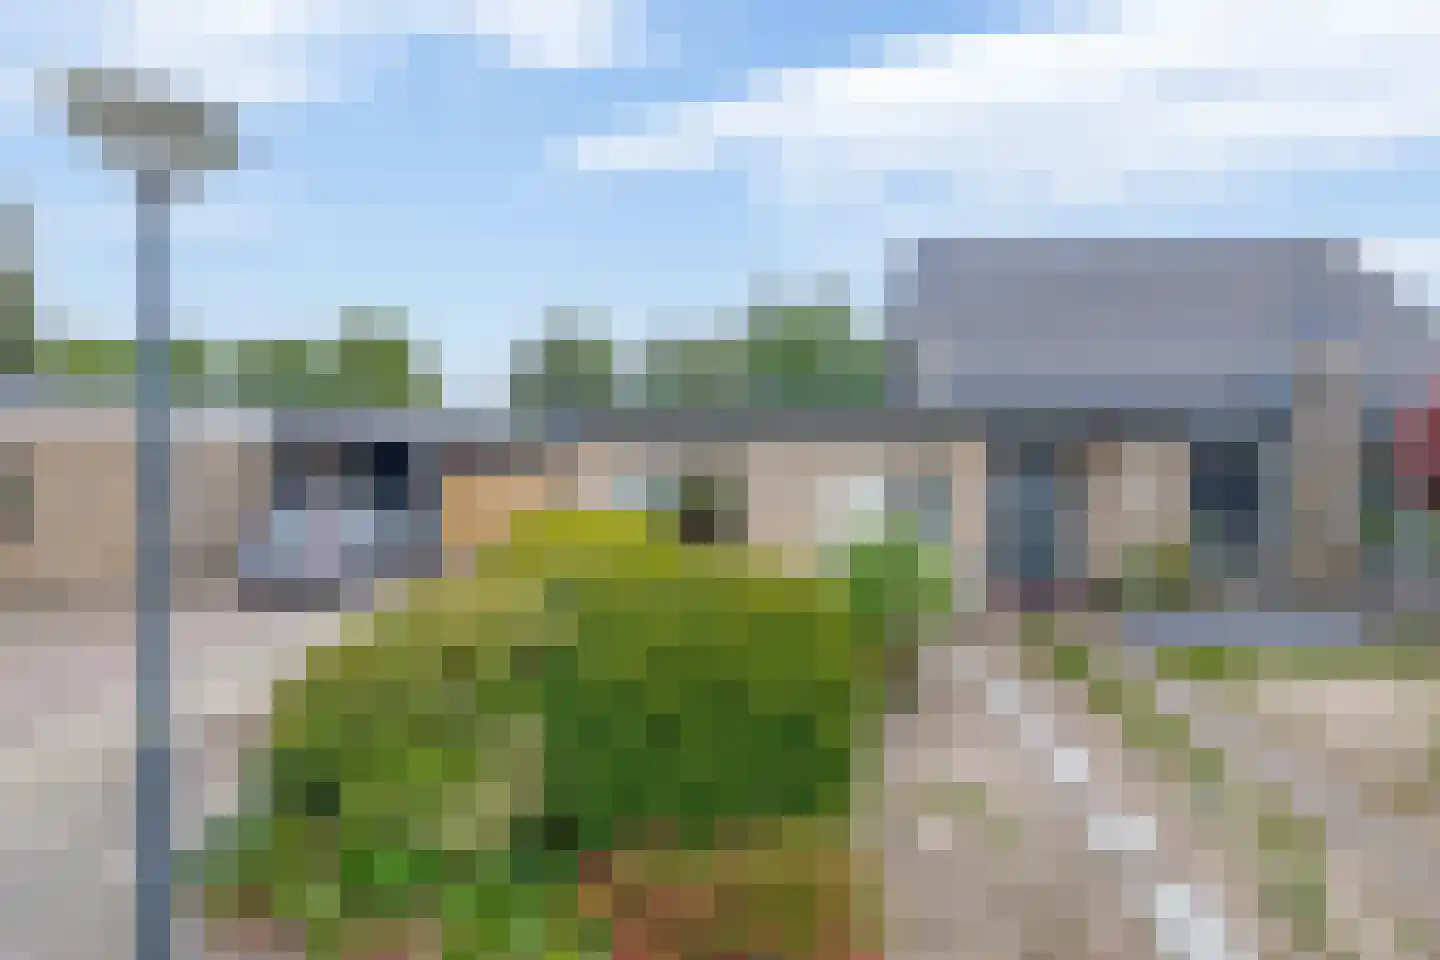
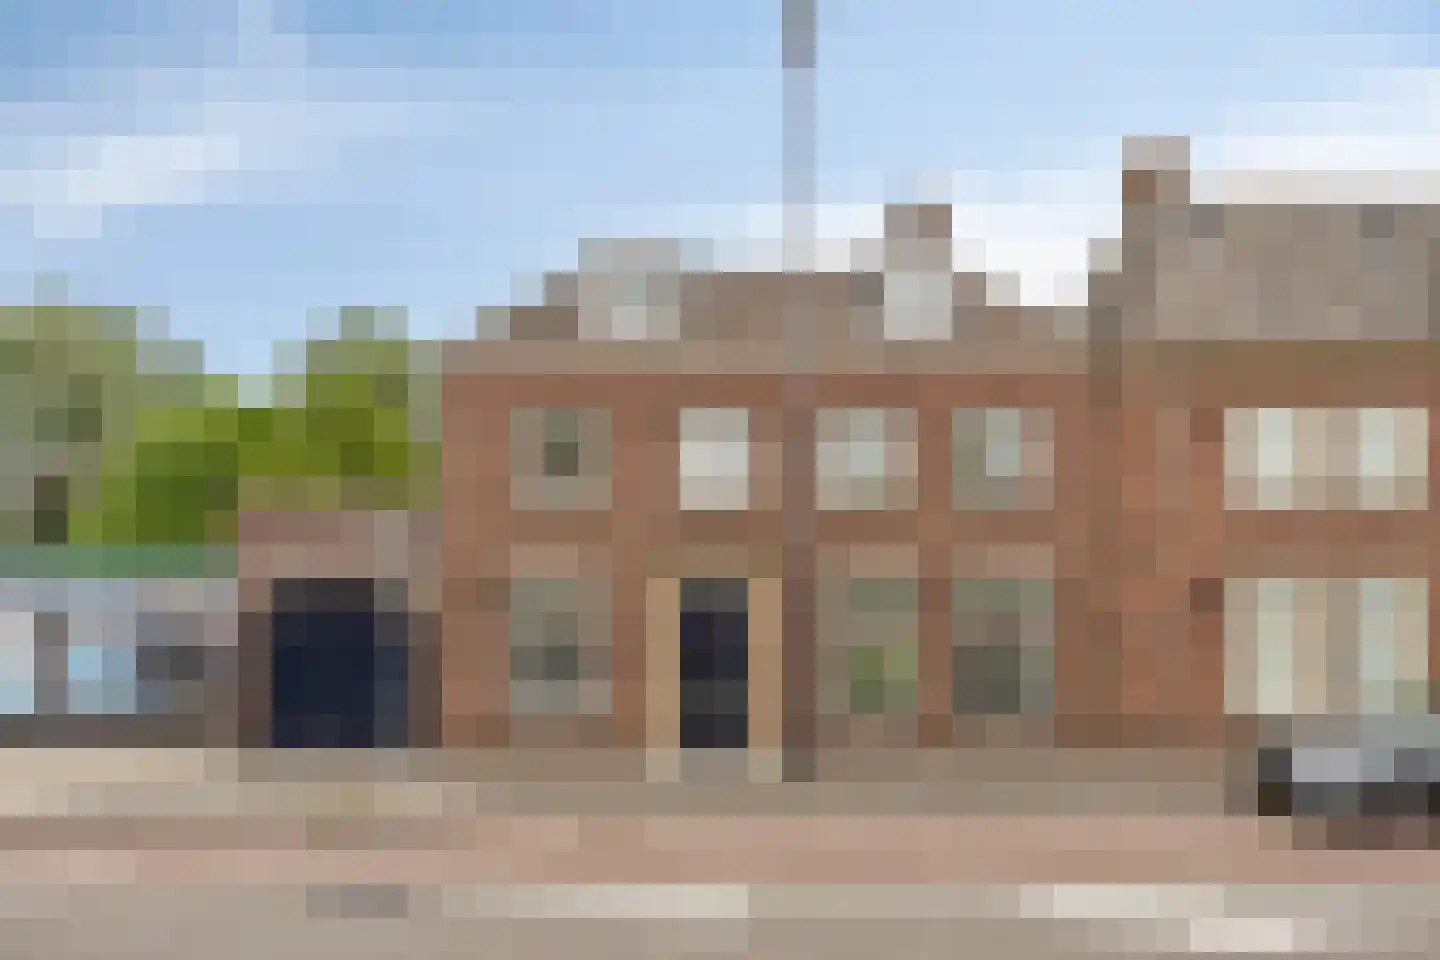
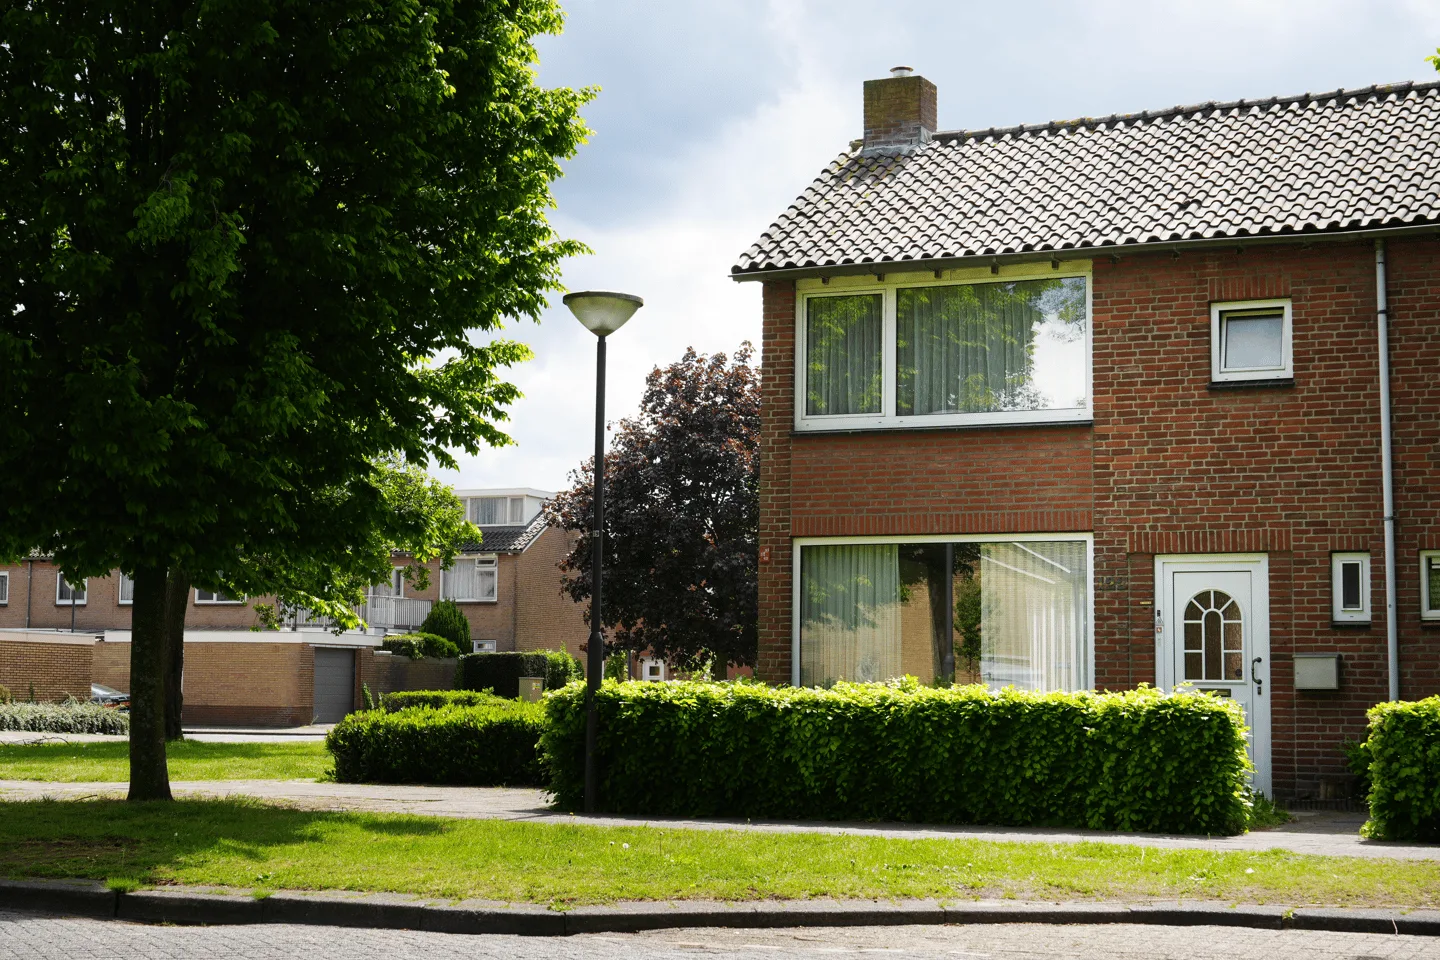
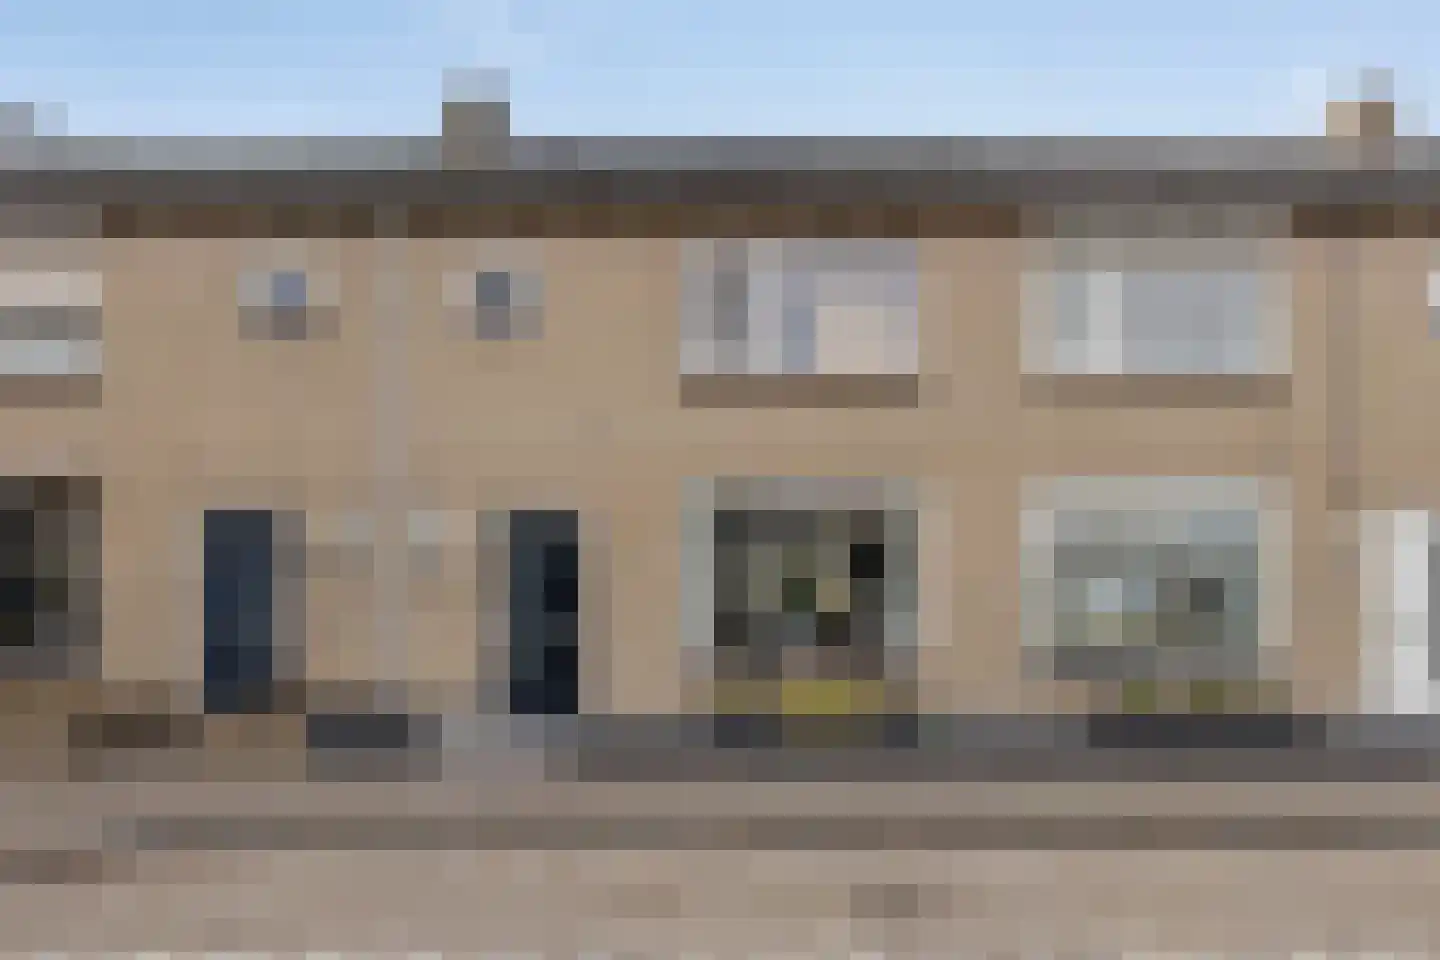
- Available
Wijnruitstraat 31
5143AH Waalwijk
€ 325.000 k.k.
€ 4.924/m²
- Living area
- 66 m²
- Land area
- 103 m²
- Bedrooms
- 3
Searching in 510 houses in Waalwijk
Type to search. Use arrow down and arrow up to navigate through results and press Enter to open.
Hidden search suggestions.
View current properties in Waalwijk or search targeted on street, postal code and property characteristics.
View the current housing stock in Waalwijk and quickly filter by price, living area, rooms and more. There are currently 510 houses in this place within our selection. View also 371 sold houses in Waalwijk for extra insight into the local housing market.
5143AH Waalwijk
€ 325.000 k.k.
€ 4.924/m²
5144TA Waalwijk
€ 399.000 k.k.
€ 2.871/m²
5146AA Waalwijk
€ 850.000 k.k.
€ 4.570/m²
5141HK Waalwijk
€ 425.000 k.k.
€ 5.000/m²
5142RJ Waalwijk
€ 479.000 k.k.
€ 4.650/m²
5144ZA Waalwijk
€ 560.000 k.k.
€ 4.480/m²
5142NX Waalwijk
€ 395.000 k.k.
€ 3.911/m²
5143TE Waalwijk
€ 345.000 k.k.
€ 3.350/m²
5144GS Waalwijk
€ 339.000 k.k.
€ 3.606/m²
5146EG Waalwijk
€ 725.000 k.k.
€ 4.290/m²
5141AK Waalwijk
€ 350.000 k.k.
€ 3.684/m²
5144TA Waalwijk
€ 395.000 k.k.
€ 2.883/m²
5143CV Waalwijk
€ 305.000 k.k.
€ 4.420/m²
5141KJ Waalwijk
€ 619.000 k.k.
€ 3.869/m²
5143CA Waalwijk
€ 299.500 k.k.
€ 4.538/m²
5142ER Waalwijk
€ 745.000 k.k.
€ 3.417/m²
5141EL Waalwijk
€ 1.185.000 k.k.
€ 5.461/m²
5143JV Waalwijk
€ 789.000 k.k.
€ 5.260/m²
5141AB Waalwijk
€ 550.000 k.k.
€ 3.929/m²
5143GG Waalwijk
€ 1.385.000 k.k.
€ 6.183/m²
5143CN Waalwijk
€ 349.000 k.k.
€ 3.966/m²
5144AT Waalwijk
€ 619.000 k.k.
€ 3.497/m²
5142NJ Waalwijk
€ 475.000 k.k.
€ 3.992/m²
5141BD Waalwijk
€ 795.000 k.k.
€ 4.907/m²
5141HK Waalwijk
€ 420.000 k.k.
5141EP Waalwijk
€ 470.000 k.k.
5141JR Waalwijk
€ 339.000 k.k.
5144VA Waalwijk
€ 435.000 k.k.
€ 4.780/m²
Get free quotes from real estate agents with local market knowledge. Compare more than 30 real estate agents in Waalwijk.
Selling a home in Waalwijk? View the sales-oriented guide sell a house in Waalwijk, compare all real estate agents in Waalwijk or view the top 10 real estate agents in Waalwijk for extra context to your choice.
Real estate agents make sharper offers when they know you're comparing — ask for quotes for sale or purchase.
Practical answers about housing supply, sales and comparing real estate agents in Waalwijk.
The costs of a real estate agent in Waalwijk depend on commission, setup costs, property presentation and the chosen service. Compare the 30 real estate agents in Waalwijk via the real estate agent page and request multiple quotes to compare rates and approach well.
Within our selection, we are currently showing 510 houses in Waalwijk. View also the sold houses in Waalwijk to compare the current offering with recent transactions.
Take into account not only price and living area but also maintenance, energy label, location, outdoor space and sales status. This way you compare houses in Waalwijk on more than just the asking price.
A local real estate agent knows the neighborhoods, recent transactions and demand in Waalwijk. By comparing 30 real estate agents in the region you get a better insight into prices, sales strategy and expected yield; the top 10 in Waalwijk provides a useful starting point.
Yes, when making a sales plan, a valuation in Waalwijk is wise. You gain insight into a realistic asking price and can then compare offers from real estate agents specifically.
View current location data on residents, WOZ development, housing stock, energy consumption, business activity and safety in Waalwijk. In 2025 were there 36.070 residents. The average WOZ value in 2025 is EUR 359.426.
These figures help to better assess and compare the housing stock in Waalwijk with recent sold homes. Orient yourself then on suitable top real estate agents in Waalwijk for sales advice in this region.
Residents
36.070
Last year: 2025
Average WOZ
EUR 359.426
Last year: 2025
Average income per person.
EUR 26.073
Source: AllNumbers
Crimes (current year)
1.439
Total registered
| Year | Residents |
|---|---|
| 2021 | 33.880 |
| 2022 | 34.415 |
| 2023 | 34.775 |
| 2024 | 35.060 |
| 2025 | 36.070 |
| Year | Average WOZ |
|---|---|
| 2021 | EUR 257.498 |
| 2022 | EUR 279.704 |
| 2023 | EUR 324.854 |
| 2024 | EUR 335.124 |
| 2025 | EUR 359.426 |
Hoger
5.620
Praktisch
8.070
Middelbaar
11.290
Europa
4.750
Nederland
25.670
Buiten Europa
5.635
Label A
4.481
Label C
4.342
Label B
2.608
Label D
1.377
Label E
877
Label G
745
Label F
743
Label A+++
439
Label A++++
428
Label A+
379
Label A++
366
Label A+++++
16
| Year | Gas (m3) | Electricity (kWh) |
|---|---|---|
| 2020 | 1.155 | 2.855 |
| 2021 | 1.288 | 2.895 |
| 2022 | 988 | 2.724 |
| 2023 | 852 | 2.574 |
| 2024 | 822 | 2.622 |
Hoekwoning
Gas: 964 • Electricity: 2.781
Huurwoning
Gas: 658 • Electricity: 1.995
Koopwoning
Gas: 975 • Electricity: 2.960
Appartement
Gas: 550 • Electricity: 1.766
Tussenwoning
Gas: 831 • Electricity: 2.597
Vrijstaande woning
Gas: 1.434 • Electricity: 4.057
Twee-onder-één-kap woning
Gas: 1.111 • Electricity: 3.244
Total number of company establishments: 4.860
| Period | Crimes |
|---|---|
| jan 2025 | 127 |
| jan 2026 | 112 |
| jul 2025 | 119 |
| jun 2025 | 95 |
| mei 2025 | 114 |
| mrt 2025 | 131 |
| nov 2024 | 125 |
| nov 2025 | 131 |
| okt 2024 | 150 |
| okt 2025 | 129 |
| sep 2024 | 106 |
| sep 2025 | 140 |
These figures give an indicative picture of safety trends in the living environment of Waalwijk.
Short answers based on current local statistics, handy for a quick comparison of the living environment.
Waalwijk telt in 2025 ongeveer 36.070 inwoners.
De gemiddelde WOZ-waarde in Waalwijk is in 2025 circa € 359.426.
Het gemiddelde inkomen per inwoner in Waalwijk ligt rond € 26.073 per jaar.
Voor het huidige jaar gaat het om ongeveer 1.439 geregistreerde misdrijven. Gebruik deze cijfers als indicatie en vergelijk trends per periode.
In Waalwijk komt vooral "Tussenwoningen" veel voor, met ongeveer 5.980 woningen.