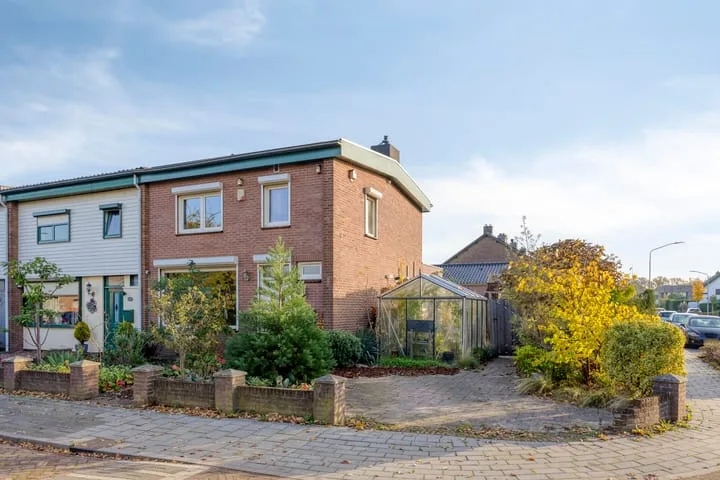
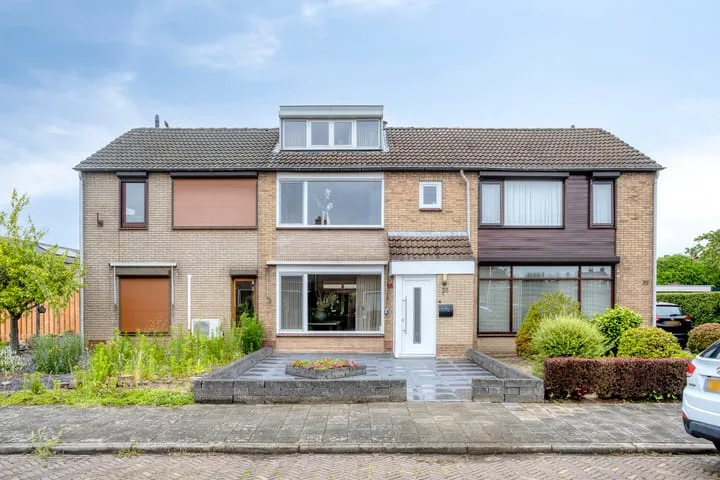
Houses sold in Weurt

View 25 sold houses in Weurt

Connected to: Vastgoed Nederland NVM Makelaars

On this page you will find recently sold homes in Weurt. Use this overview to better estimate selling prices, popular neighborhoods, and the local housing supply before you choose a real estate agent. Also view the current housing supply with 28 houses in Weurt.

Selection

Search and filter homes

Set your preferences and discover homes that suit you.

Total supply 242.874
Filters

Set price, area and other characteristics. Adjust a filter or click on Show homes. Location changes directly above.

Reset filters

You search for

  • Place Weurt
  • Status Sold

Huis verkopen in Weurt? Vergelijk verkoopmakelaars

Bekijk recente verkopen en ontvang gratis offertes van lokale makelaars. Vergelijk meer dan 87 makelaars in Weurt.

Free request a quote

  • Quotes in Weurt
  • Non-binding
  • Personal
  • Compare free rates

Zelf je woning verkopen in Weurt? Vergelijk verkoopmakelaars in Weurt of bekijk de beste verkoopmakelaars in Weurt als referentie bij jouw keuze.

Vergelijk meerdere offertes

Makelaars maken scherpere voorstellen als ze weten dat je vergelijkt — vraag offertes aan voor verkoop of aankoop.

Frequently asked questions about sold homes in Weurt

Short answers about housing prices, sold homes and comparing real estate agents in Weurt.

Residential and neighborhood statistics in Weurt

View current location data on residents, WOZ development, housing stock, energy consumption, business activity and safety in Weurt. In 2026 were there 2.577 residents. The average WOZ value in 2025 is EUR 409.000.

These figures help to better assess and compare the housing stock in Weurt with recent sold homes. Orient yourself then on suitable top real estate agents in Weurt for sales advice in this region.

Residents

2.577

Last year: 2026

Average WOZ

EUR 409.000

Last year: 2025

Average income per person.

EUR 32.300

Source: AllNumbers

Crimes (current year)

69

Total registered

Demographics and WOZ development

Inhabitants per year

Inhabitants per year in Weurt
Year Residents
2021 2.490
2022 2.515
2023 2.525
2024 2.560
2025 2.570
2026 2.577

Annual WOZ value

WOZ value per year in Weurt
Year Average WOZ
2021 EUR 274.000
2022 EUR 313.000
2023 EUR 377.000
2024 EUR 389.000
2025 EUR 409.000

Composition of residents

Age build-up

65+: 550 0-15: 415 15-25: 275 25-45: 630 45-65: 720

Education level

Hoger

580

Praktisch

510

Middelbaar

800

Origin of residents (2025)

Europa

140

Nederland

2.210

Buiten Europa

220

Housing stock and construction periods

Types of homes

Hoekwoningen 276
Appartementen 98
Tussenwoningen 358
Vrijstaande woningen 178
Twee-onder-één-kap woningen 174

Construction period of buildings

Voor 1700 2
1700 tot 1900 33
1900 tot 1925 43
1925 tot 1950 60
1950 tot 1970 593
1970 tot 1980 172
1980 tot 1990 131
1990 tot 2000 37
2000 tot 2010 53
2010 tot 2020 68
2020 en later 8

Energy and sustainability

Energy label distribution

Label C

335

Label D

225

Label A

169

Label B

96

Label G

87

Label F

66

Label E

47

Label A+++

18

Label A+

7

Label A++

6

Label A+++++

3

Label A++++

0

Average energy consumption per year

Average energy consumption per year in Weurt
Year Gas (m3) Electricity (kWh)
2020 1.460 3.280
2021 1.660 3.230
2022 1.290 3.070
2023 1.040 2.890
2024 1.020 3.040

Consumption per house type

Hoekwoning

Gas: 960 • Electricity: 2.760

Huurwoning

Gas: 900 • Electricity: 2.380

Koopwoning

Gas: 1.080 • Electricity: 3.030

Appartement

Gas: 790 • Electricity: 2.030

Tussenwoning

Gas: 900 • Electricity: 2.500

Vrijstaande woning

Gas: 1.530 • Electricity: 4.040

Twee-onder-één-kap woning

Gas: 1.110 • Electricity: 3.200

Business activity in Weurt (2025)

Handel en HORECA 80
Nijverheid en energie 75
Zakelijke dienstverlening 80
Overheid, onderwijs en zorg 65
Landbouw, bosbouw en visserij 5
Vervoer, informatie en communicatie 30
Financiele diensten en onroerendgoed 20
Cultuur, recreatie en overige diensten 40

Total number of company establishments: 390

Recent crime statistics

Recent crime statistics in Weurt
Period Crimes
jan 2026 3
jul 2025 6
jun 2025 5
mei 2025 7
mrt 2025 4
mrt 2026 6
nov 2024 6
nov 2025 2
okt 2024 9
okt 2025 5
sep 2024 3
sep 2025 9

These figures give an indicative picture of safety trends in the living environment of Weurt.

Frequently asked questions about living in Weurt

Short answers based on current local statistics, handy for a quick comparison of the living environment.

Hoeveel inwoners heeft Weurt?

Weurt telt in 2026 ongeveer 2.577 inwoners.

Wat is de gemiddelde WOZ-waarde in Weurt?

De gemiddelde WOZ-waarde in Weurt is in 2025 circa € 409.000.

Wat is het gemiddelde inkomen per inwoner in Weurt?

Het gemiddelde inkomen per inwoner in Weurt ligt rond € 32.300 per jaar.

Hoe veilig is wonen in Weurt?

Voor het huidige jaar gaat het om ongeveer 69 geregistreerde misdrijven. Gebruik deze cijfers als indicatie en vergelijk trends per periode.

Welke woningtypen komen het meest voor in Weurt?

In Weurt komt vooral "Tussenwoningen" veel voor, met ongeveer 358 woningen.

Receive free, non-binding quotes

Compare multiple real estate agents and choose the best match.