In Putte staat Geers Makelaardij en Taxatiebureau voor betrouwbare, persoonlijke en gedetailleerde hulp bij de koop, verkoop of huur van woningen. Met een sterke focus op klantgerichtheid en kennis van de regio, zorgen wij ervoor dat uw woonwensen realistisch en efficiënt worden gerealiseerd. Wij bieden diensten als aankoop, verhuur, taxaties en financieel advies aan. Onze werkwijze is transparant, gedetailleerd en gericht op uw voordee...
Current housing stock
-

- Available
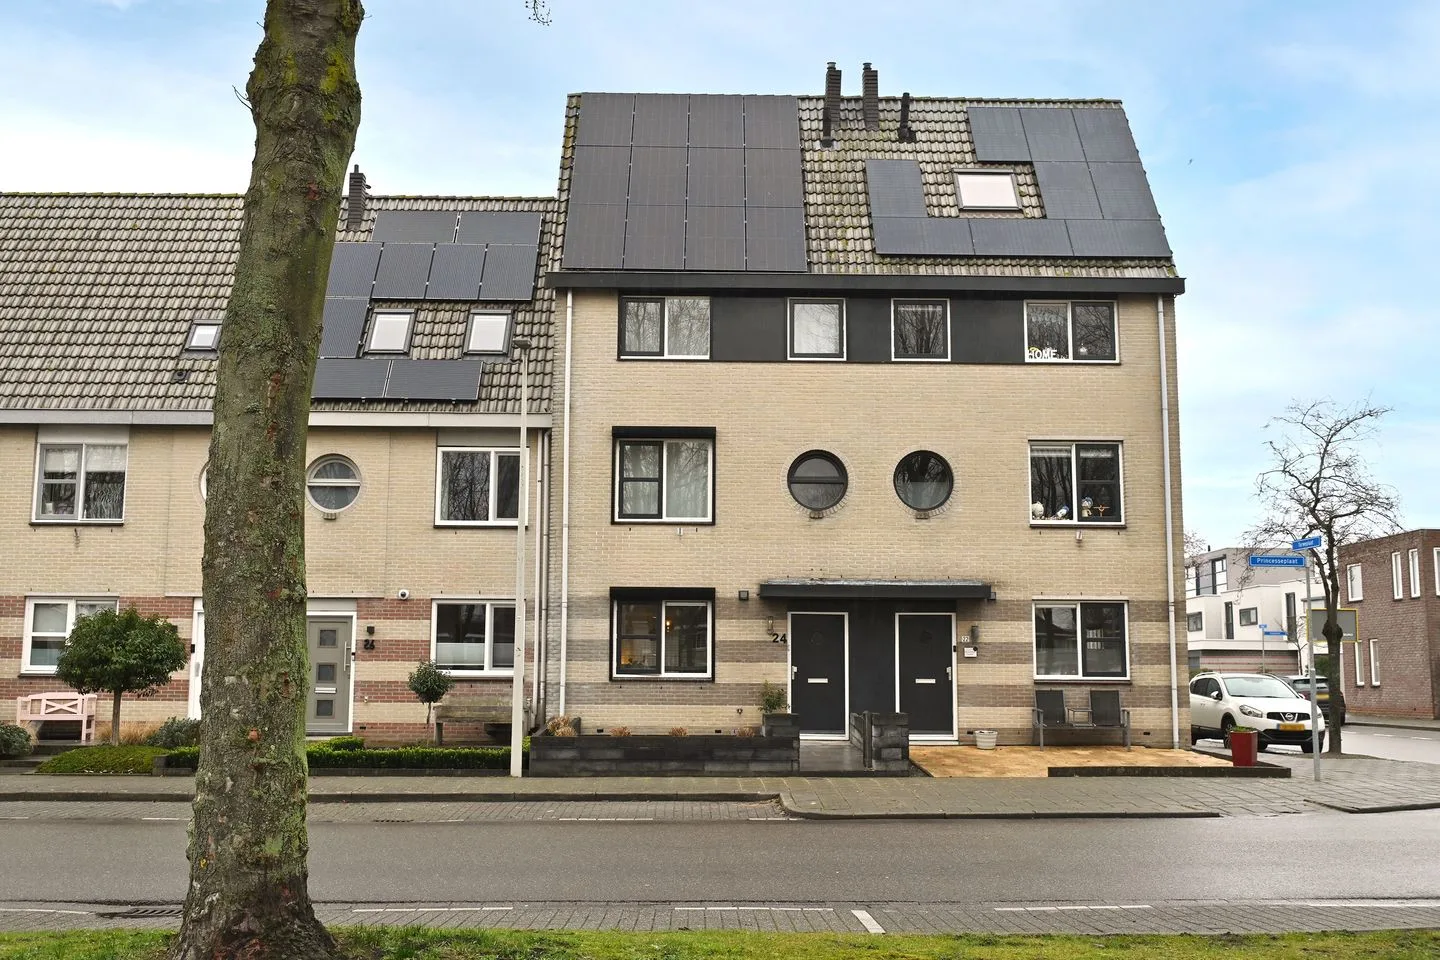
Achterstraat 6
4645CX Putte
€ 415.000 k.k.
€ 2.255/m²
ESave as favorite- Living area
- 184 m²
- Land area
- 483 m²
- Bedrooms
- 3
-

- Available
Dennenlaan 17
4645RP Putte
€ 598.000 k.k.
€ 4.068/m²
CSave as favorite- Living area
- 147 m²
- Land area
- 1555 m²
- Bedrooms
- 3
-

- Available
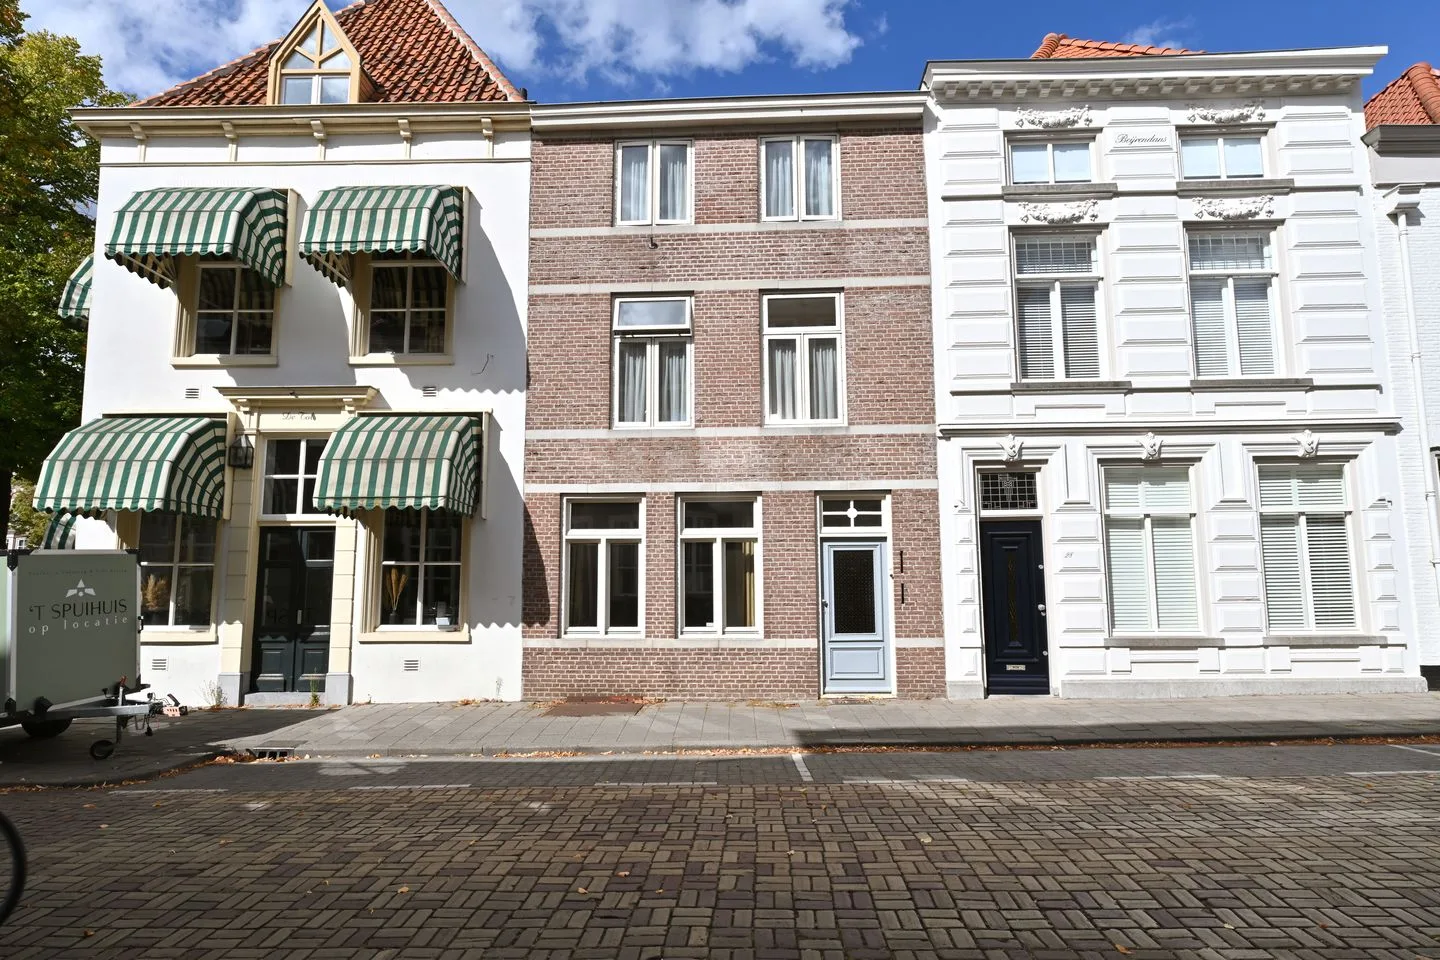
Bevrijdingstraat 74
4641BK Ossendrecht
€ 355.000 k.k.
€ 2.773/m²
ASave as favorite- Living area
- 128 m²
- Land area
- 229 m²
- Bedrooms
- 4
-
- Available
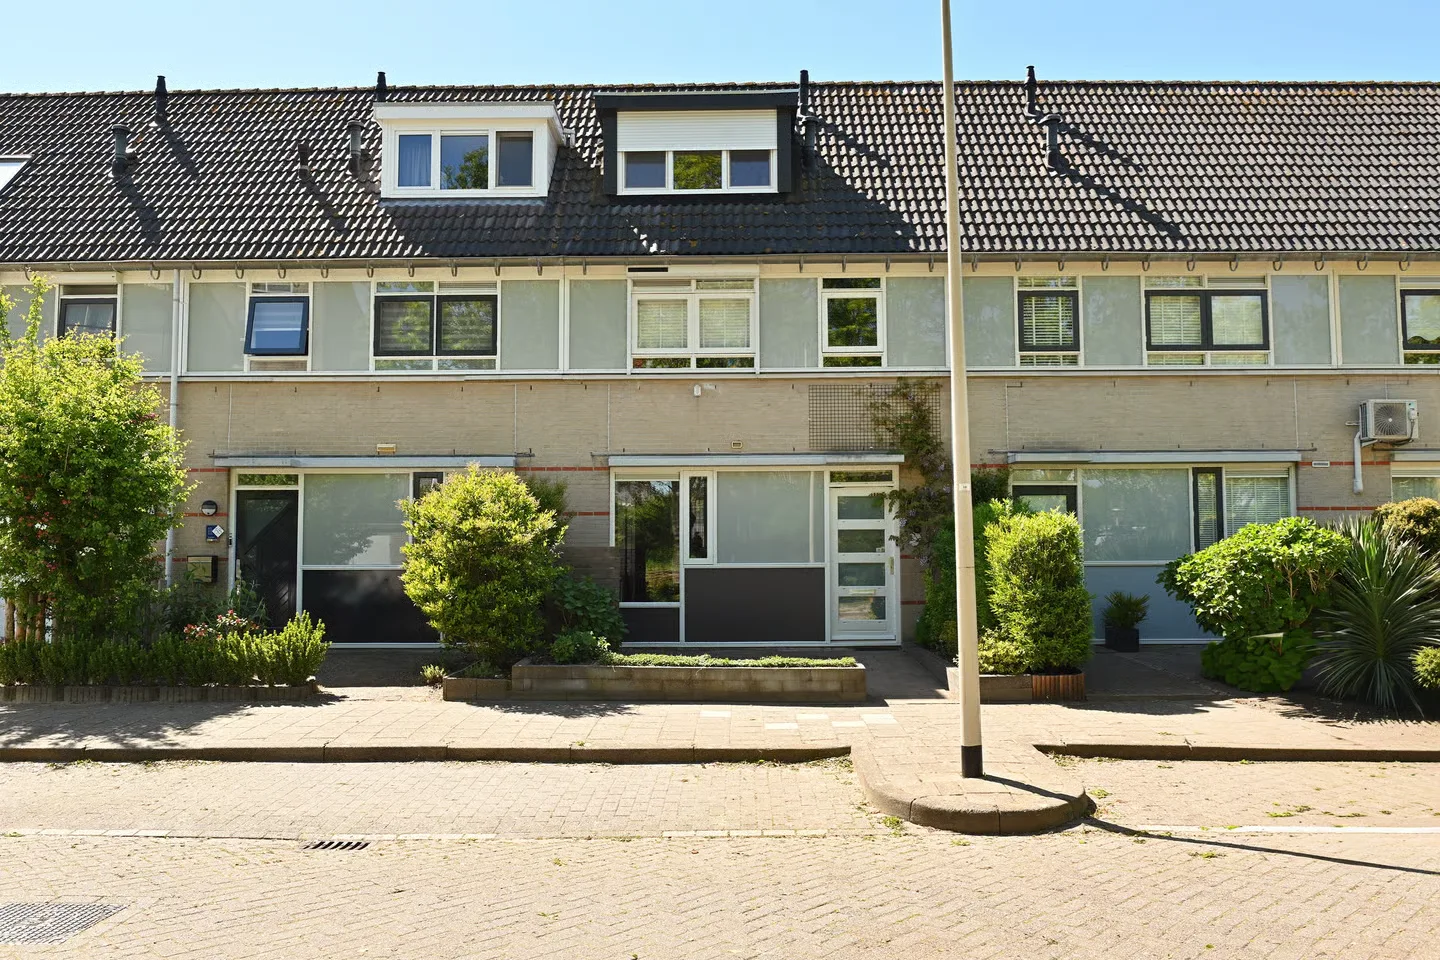
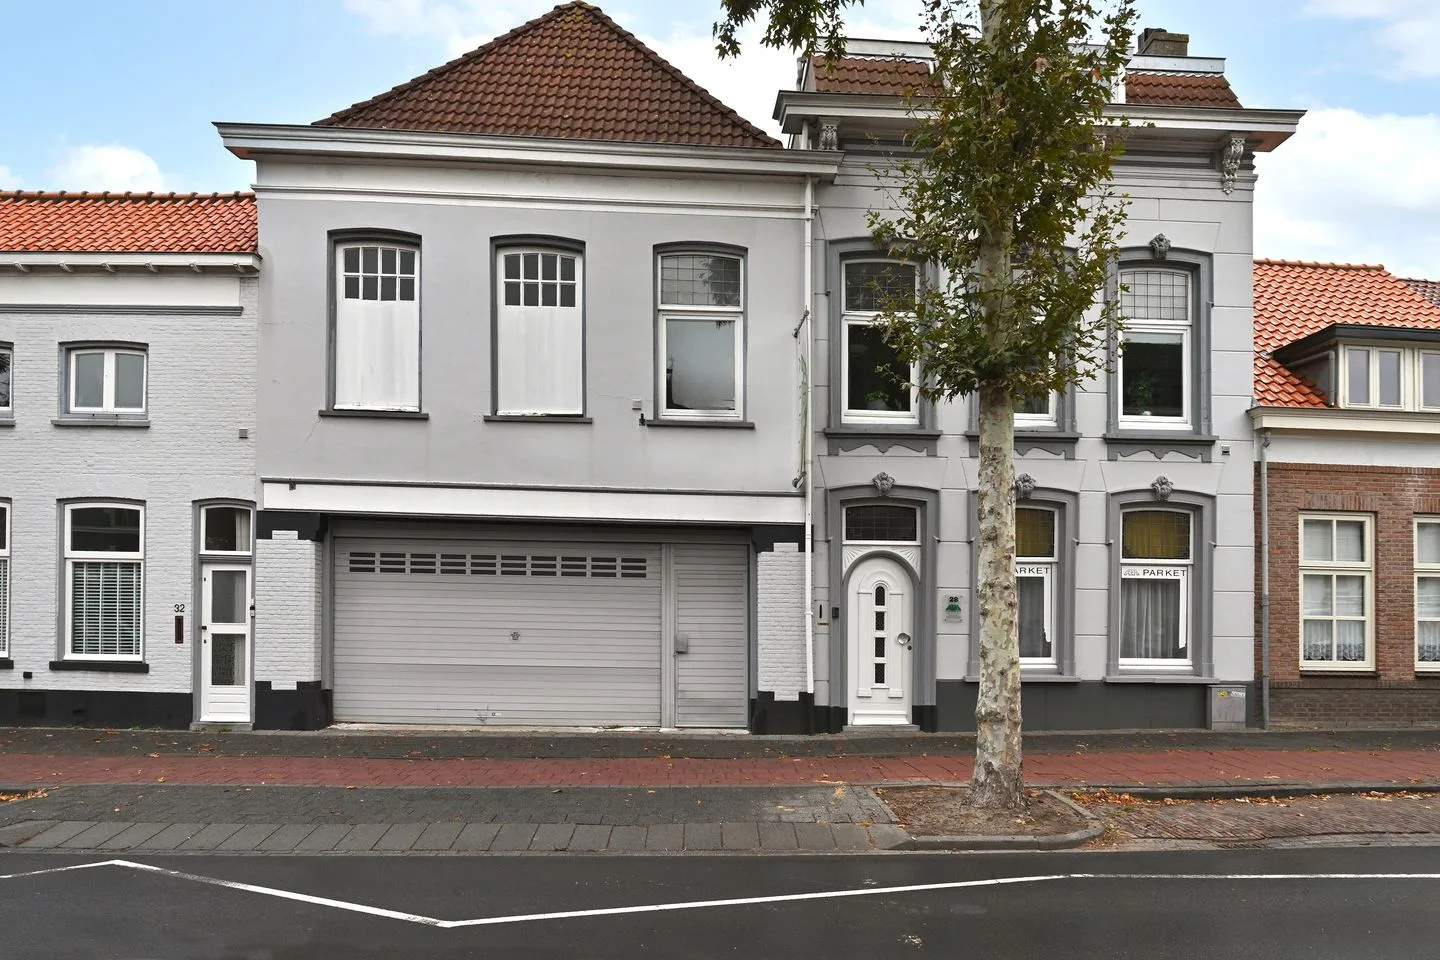
Sint Dionysiusstraat 31
4645HH Putte
€ 360.000 k.k.
€ 3.495/m²
FSave as favorite- Living area
- 103 m²
- Land area
- 346 m²
- Bedrooms
- 4
-
- Available
Hogebergdreef 9
4645ET Putte
€ 480.000 k.k.
€ 3.664/m²
FSave as favorite- Living area
- 131 m²
- Land area
- 696 m²
- Bedrooms
- 3
-

- Available
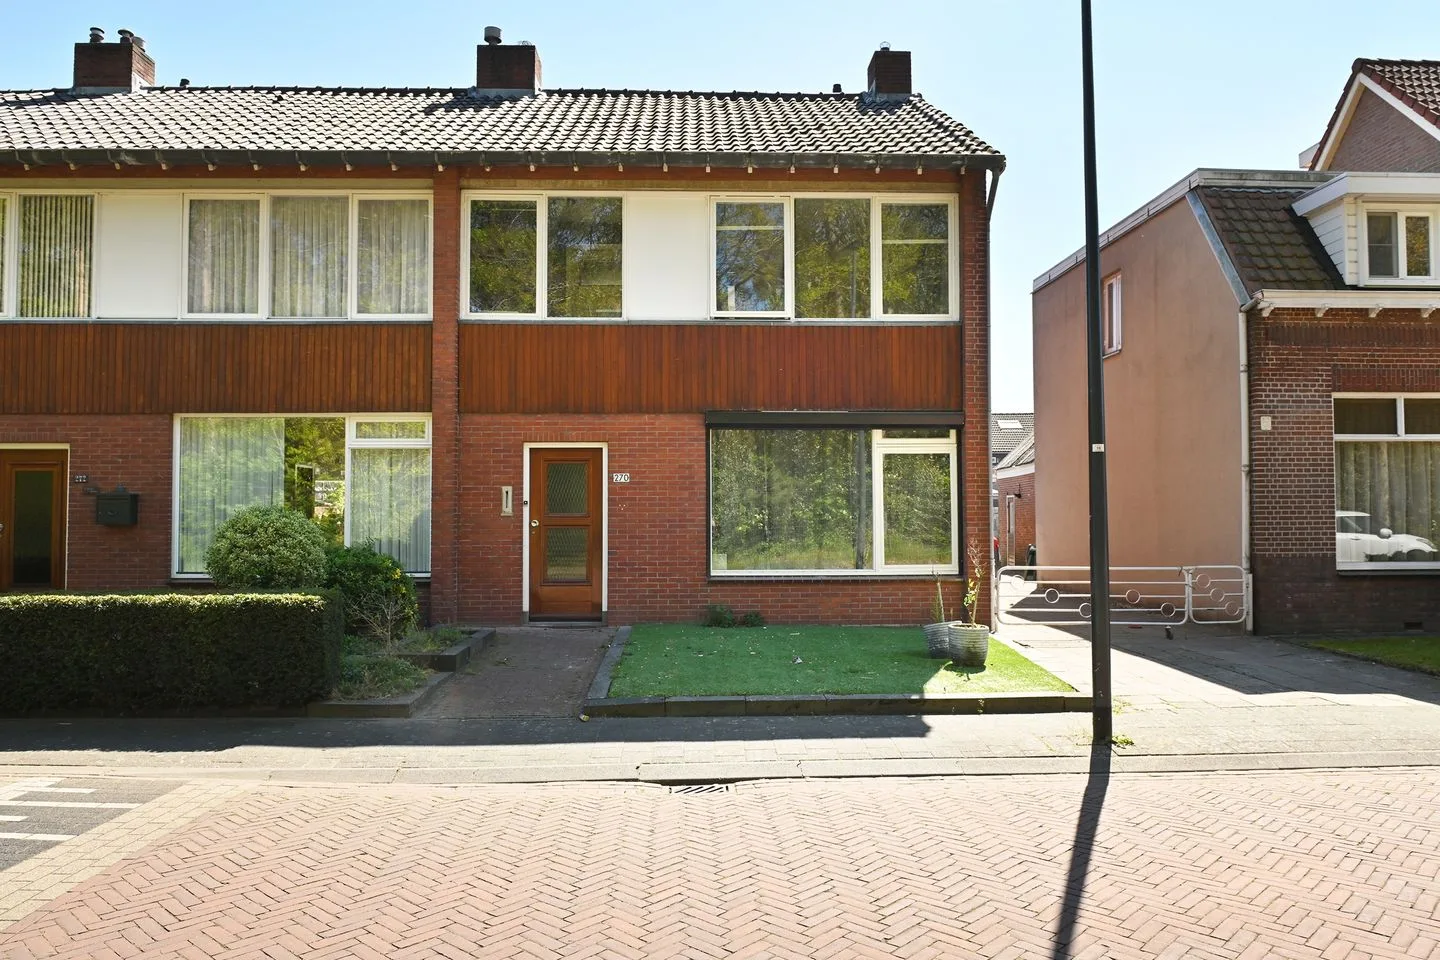
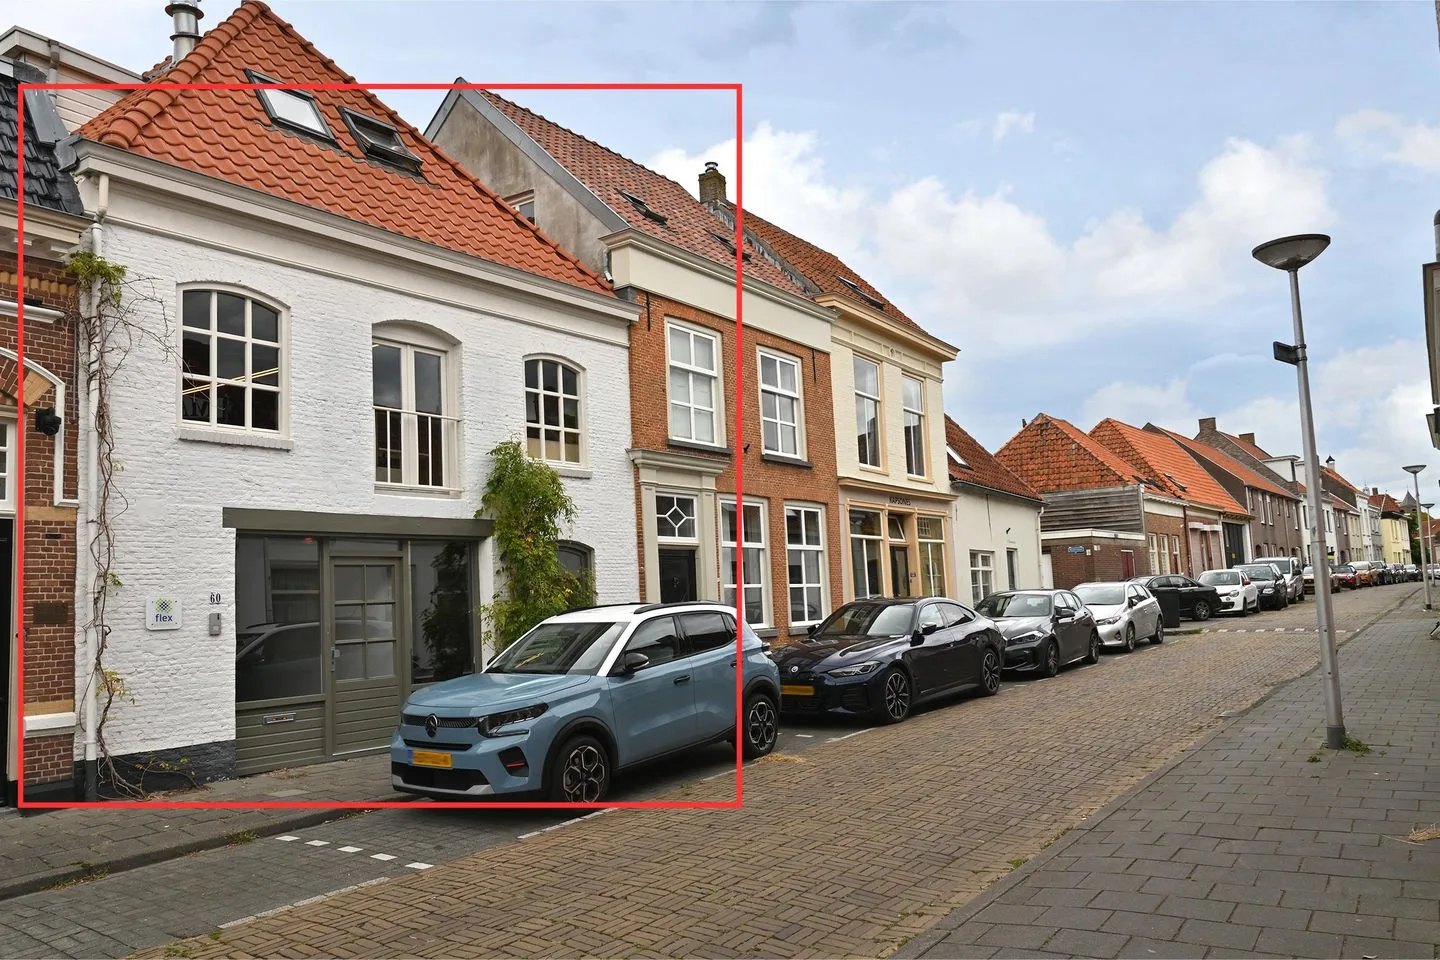
Bradfordstraat 29
4645HE Putte
€ 330.000 k.k.
€ 4.853/m²
ASave as favorite- Living area
- 68 m²
- Land area
- —
- Bedrooms
- 2
Reviews (16)
Review platforms
BronscoresTotal score
16 total reviews

Funda
7 reviews on Funda

9 reviews on Google
-
1e Verdelingsweg 662
10Translated by AIA pleasant real estate agent. Dedication, enthusiasm, speed of response and helpfulness, everything top! Definitely recommend.
-
Biezendreef 49
10Translated by AISelling a home is no job for an individual. Therefore, we have placed our trust in our local real estate agent. She has given us the necessary help in a friendly and above all professional manner.
-
Een funda gebruiker
10Translated by AIVery knowledgeable realtor, guided us kindly and professionally through the entire sales process.
-
Biezendreef 47
10Translated by AIFrom the first introduction, trust in this broker. Good explanation, good guidance and excellent finish. Were regularly kept informed
-
Vloedlijn 42
10Translated by AIMarjan is very pleasant to work with, thinking along with everything regarding the sale, just like with the photographer for example. She is also easily accessible for questions and advice.
-
Antwerpsestraat 181
9Translated by AIShe works quickly and carefully. She is to the point. And friendly. She is easily accessible. She knows the market.
-
Berkenlaan 7
9Translated by AIHighly engaged and decisive in sales and the period thereafter. Good knowledge of the real estate market
-
Flavia Geuens
10Translated by AIHad a great new wave party
-
B. Y.
10 -
Hubert EULER
6 -
Frans
10 -
Paal Zeventien
2 -
Key-Factor Support
10 -
JorgenMSnoep
10Translated by AIProfessional, helpful, knowledgeable. Marjan especially thinks along with you. All good then.
-
Stephan Verswijver
8 -
Thea Kil
8