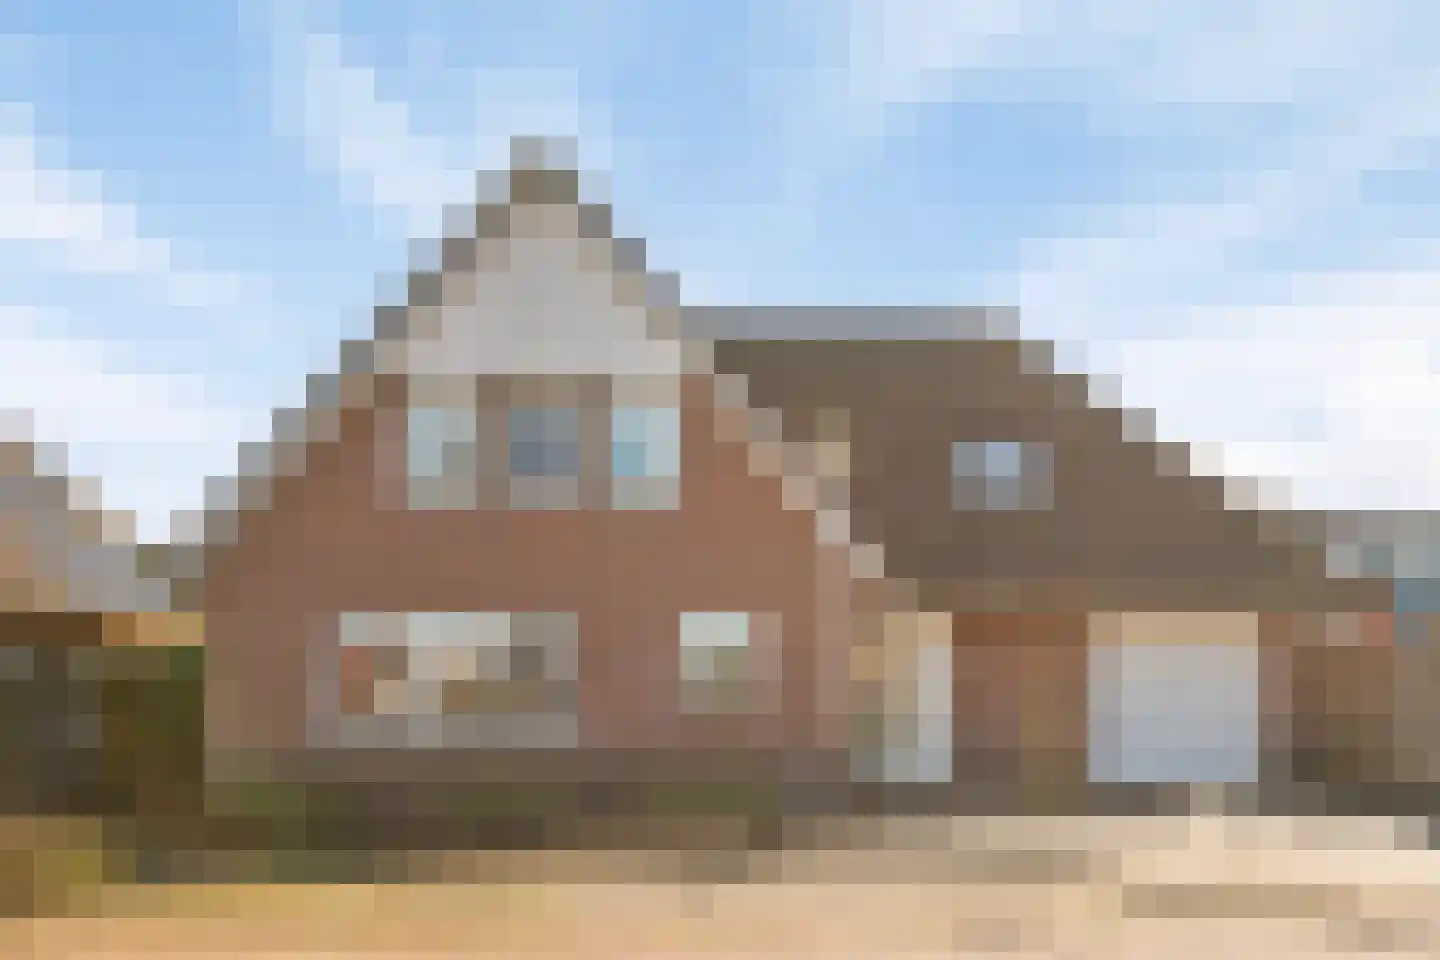
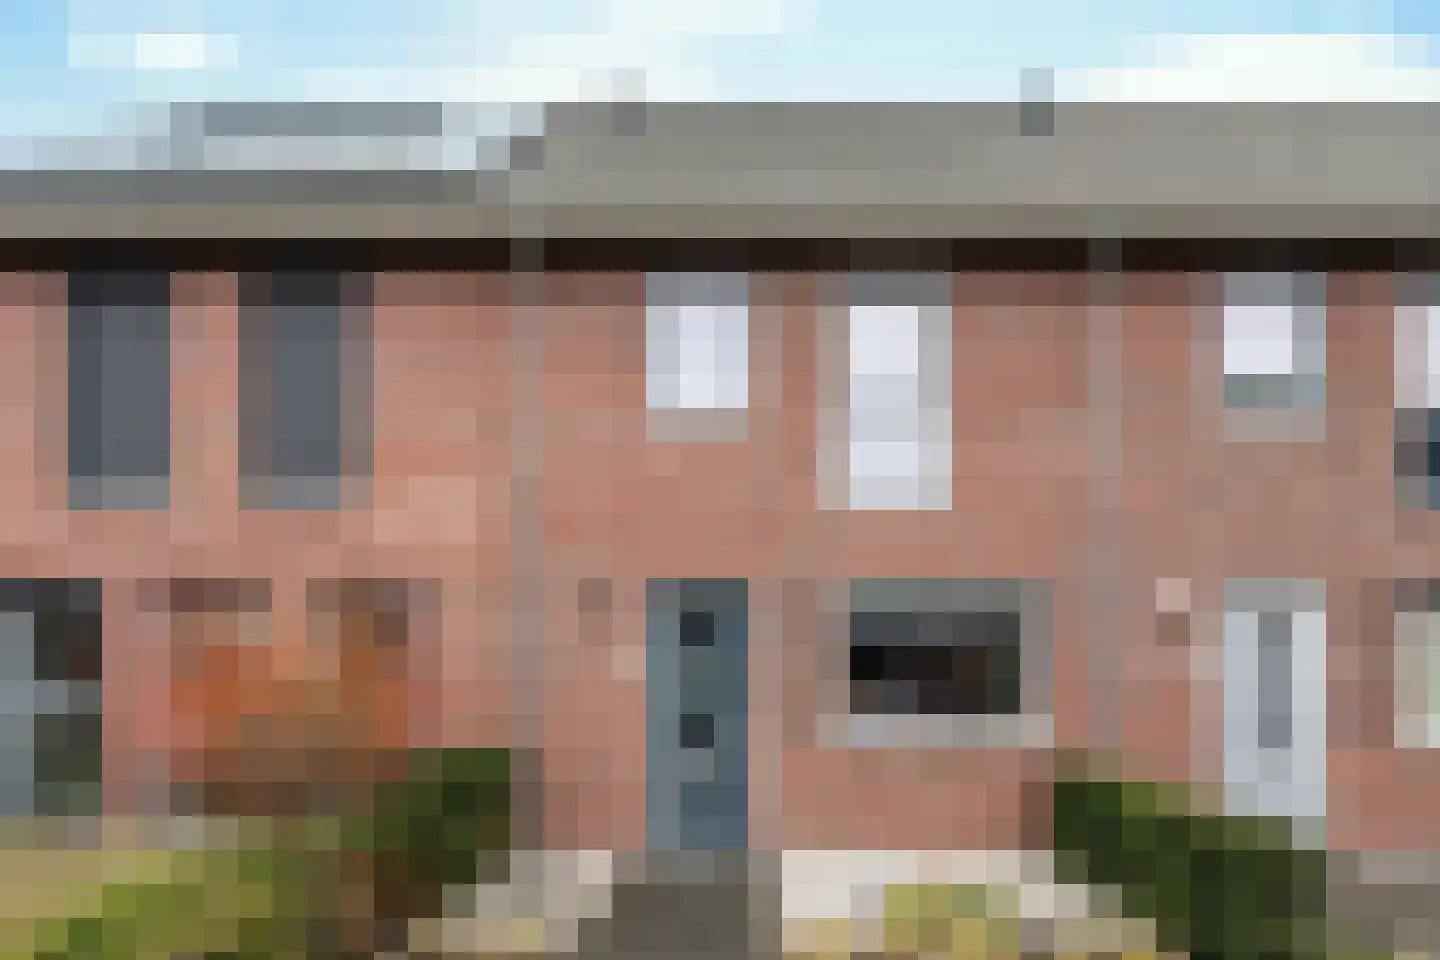
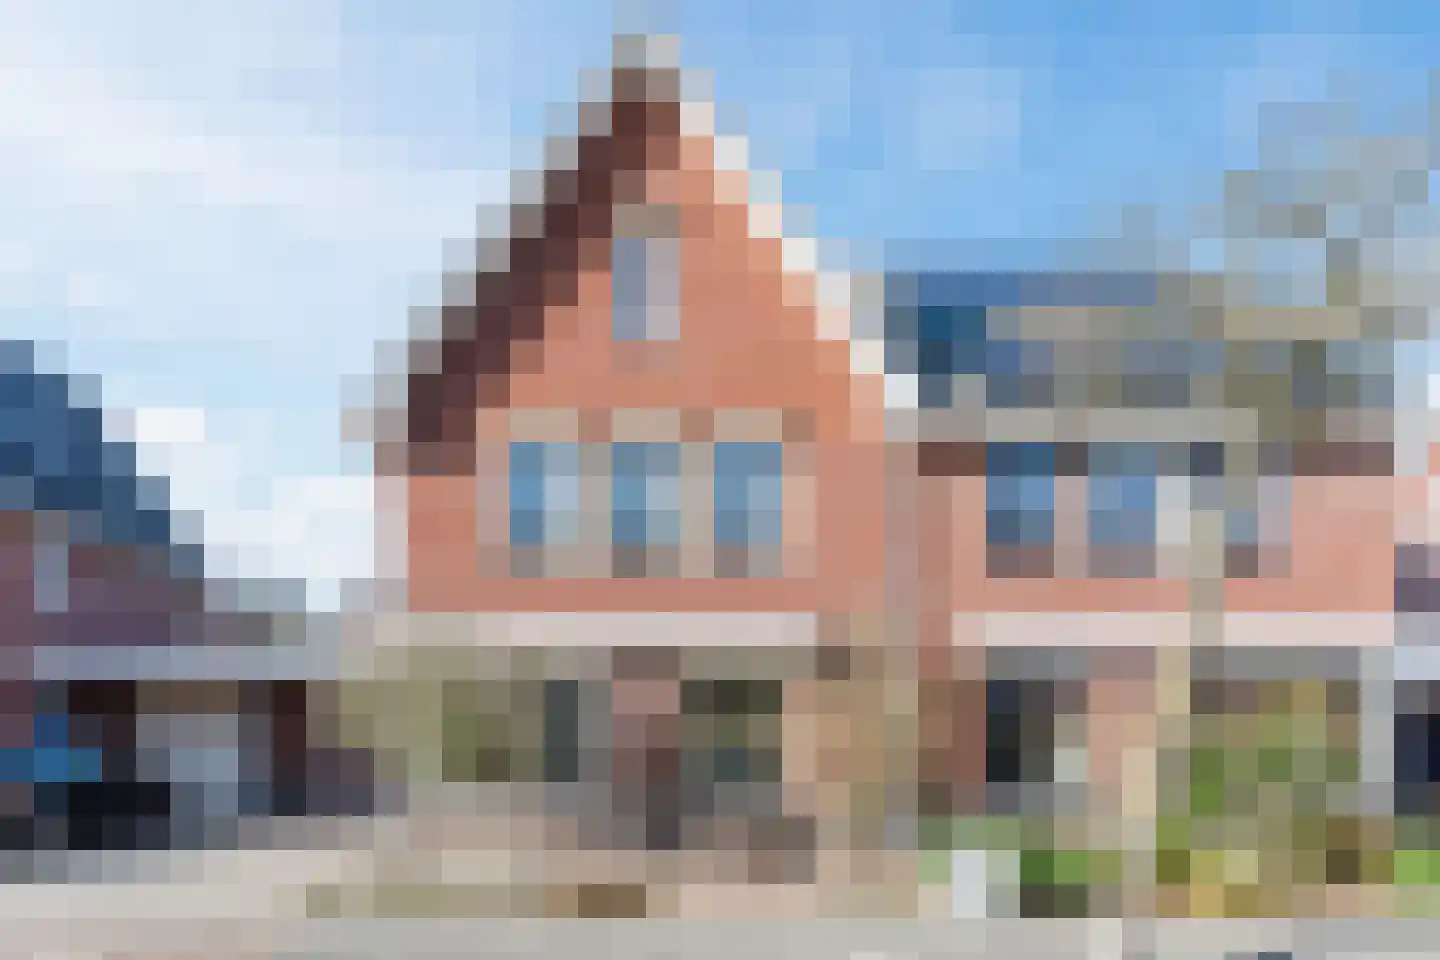
- Sold
Purperhei 8
5685GL Best
€ 650.000 k.k.
€ 3.757/m²
- Living area
- 173 m²
- Land area
- 285 m²
- Bedrooms
- 3
Searching in 410 houses in Best
Type to search. Use arrow down and arrow up to navigate through results and press Enter to open.
Hidden search suggestions.
View current properties in Best or search targeted on street, postal code and property characteristics.
View the current housing stock in Best and quickly filter by price, living area, rooms and more. There are currently 410 houses in this place within our selection. View also 276 sold houses in Best for extra insight into the local housing market.
5685GL Best
€ 650.000 k.k.
€ 3.757/m²
5684XH Best
€ 359.500 k.k.
€ 3.524/m²
5682GG Best
€ 450.000 k.k.
€ 4.128/m²
5683ET Best
€ 425.000 k.k.
€ 4.829/m²
5682HE Best
€ 595.000 k.k.
€ 4.612/m²
5685AM Best
€ 465.000 k.k.
€ 4.078/m²
5685JN Best
€ 510.000 k.k.
€ 4.285/m²
5684GS Best
€ 670.000 k.k.
€ 4.135/m²
5685JN Best
€ 585.000 k.k.
€ 5.132/m²
5684NB Best
€ 650.000 k.k.
€ 5.242/m²
5683DM Best
€ 475.000 k.k.
€ 5.588/m²
5685JM Best
€ 975.000 k.k.
€ 5.540/m²
5684HH Best
€ 475.000 k.k.
€ 3.992/m²
5684TK Best
€ 399.500 k.k.
€ 3.995/m²
5684GC Best
€ 535.000 k.k.
€ 3.639/m²
5682PD Best
€ 965.000 k.k.
€ 6.992/m²
5683NV Best
€ 375.000 k.k.
€ 4.688/m²
5683HR Best
€ 369.000 k.k.
€ 4.011/m²
5682HK Best
€ 450.000 k.k.
€ 4.639/m²
5684MA Best
€ 535.000 k.k.
€ 4.572/m²
5684GE Best
€ 475.000 k.k.
€ 3.253/m²
5683LW Best
€ 799.000 k.k.
€ 4.015/m²
5685BL Best
€ 639.000 k.k.
€ 4.437/m²
5684KX Best
€ 525.000 k.k.
€ 4.565/m²
5684LJ Best
€ 549.000 k.k.
€ 4.945/m²
5685GD Best
€ 750.000 k.k.
€ 3.456/m²
5683HW Best
€ 475.000 k.k.
€ 4.398/m²
5684KX Best
€ 515.000 k.k.
€ 4.639/m²
Get free quotes from real estate agents with local market knowledge. Compare more than 87 real estate agents in Best.
Selling a home in Best? View the sales-oriented guide sell a house in Best, compare all real estate agents in Best or view the top 10 real estate agents in Best for extra context to your choice.
Real estate agents make sharper offers when they know you're comparing — ask for quotes for sale or purchase.
Practical answers about housing supply, sales and comparing real estate agents in Best.
The costs of a real estate agent in Best depend on commission, setup costs, property presentation and the chosen service. Compare the 87 real estate agents in Best via the real estate agent page and request multiple quotes to compare rates and approach well.
Within our selection, we are currently showing 410 houses in Best. View also the sold houses in Best to compare the current offering with recent transactions.
Take into account not only price and living area but also maintenance, energy label, location, outdoor space and sales status. This way you compare houses in Best on more than just the asking price.
A local real estate agent knows the neighborhoods, recent transactions and demand in Best. By comparing 87 real estate agents in the region you get a better insight into prices, sales strategy and expected yield; the top 10 in Best provides a useful starting point.
Yes, when making a sales plan, a valuation in Best is wise. You gain insight into a realistic asking price and can then compare offers from real estate agents specifically.
View current location data on residents, WOZ development, housing stock, energy consumption, business activity and safety in Best. In 2026 were there 31.694 residents. The average WOZ value in 2025 is EUR 464.000.
These figures help to better assess and compare the housing stock in Best with recent sold homes. Orient yourself then on suitable top real estate agents in Best for sales advice in this region.
Residents
31.694
Last year: 2026
Average WOZ
EUR 464.000
Last year: 2025
Average income per person.
EUR 37.200
Source: AllNumbers
Crimes (current year)
1.240
Total registered
| Year | Residents |
|---|---|
| 2022 | 30.608 |
| 2023 | 30.897 |
| 2024 | 31.223 |
| 2025 | 31.652 |
| 2026 | 31.694 |
| Year | Average WOZ |
|---|---|
| 2021 | EUR 321.000 |
| 2022 | EUR 359.000 |
| 2023 | EUR 403.000 |
| 2024 | EUR 431.000 |
| 2025 | EUR 464.000 |
Hoger
38
Praktisch
22
Middelbaar
39
Europa
2.888
Nederland
24.386
Buiten Europa
4.378
Label A
3.807
Label C
3.631
Label B
3.027
Label D
852
Label E
828
Label F
606
Label A+++
585
Label A++++
481
Label G
349
Label A+
274
Label A++
118
Label A+++++
5
| Year | Gas (m3) | Electricity (kWh) |
|---|---|---|
| 2020 | 1.250 | 3.170 |
| 2021 | 1.370 | 3.200 |
| 2022 | 1.060 | 2.980 |
| 2023 | 890 | 2.840 |
| 2024 | 860 | 2.940 |
Hoekwoning
Gas: 940 • Electricity: 2.930
Huurwoning
Gas: 700 • Electricity: 2.140
Koopwoning
Gas: 970 • Electricity: 3.130
Appartement
Gas: 560 • Electricity: 1.870
Tussenwoning
Gas: 830 • Electricity: 2.690
Vrijstaande woning
Gas: 1.410 • Electricity: 4.350
Twee-onder-één-kap woning
Gas: 1.080 • Electricity: 3.330
Total number of company establishments: 4.005
| Period | Crimes |
|---|---|
| jan 2025 | 83 |
| jan 2026 | 120 |
| jul 2025 | 113 |
| jun 2025 | 111 |
| mei 2025 | 118 |
| mrt 2025 | 87 |
| nov 2024 | 100 |
| nov 2025 | 102 |
| okt 2024 | 94 |
| okt 2025 | 105 |
| sep 2024 | 89 |
| sep 2025 | 109 |
These figures give an indicative picture of safety trends in the living environment of Best.
Short answers based on current local statistics, handy for a quick comparison of the living environment.
Best telt in 2026 ongeveer 31.694 inwoners.
De gemiddelde WOZ-waarde in Best is in 2025 circa € 464.000.
Het gemiddelde inkomen per inwoner in Best ligt rond € 37.200 per jaar.
Voor het huidige jaar gaat het om ongeveer 1.240 geregistreerde misdrijven. Gebruik deze cijfers als indicatie en vergelijk trends per periode.
In Best komt vooral "Tussenwoningen" veel voor, met ongeveer 5.709 woningen.