- Available
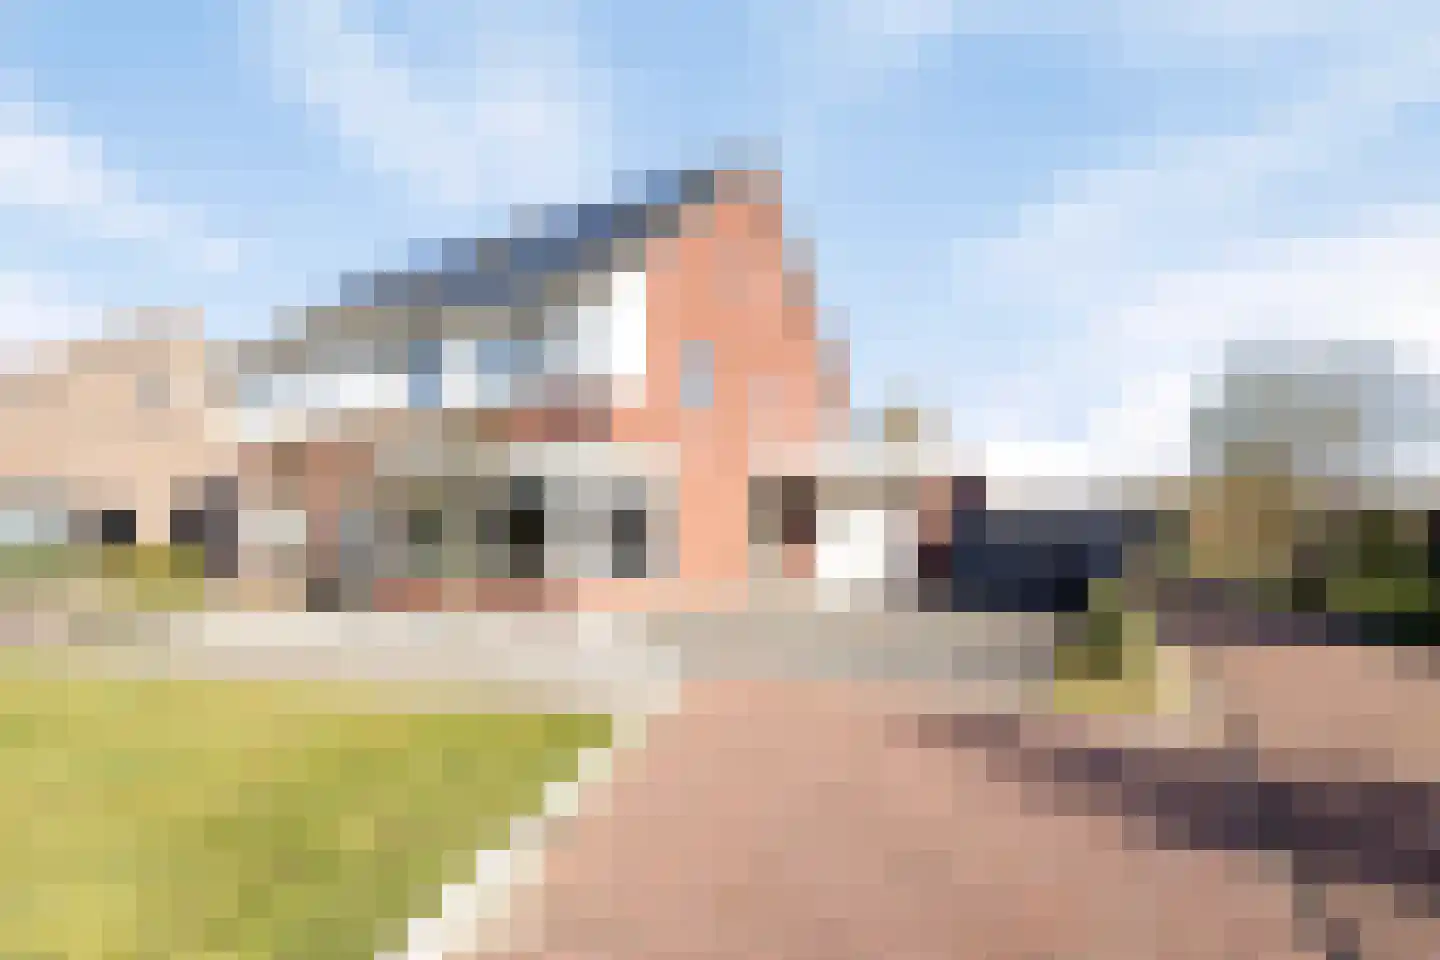
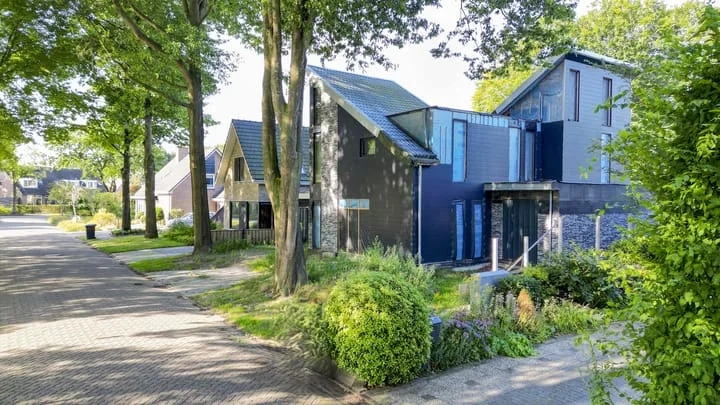
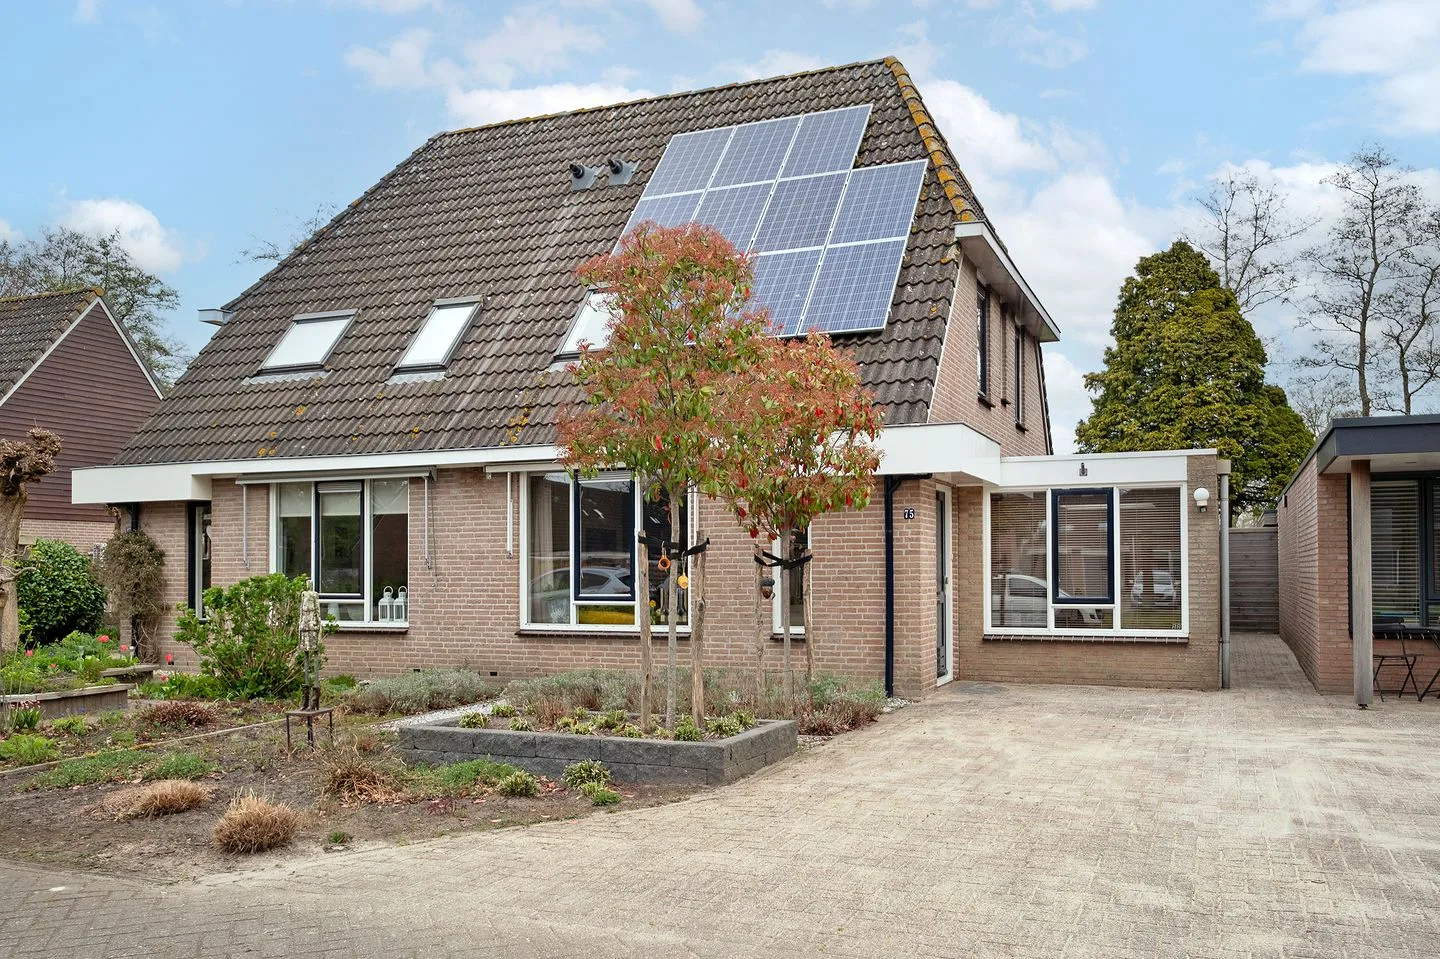
Hendrik Tillemaweg 75
7957DC de Wijk
€ 400.000 k.k.
€ 3.175/m²
- Living area
- 126 m²
- Land area
- 271 m²
- Bedrooms
- 4
Searching in 28 houses in De Wijk
Type to search. Use arrow down and arrow up to navigate through results and press Enter to open.
Hidden search suggestions.
View current properties in De Wijk or search targeted on street, postal code and property characteristics.
View the current housing stock in De Wijk and quickly filter by price, living area, rooms and more. There are currently 28 houses in this place within our selection. View also 22 sold houses in De Wijk for extra insight into the local housing market.
7957DC de Wijk
€ 400.000 k.k.
€ 3.175/m²
7957EM de Wijk
€ 649.000 k.k.
€ 3.150/m²
7957EJ de Wijk
€ 550.000 k.k.
€ 4.622/m²
7957NC de Wijk
€ 595.000 k.k.
€ 2.742/m²
7957CT de Wijk
€ 349.000 k.k.
€ 3.262/m²
7957AX de Wijk
€ 375.000 k.k.
€ 5.435/m²
7957DA de Wijk
€ 480.000 k.k.
€ 3.664/m²
7957EB de Wijk
€ 434.500 k.k.
€ 4.218/m²
7957CW de Wijk
€ 565.000 k.k.
€ 3.869/m²
7957AL de Wijk
€ 350.000 k.k.
€ 3.465/m²
7957BP de Wijk
€ 360.000 k.k.
€ 3.600/m²
7957AG de Wijk
€ 515.000 k.k.
€ 4.769/m²
7957EK de Wijk
€ 598.000 k.k.
€ 4.671/m²
7957BK de Wijk
€ 460.000 k.k.
€ 4.509/m²
7957CG de Wijk
€ 695.000 k.k.
€ 3.278/m²
7957EM de Wijk
€ 945.000 k.k.
€ 4.947/m²
7957CS de Wijk
€ 425.000 k.k.
€ 4.086/m²
7957EK de Wijk
€ 530.000 k.k.
€ 5.520/m²
7957DA de Wijk
€ 649.500 k.k.
€ 3.843/m²
7957NE de Wijk
€ 798.000 k.k.
€ 3.764/m²
7957EN de Wijk
€ 465.000 k.k.
€ 3.274/m²
7957CS de Wijk
€ 300.000 k.k.
€ 1.339/m²
7957BW de Wijk
€ 275.000 k.k.
€ 3.235/m²
7957CE de Wijk
€ 375.000 k.k.
€ 2.641/m²
7957AK de Wijk
€ 282.500 k.k.
€ 0/m²
7957CK de Wijk
€ 299.000 k.k.
€ 3.691/m²
7957NE de Wijk
€ 750.000 k.k.
€ 6.048/m²
7957EM de Wijk
€ 385.000 k.k.
€ 4.325/m²
Get free quotes from real estate agents with local market knowledge. Compare more than 17 real estate agents in De Wijk.
Selling a home in De Wijk? Compare all real estate agents in De Wijk or view the top 10 real estate agents in De Wijk for extra context for your choice.
Real estate agents make sharper offers when they know you're comparing — ask for quotes for sale or purchase.
Practical answers about housing supply, sales and comparing real estate agents in De Wijk.
The costs of a real estate agent in De Wijk depend on commission, setup costs, property presentation and the chosen service. Compare the 17 real estate agents in De Wijk via the real estate agent page and request multiple quotes to compare rates and approach well.
Within our selection, we are currently showing 28 houses in De Wijk. View also the sold houses in De Wijk to compare the current offering with recent transactions.
Take into account not only price and living area but also maintenance, energy label, location, outdoor space and sales status. This way you compare houses in De Wijk on more than just the asking price.
A local real estate agent knows the neighborhoods, recent transactions and demand in De Wijk. By comparing 17 real estate agents in the region you get a better insight into prices, sales strategy and expected yield; the top 10 in De Wijk provides a useful starting point.
Yes, when making a sales plan, a valuation in De Wijk is wise. You gain insight into a realistic asking price and can then compare offers from real estate agents specifically.
View current location data on residents, WOZ development, housing stock, energy consumption, business activity and safety in De Wijk. In 2026 were there 2.972 residents. The average WOZ value in 2025 is EUR 387.000.
These figures help to better assess and compare the housing stock in De Wijk with recent sold homes. Orient yourself then on suitable top real estate agents in De Wijk for sales advice in this region.
Residents
2.972
Last year: 2026
Average WOZ
EUR 387.000
Last year: 2025
Average income per person.
EUR 35.000
Source: AllNumbers
Crimes (current year)
55
Total registered
| Year | Residents |
|---|---|
| 2021 | 2.965 |
| 2022 | 2.960 |
| 2023 | 2.985 |
| 2024 | 2.990 |
| 2025 | 2.985 |
| 2026 | 2.972 |
| Year | Average WOZ |
|---|---|
| 2021 | EUR 270.000 |
| 2022 | EUR 301.000 |
| 2023 | EUR 352.000 |
| 2024 | EUR 373.000 |
| 2025 | EUR 387.000 |
Hoger
700
Praktisch
600
Middelbaar
840
Europa
95
Nederland
2.725
Buiten Europa
160
Label C
344
Label A
323
Label B
188
Label D
172
Label G
143
Label F
72
Label E
40
Label A+++
27
Label A+
22
Label A++
13
Label A++++
4
Label A+++++
0
| Year | Gas (m3) | Electricity (kWh) |
|---|---|---|
| 2020 | 1.470 | 2.950 |
| 2021 | 1.660 | 2.970 |
| 2022 | 1.300 | 2.780 |
| 2023 | 1.100 | 2.660 |
| 2024 | 1.060 | 2.780 |
Hoekwoning
Gas: 910 • Electricity: 1.990
Huurwoning
Gas: 900 • Electricity: 1.830
Koopwoning
Gas: 1.200 • Electricity: 3.060
Appartement
Gas: 960 • Electricity: 2.180
Tussenwoning
Gas: 900 • Electricity: 2.040
Vrijstaande woning
Gas: 1.380 • Electricity: 3.530
Twee-onder-één-kap woning
Gas: 1.070 • Electricity: 2.670
Total number of company establishments: 350
| Period | Crimes |
|---|---|
| jan 2026 | 0 |
| jul 2025 | 2 |
| jun 2025 | 1 |
| mei 2025 | 2 |
| mrt 2025 | 14 |
| mrt 2026 | 4 |
| nov 2024 | 3 |
| nov 2025 | 6 |
| okt 2024 | 5 |
| okt 2025 | 5 |
| sep 2024 | 7 |
| sep 2025 | 5 |
These figures give an indicative picture of safety trends in the living environment of De Wijk.
Short answers based on current local statistics, handy for a quick comparison of the living environment.
De Wijk telt in 2026 ongeveer 2.972 inwoners.
De gemiddelde WOZ-waarde in De Wijk is in 2025 circa € 387.000.
Het gemiddelde inkomen per inwoner in De Wijk ligt rond € 35.000 per jaar.
Voor het huidige jaar gaat het om ongeveer 55 geregistreerde misdrijven. Gebruik deze cijfers als indicatie en vergelijk trends per periode.
In De Wijk komt vooral "Vrijstaande woningen" veel voor, met ongeveer 481 woningen.