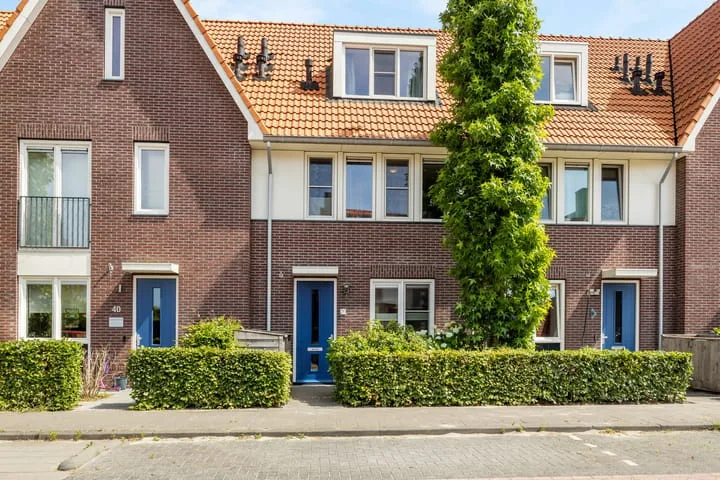
- Sold
Boslaan 37
4849PJ Dorst
€ 1.895.000 k.k.
€ 7.288/m²
- Living area
- 260 m²
- Land area
- 26670 m²
- Bedrooms
- 2
View 22 sold houses in Dorst
Type to search. Use arrow down and arrow up to navigate through results and press Enter to open.
Hidden search suggestions.
Compare sold homes in Dorst or view the current offering in this location directly.
On this page you will find recently sold homes in Dorst. Use this overview to better estimate selling prices, popular neighborhoods, and the local housing supply before you choose a real estate agent. Also view the current housing supply with 33 houses in Dorst.
4849PJ Dorst
€ 1.895.000 k.k.
€ 7.288/m²
4849BP Dorst
€ 850.000 k.k.
€ 4.802/m²
4849BP Dorst
€ 720.000 k.k.
€ 4.260/m²
4849CK Dorst
€ 449.000 k.k.
€ 4.236/m²
4849AN Dorst
€ 545.000 k.k.
€ 5.396/m²
4849BC Dorst
€ 375.000 k.k.
€ 4.518/m²
4849RN Dorst
€ 495.000 k.k.
€ 4.380/m²
4849CB Dorst
€ 519.000 k.k.
€ 3.506/m²
4849AL Dorst
€ 350.000 k.k.
€ 2.229/m²
4849AR Dorst
€ 375.000 k.k.
€ 3.024/m²
4849PT Dorst
€ 450.000 k.k.
€ 3.600/m²
4849BM Dorst
€ 300.000 k.k.
€ 4.000/m²
4849BA Dorst
€ 350.000 k.k.
€ 4.268/m²
4849BE Dorst
€ 400.000 k.k.
€ 4.123/m²
4849AN Dorst
€ 389.000 k.k.
€ 0/m²
4849CT Dorst
€ 595.000 k.k.
€ 4.612/m²
4849CZ Dorst
€ 525.000 k.k.
€ 3.977/m²
4849AM Dorst
€ 450.000 k.k.
€ 3.383/m²
4849CL Dorst
€ 840.000 k.k.
€ 5.562/m²
4849RM Dorst
€ 795.000 k.k.
€ 5.408/m²
4849AR Dorst
€ 419.000 k.k.
€ 3.844/m²
4849AD Dorst
€ 600.000 k.k.
€ 5.084/m²
Bekijk recente verkopen en ontvang gratis offertes van lokale makelaars. Vergelijk meer dan 97 makelaars in Dorst.
Zelf je woning verkopen in Dorst? Vergelijk verkoopmakelaars in Dorst of bekijk de beste verkoopmakelaars in Dorst als referentie bij jouw keuze.
Makelaars maken scherpere voorstellen als ze weten dat je vergelijkt — vraag offertes aan voor verkoop of aankoop.
Short answers about housing prices, sold homes and comparing real estate agents in Dorst.
De kosten van een makelaar in Dorst verschillen per kantoor, woningtype en verkoopaanpak. In Dorst kun je 97 real estate agents vergelijken; bekijk daarom ook de makelaars in Dorst om tarieven, presentatie en lokale ervaring beter naast elkaar te zetten.
On this page we currently show 22 sold houses in Dorst from our selection. This helps you to better assess recent transactions and the local housing market.
Houses sold in Dorst give insight into asking prices, house types and neighborhoods where recent transactions have taken place. Compare this also with the current housing stock in Dorst to better understand the market.
You can use sold homes as a first market indication, but a local real estate agent can better take into account finishing, location, maintenance and current demand in Dorst.
Vergelijk de 97 real estate agents in Dorst op lokale verkoopervaring, reviews, verwachte opbrengst, courtage en marketingaanpak. Bekijk verkoopmakelaars in Dorst of de top 10 makelaars in Dorst om snel sterke kantoren te ontdekken.
View current location data on residents, WOZ development, housing stock, energy consumption, business activity and safety in Dorst. In 2025 were there 3.148 residents. The average WOZ value in 2025 is EUR 501.405.
These figures help to better assess and compare the housing stock in Dorst with recent sold homes. Orient yourself then on suitable top real estate agents in Dorst for sales advice in this region.
Residents
3.148
Last year: 2025
Average WOZ
EUR 501.405
Last year: 2025
Average income per person.
EUR 33.837
Source: AllNumbers
Crimes (current year)
81
Total registered
| Year | Residents |
|---|---|
| 2021 | 3.028 |
| 2022 | 3.157 |
| 2023 | 3.163 |
| 2024 | 3.158 |
| 2025 | 3.148 |
| Year | Average WOZ |
|---|---|
| 2021 | EUR 357.028 |
| 2022 | EUR 387.818 |
| 2023 | EUR 450.842 |
| 2024 | EUR 472.846 |
| 2025 | EUR 501.405 |
Hoger
930
Praktisch
355
Middelbaar
825
Europa
176
Nederland
2.830
Buiten Europa
142
Label A
389
Label C
220
Label B
172
Label D
114
Label F
109
Label E
97
Label G
92
Label A+
30
Label A++
13
Label A+++
7
Label A++++
4
Label A+++++
0
| Year | Gas (m3) | Electricity (kWh) |
|---|---|---|
| 2020 | 1.345 | 3.392 |
| 2021 | 1.537 | 3.503 |
| 2022 | 1.153 | 3.317 |
| 2023 | 968 | 3.185 |
| 2024 | 939 | 3.358 |
Hoekwoning
Gas: 882 • Electricity: 2.735
Huurwoning
Gas: 748 • Electricity: 2.186
Koopwoning
Gas: 995 • Electricity: 3.329
Appartement
Gas: 285 • Electricity: 1.328
Tussenwoning
Gas: 777 • Electricity: 2.484
Vrijstaande woning
Gas: 1.219 • Electricity: 3.940
Twee-onder-één-kap woning
Gas: 899 • Electricity: 3.211
Total number of company establishments: 430
| Period | Crimes |
|---|---|
| jan 2026 | 3 |
| jul 2025 | 11 |
| jun 2025 | 9 |
| mei 2025 | 8 |
| mrt 2025 | 3 |
| mrt 2026 | 7 |
| nov 2024 | 7 |
| nov 2025 | 5 |
| okt 2024 | 7 |
| okt 2025 | 11 |
| sep 2024 | 6 |
| sep 2025 | 8 |
These figures give an indicative picture of safety trends in the living environment of Dorst.
Short answers based on current local statistics, handy for a quick comparison of the living environment.
Dorst telt in 2025 ongeveer 3.148 inwoners.
De gemiddelde WOZ-waarde in Dorst is in 2025 circa € 501.405.
Het gemiddelde inkomen per inwoner in Dorst ligt rond € 33.837 per jaar.
Voor het huidige jaar gaat het om ongeveer 81 geregistreerde misdrijven. Gebruik deze cijfers als indicatie en vergelijk trends per periode.
In Dorst komt vooral "Tussenwoningen" veel voor, met ongeveer 394 woningen.