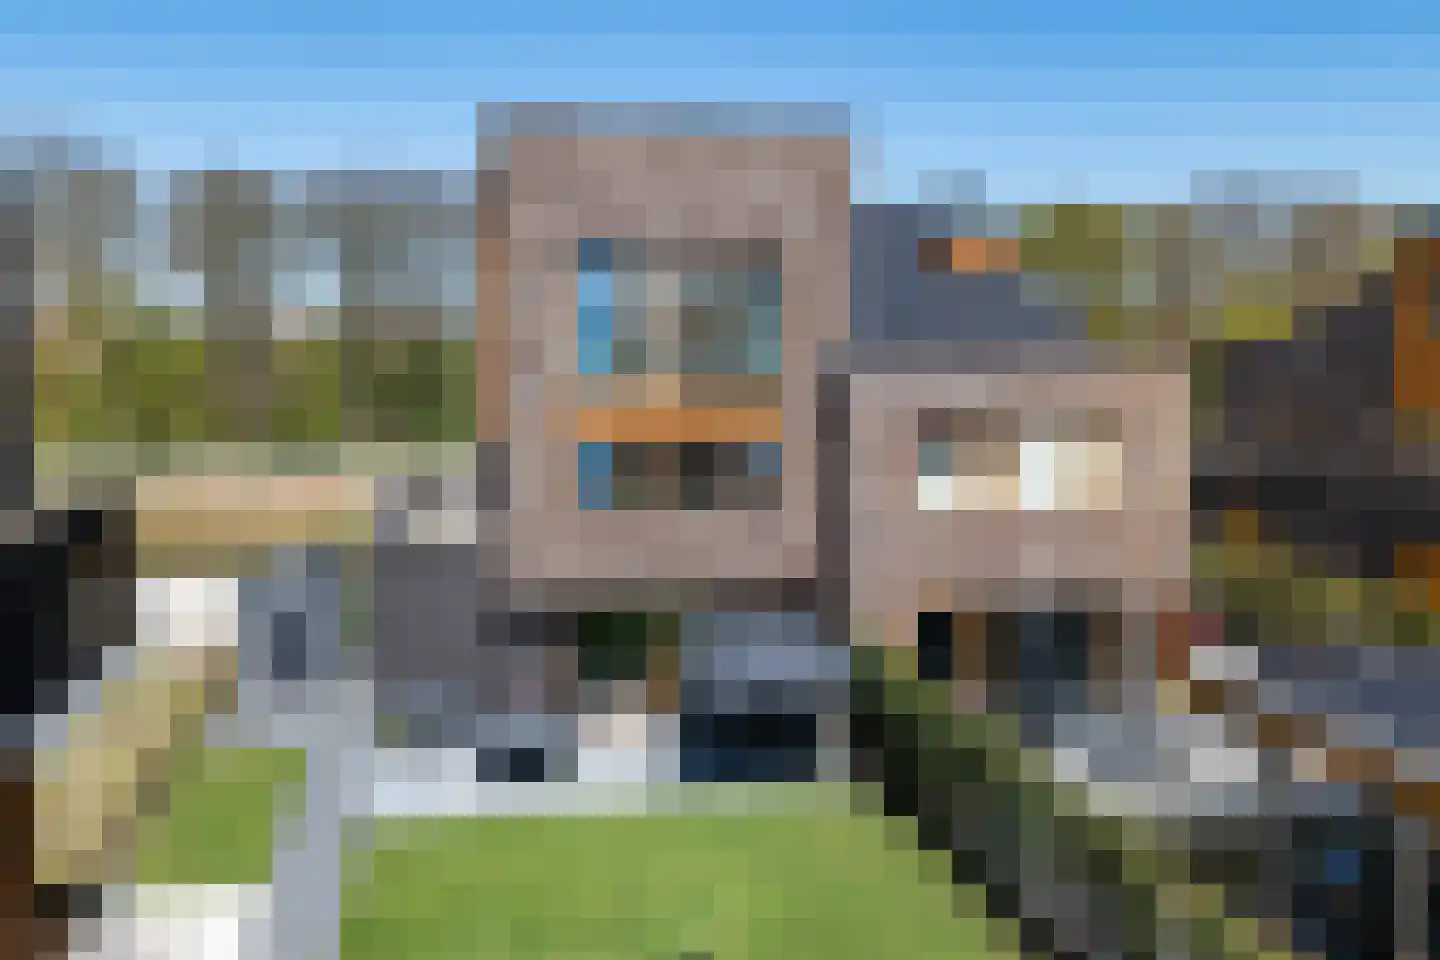
- Available
Zweerdeneiland 47
9766VA Eelderwolde
€ 800.000 k.k.
€ 5.263/m²
- Living area
- 152 m²
- Land area
- 409 m²
- Bedrooms
- 4
Searching in 19 houses in Eelderwolde
Type to search. Use arrow down and arrow up to navigate through results and press Enter to open.
Hidden search suggestions.
View current properties in Eelderwolde or search targeted on street, postal code and property characteristics.
View the current housing stock in Eelderwolde and quickly filter by price, living area, rooms and more. There are currently 19 houses in this place within our selection. View also 15 sold houses in Eelderwolde for extra insight into the local housing market.
9766VA Eelderwolde
€ 800.000 k.k.
€ 5.263/m²
9766RC Eelderwolde
€ 1.150.000 k.k.
€ 5.959/m²
9766RG Eelderwolde
€ 895.000 k.k.
9766TT Eelderwolde
€ 1.295.000 k.k.
€ 3.700/m²
9766PB Eelderwolde
€ 795.000 k.k.
€ 4.760/m²
9766RA Eelderwolde
€ 895.000 k.k.
€ 5.203/m²
9766PX Eelderwolde
€ 795.000 k.k.
€ 6.259/m²
9766TX Eelderwolde
€ 1.150.000 k.k.
€ 5.299/m²
9766VB Eelderwolde
€ 849.000 k.k.
€ 4.639/m²
9766VK Eelderwolde
€ 1.050.000 k.k.
€ 5.737/m²
9766VH Eelderwolde
€ 985.000 k.k.
€ 4.781/m²
9766TW Eelderwolde
€ 1.190.000 k.k.
€ 5.173/m²
9766PV Eelderwolde
€ 1.250.000 k.k.
€ 5.630/m²
9766VK Eelderwolde
€ 1.345.000 k.k.
€ 0/m²
9766TK Eelderwolde
€ 600.000 k.k.
€ 0/m²
9766PL Eelderwolde
€ 945.000 k.k.
€ 4.609/m²
9766VH Eelderwolde
€ 985.000 k.k.
€ 4.781/m²
9766VG Eelderwolde
€ 985.000 k.k.
€ 5.239/m²
9766VP Eelderwolde
€ 1.050.000 k.k.
€ 4.666/m²
Get free quotes from real estate agents with local market knowledge. Compare more than 128 real estate agents in Eelderwolde.
Selling a home in Eelderwolde? Compare all real estate agents in Eelderwolde or view the top 10 real estate agents in Eelderwolde for extra context for your choice.
Real estate agents make sharper offers when they know you're comparing — ask for quotes for sale or purchase.
Practical answers about housing supply, sales and comparing real estate agents in Eelderwolde.
The costs of a real estate agent in Eelderwolde depend on commission, setup costs, property presentation and the chosen service. Compare the 128 real estate agents in Eelderwolde via the real estate agent page and request multiple quotes to compare rates and approach well.
Within our selection, we are currently showing 19 houses in Eelderwolde. View also the sold houses in Eelderwolde to compare the current offering with recent transactions.
Take into account not only price and living area but also maintenance, energy label, location, outdoor space and sales status. This way you compare houses in Eelderwolde on more than just the asking price.
A local real estate agent knows the neighborhoods, recent transactions and demand in Eelderwolde. By comparing 128 real estate agents in the region you get a better insight into prices, sales strategy and expected yield; the top 10 in Eelderwolde provides a useful starting point.
Yes, when making a sales plan, a valuation in Eelderwolde is wise. You gain insight into a realistic asking price and can then compare offers from real estate agents specifically.
View current location data on residents, WOZ development, housing stock, energy consumption, business activity and safety in Eelderwolde. In 2025 were there 3.300 residents. The average WOZ value in 2025 is EUR 857.000.
These figures help to better assess and compare the housing stock in Eelderwolde with recent sold homes. Orient yourself then on suitable top real estate agents in Eelderwolde for sales advice in this region.
Residents
3.300
Last year: 2025
Average WOZ
EUR 857.000
Last year: 2025
Average income per person.
EUR 50.700
Source: AllNumbers
Crimes (current year)
60
Total registered
| Year | Residents |
|---|---|
| 2021 | 2.970 |
| 2022 | 3.130 |
| 2023 | 3.165 |
| 2024 | 3.210 |
| 2025 | 3.300 |
| Year | Average WOZ |
|---|---|
| 2021 | EUR 610.000 |
| 2022 | EUR 664.000 |
| 2023 | EUR 776.000 |
| 2024 | EUR 823.000 |
| 2025 | EUR 857.000 |
Hoger
1.590
Praktisch
320
Middelbaar
420
Europa
175
Nederland
2.845
Buiten Europa
280
Label A
777
Label A+++
76
Label B
34
Label A+
32
Label D
30
Label G
26
Label C
21
Label A++
21
Label F
14
Label A++++
14
Label E
9
Label A+++++
0
| Year | Gas (m3) | Electricity (kWh) |
|---|---|---|
| 2020 | 1.540 | 3.980 |
| 2021 | 1.560 | 4.330 |
| 2022 | 1.170 | 4.140 |
| 2023 | 990 | 4.050 |
| 2024 | 930 | 4.420 |
Hoekwoning
Gas: 980 • Electricity: 3.250
Huurwoning
Gas: 1.150 • Electricity: 2.970
Koopwoning
Gas: 980 • Electricity: 4.130
Appartement
Gas: 750 • Electricity: 2.200
Tussenwoning
Gas: 910 • Electricity: 2.670
Vrijstaande woning
Gas: 1.020 • Electricity: 4.750
Twee-onder-één-kap woning
Gas: 980 • Electricity: 3.580
Total number of company establishments: 530
| Period | Crimes |
|---|---|
| jan 2025 | 1 |
| jan 2026 | 3 |
| jul 2025 | 6 |
| jun 2025 | 3 |
| mei 2025 | 4 |
| mrt 2025 | 5 |
| nov 2024 | 0 |
| nov 2025 | 4 |
| okt 2024 | 8 |
| okt 2025 | 8 |
| sep 2024 | 6 |
| sep 2025 | 7 |
These figures give an indicative picture of safety trends in the living environment of Eelderwolde.
Short answers based on current local statistics, handy for a quick comparison of the living environment.
Eelderwolde telt in 2025 ongeveer 3.300 inwoners.
De gemiddelde WOZ-waarde in Eelderwolde is in 2025 circa € 857.000.
Het gemiddelde inkomen per inwoner in Eelderwolde ligt rond € 50.700 per jaar.
Voor het huidige jaar gaat het om ongeveer 60 geregistreerde misdrijven. Gebruik deze cijfers als indicatie en vergelijk trends per periode.
In Eelderwolde komt vooral "Vrijstaande woningen" veel voor, met ongeveer 509 woningen.