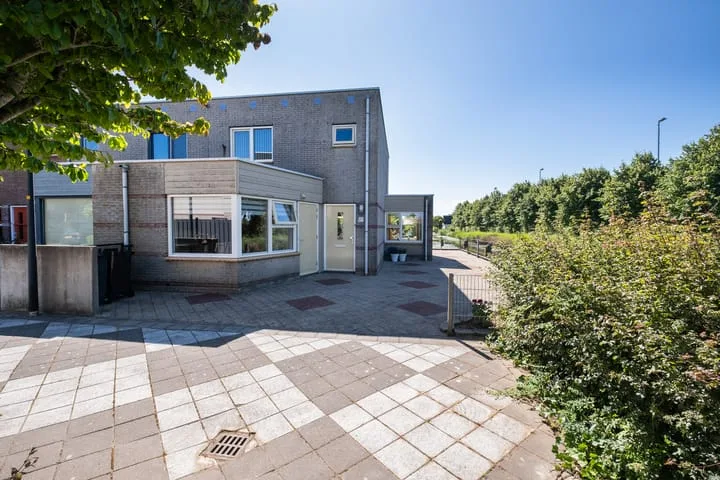
Woningaanbod in Heerhugowaard

Found: 842 houses in Heerhugowaard within your selection

Connected to: Vastgoed Nederland NVM Makelaars

Bekijk het actuele woningaanbod in Heerhugowaard en filter snel op prijs, woonoppervlakte, kamers en meer. Er staan momenteel 842 houses in deze plaats binnen onze selectie. View also 587 sold houses in Heerhugowaard for extra insight into the local housing market.

Selection

Search and filter homes

Set your preferences and discover homes that suit you.

Total supply 240.179
Filters

Set price, area and other characteristics. Adjust a filter or click on Show homes. Location changes directly above.

Reset filters

You search for

  • Place Heerhugowaard

Selling a home in Heerhugowaard? Compare realtor offers

Get free quotes from realtors with local market knowledge in Heerhugowaard.

Free request a quote

  • Quotes in Heerhugowaard
  • Non-binding
  • Personal
  • Free property website

Selling a home in Heerhugowaard? Compare real estate agents who know the local housing market. Also check out all real estate agents in Heerhugowaard or the top 10 real estate agents in Heerhugowaard for extra context for your choice.

Save an average of €5000,-

By comparing brokers and requesting quotes

Frequently asked questions about homes in Heerhugowaard

Praktische antwoorden over woningaanbod, verkoop en makelaars vergelijken in Heerhugowaard.

Residential and neighborhood statistics in Heerhugowaard

View current location data on residents, WOZ development, housing stock, energy consumption, business activity and safety in Heerhugowaard. In 2025 were there 61.740 residents. The average WOZ value in 2025 is EUR 397.966.

These figures help to better assess and compare the housing stock in Heerhugowaard with recent sold homes. Orient yourself then on suitable top real estate agents in Heerhugowaard for sales advice in this region.

Residents

61.740

Last year: 2025

Average WOZ

EUR 397.966

Last year: 2025

Average income per person.

EUR 29.185

Source: AllNumbers

Crimes (current year)

2.682

Total registered

Demographics and WOZ development

Inhabitants per year

Inhabitants per year in Heerhugowaard
Year Residents
2021 58.392
2022 59.035
2023 60.230
2024 61.195
2025 61.740

Annual WOZ value

WOZ value per year in Heerhugowaard
Year Average WOZ
2021 EUR 270.476
2022 EUR 298.354
2023 EUR 354.623
2024 EUR 377.372
2025 EUR 397.966

Composition of residents

Age build-up

65+: 11.635 0-15: 10.430 15-25: 7.490 25-45: 16.000 45-65: 16.175

Education level

Hoger

11.730

Praktisch

12.850

Middelbaar

20.790

Origin of residents (2025)

Europa

5.065

Nederland

45.500

Buiten Europa

11.165

Housing stock and construction periods

Types of homes

Hoekwoningen 3.987
Appartementen 8.360
Tussenwoningen 11.634
Vrijstaande woningen 2.856
Twee-onder-één-kap woningen 2.004

Construction period of buildings

Voor 1700 4
1700 tot 1900 113
1900 tot 1925 181
1925 tot 1950 303
1950 tot 1970 3.560
1970 tot 1980 6.238
1980 tot 1990 2.008
1990 tot 2000 4.404
2000 tot 2010 2.600
2010 tot 2020 2.184
2020 en later 1.637

Energy and sustainability

Energy label distribution

Label A

9.995

Label C

6.750

Label B

5.040

Label D

1.395

Label A+

1.061

Label A++

1.039

Label A+++

785

Label G

360

Label F

355

Label E

292

Label A++++

212

Label A+++++

14

Average energy consumption per year

Average energy consumption per year in Heerhugowaard
Year Gas (m3) Electricity (kWh)
2020 965 2.883
2021 1.045 2.947
2022 791 2.741
2023 670 2.588
2024 640 2.654

Consumption per house type

Hoekwoning

Gas: 771 • Electricity: 2.746

Huurwoning

Gas: 515 • Electricity: 1.992

Koopwoning

Gas: 753 • Electricity: 2.824

Appartement

Gas: 368 • Electricity: 1.691

Tussenwoning

Gas: 673 • Electricity: 2.546

Vrijstaande woning

Gas: 1.065 • Electricity: 3.586

Twee-onder-één-kap woning

Gas: 803 • Electricity: 2.692

Business activity in Heerhugowaard (2025)

Handel en HORECA 1.245
Nijverheid en energie 1.330
Zakelijke dienstverlening 1.640
Overheid, onderwijs en zorg 1.195
Landbouw, bosbouw en visserij 135
Vervoer, informatie en communicatie 540
Financiele diensten en onroerendgoed 380
Cultuur, recreatie en overige diensten 715

Total number of company establishments: 7.190

Recent crime statistics

Recent crime statistics in Heerhugowaard
Period Crimes
jan 2025 215
jan 2026 223
jul 2025 243
jun 2025 260
mei 2025 179
mrt 2025 226
nov 2024 205
nov 2025 223
okt 2024 214
okt 2025 267
sep 2024 180
sep 2025 234

These figures give an indicative picture of safety trends in the living environment of Heerhugowaard.

Frequently asked questions about living in Heerhugowaard

Short answers based on current local statistics, handy for a quick comparison of the living environment.

Hoeveel inwoners heeft Heerhugowaard?

Heerhugowaard telt in 2025 ongeveer 61.740 inwoners.

Wat is de gemiddelde WOZ-waarde in Heerhugowaard?

De gemiddelde WOZ-waarde in Heerhugowaard is in 2025 circa € 397.966.

Wat is het gemiddelde inkomen per inwoner in Heerhugowaard?

Het gemiddelde inkomen per inwoner in Heerhugowaard ligt rond € 29.185 per jaar.

Hoe veilig is wonen in Heerhugowaard?

Voor het huidige jaar gaat het om ongeveer 2.682 geregistreerde misdrijven. Gebruik deze cijfers als indicatie en vergelijk trends per periode.

Welke woningtypen komen het meest voor in Heerhugowaard?

In Heerhugowaard komt vooral "Tussenwoningen" veel voor, met ongeveer 11.634 woningen.