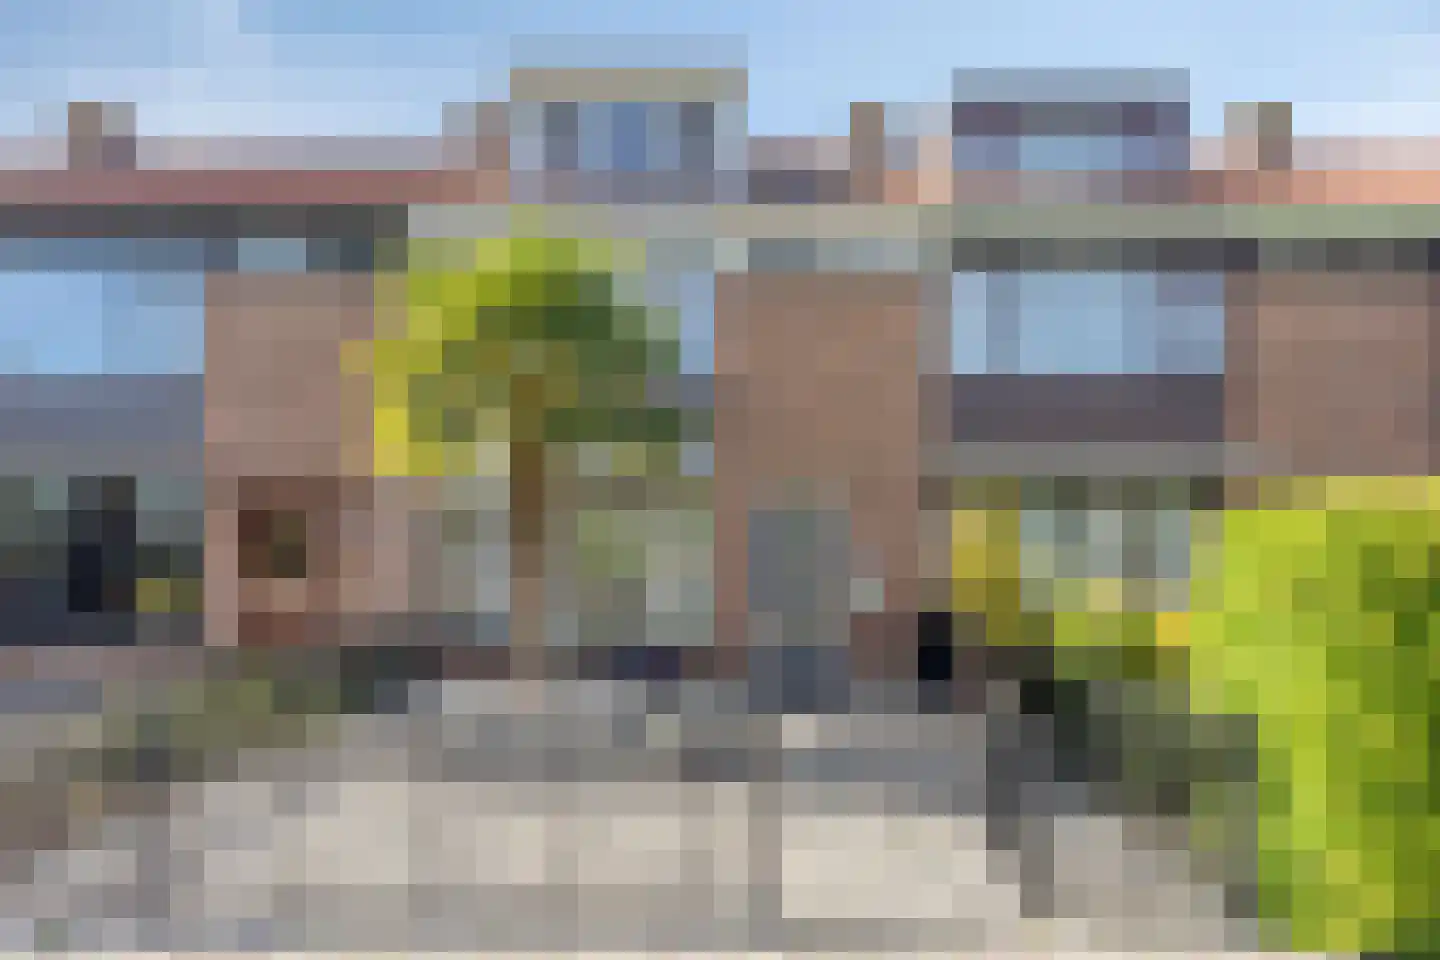
- Available
Rozenlaan 21
2995AS Heerjansdam
€ 739.000 k.k.
€ 5.819/m²
- Living area
- 127 m²
- Land area
- 351 m²
- Bedrooms
- 6
Searching in 42 houses in Heerjansdam
Type to search. Use arrow down and arrow up to navigate through results and press Enter to open.
Hidden search suggestions.
View current properties in Heerjansdam or search targeted on street, postal code and property characteristics.
View the current housing stock in Heerjansdam and quickly filter by price, living area, rooms and more. There are currently 42 houses in this place within our selection. View also 33 sold houses in Heerjansdam for extra insight into the local housing market.
2995AS Heerjansdam
€ 739.000 k.k.
€ 5.819/m²
2995XP Heerjansdam
€ 875.000 k.k.
2995BH Heerjansdam
€ 325.000 k.k.
€ 3.385/m²
2995TN Heerjansdam
€ 749.500 k.k.
€ 5.721/m²
2995VN Heerjansdam
€ 700.000 k.k.
€ 7.000/m²
2995XL Heerjansdam
€ 469.000 k.k.
€ 5.270/m²
2995BM Heerjansdam
€ 785.000 k.k.
€ 6.653/m²
2995VL Heerjansdam
€ 425.000 k.k.
€ 3.427/m²
2995AH Heerjansdam
€ 350.000 k.k.
€ 5.147/m²
2995VH Heerjansdam
€ 398.500 k.k.
€ 4.528/m²
2995VN Heerjansdam
€ 795.000 k.k.
€ 6.023/m²
2995AT Heerjansdam
€ 580.000 k.k.
€ 7.250/m²
2995XP Heerjansdam
Price upon request
2995AA Heerjansdam
€ 375.000 k.k.
€ 5.769/m²
2995TK Heerjansdam
Price upon request
2995XG Heerjansdam
€ 729.500 k.k.
€ 5.611/m²
2995VR Heerjansdam
€ 449.500 k.k.
€ 5.914/m²
2995TL Heerjansdam
€ 549.000 k.k.
€ 4.815/m²
2995VG Heerjansdam
€ 439.000 k.k.
€ 4.141/m²
2995XL Heerjansdam
€ 535.000 k.k.
€ 5.691/m²
2995AR Heerjansdam
€ 400.000 k.k.
€ 3.571/m²
2995TH Heerjansdam
€ 750.000 k.k.
€ 4.545/m²
2995XP Heerjansdam
Price upon request
2995AG Heerjansdam
€ 349.500 k.k.
€ 4.660/m²
2995XE Heerjansdam
€ 279.000 k.k.
€ 5.812/m²
2995AS Heerjansdam
€ 339.500 k.k.
€ 4.920/m²
2995XP Heerjansdam
€ 430.000 k.k.
€ 4.174/m²
2995VP Heerjansdam
€ 425.000 k.k.
€ 3.728/m²
Get free quotes from real estate agents with local market knowledge. Compare more than 129 real estate agents in Heerjansdam.
Selling a home in Heerjansdam? View the sales-oriented guide sell a house in Heerjansdam, compare all real estate agents in Heerjansdam or view the top 10 real estate agents in Heerjansdam for extra context to your choice.
Real estate agents make sharper offers when they know you're comparing — ask for quotes for sale or purchase.
Practical answers about housing supply, sales and comparing real estate agents in Heerjansdam.
The costs of a real estate agent in Heerjansdam depend on commission, setup costs, property presentation and the chosen service. Compare the 129 real estate agents in Heerjansdam via the real estate agent page and request multiple quotes to compare rates and approach well.
Within our selection, we are currently showing 42 houses in Heerjansdam. View also the sold houses in Heerjansdam to compare the current offering with recent transactions.
Take into account not only price and living area but also maintenance, energy label, location, outdoor space and sales status. This way you compare houses in Heerjansdam on more than just the asking price.
A local real estate agent knows the neighborhoods, recent transactions and demand in Heerjansdam. By comparing 129 real estate agents in the region you get a better insight into prices, sales strategy and expected yield; the top 10 in Heerjansdam provides a useful starting point.
Yes, when making a sales plan, a valuation in Heerjansdam is wise. You gain insight into a realistic asking price and can then compare offers from real estate agents specifically.
View current location data on residents, WOZ development, housing stock, energy consumption, business activity and safety in Heerjansdam. In 2025 were there 3.790 residents. The average WOZ value in 2025 is EUR 432.846.
These figures help to better assess and compare the housing stock in Heerjansdam with recent sold homes. Orient yourself then on suitable top real estate agents in Heerjansdam for sales advice in this region.
Residents
3.790
Last year: 2025
Average WOZ
EUR 432.846
Last year: 2025
Average income per person.
EUR 32.774
Source: AllNumbers
Crimes (current year)
72
Total registered
| Year | Residents |
|---|---|
| 2021 | 3.805 |
| 2022 | 3.820 |
| 2023 | 3.825 |
| 2024 | 3.820 |
| 2025 | 3.790 |
| Year | Average WOZ |
|---|---|
| 2021 | EUR 309.341 |
| 2022 | EUR 330.364 |
| 2023 | EUR 386.745 |
| 2024 | EUR 404.387 |
| 2025 | EUR 432.846 |
Hoger
760
Praktisch
780
Middelbaar
1.300
Europa
155
Nederland
3.375
Buiten Europa
255
Label A
506
Label C
333
Label B
229
Label E
191
Label D
152
Label F
131
Label G
117
Label A+
70
Label A++++
19
Label A+++
9
Label A++
3
Label A+++++
0
| Year | Gas (m3) | Electricity (kWh) |
|---|---|---|
| 2020 | 1.258 | 2.960 |
| 2021 | 1.401 | 3.059 |
| 2022 | 1.041 | 2.824 |
| 2023 | 888 | 2.609 |
| 2024 | 873 | 2.624 |
Hoekwoning
Gas: 989 • Electricity: 2.727
Huurwoning
Gas: 703 • Electricity: 1.862
Koopwoning
Gas: 1.006 • Electricity: 3.030
Appartement
Gas: 511 • Electricity: 1.648
Tussenwoning
Gas: 819 • Electricity: 2.426
Vrijstaande woning
Gas: 1.478 • Electricity: 3.997
Twee-onder-één-kap woning
Gas: 1.066 • Electricity: 3.314
Total number of company establishments: 500
| Period | Crimes |
|---|---|
| jan 2025 | 8 |
| jan 2026 | 6 |
| jul 2025 | 8 |
| jun 2025 | 3 |
| mei 2025 | 6 |
| mrt 2025 | 3 |
| nov 2024 | 1 |
| nov 2025 | 4 |
| okt 2024 | 3 |
| okt 2025 | 6 |
| sep 2024 | 7 |
| sep 2025 | 10 |
These figures give an indicative picture of safety trends in the living environment of Heerjansdam.
Short answers based on current local statistics, handy for a quick comparison of the living environment.
Heerjansdam telt in 2025 ongeveer 3.790 inwoners.
De gemiddelde WOZ-waarde in Heerjansdam is in 2025 circa € 432.846.
Het gemiddelde inkomen per inwoner in Heerjansdam ligt rond € 32.774 per jaar.
Voor het huidige jaar gaat het om ongeveer 72 geregistreerde misdrijven. Gebruik deze cijfers als indicatie en vergelijk trends per periode.
In Heerjansdam komt vooral "Tussenwoningen" veel voor, met ongeveer 681 woningen.