- Sold
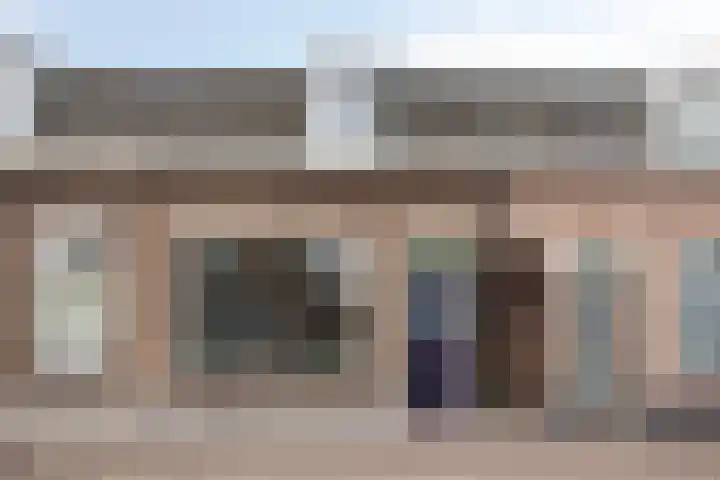
Roestenbergstraat 39
5171JA Kaatsheuvel
€ 335.000 k.k.
€ 3.453/m²
- Living area
- 97 m²
- Land area
- 220 m²
- Bedrooms
- 3
View 123 sold houses in Kaatsheuvel
Type to search. Use arrow down and arrow up to navigate through results and press Enter to open.
Hidden search suggestions.
Compare sold homes in Kaatsheuvel or view the current offering in this location directly.
On this page you will find recently sold homes in Kaatsheuvel. Use this overview to better estimate selling prices, popular neighborhoods, and the local housing supply before you choose a real estate agent. Also view the current housing supply with 225 houses in Kaatsheuvel.
5171JA Kaatsheuvel
€ 335.000 k.k.
€ 3.453/m²
5171JT Kaatsheuvel
€ 1.150.000 k.k.
€ 4.811/m²
5172DN Kaatsheuvel
€ 520.000 k.k.
€ 4.160/m²
5171DL Kaatsheuvel
€ 725.000 k.k.
€ 5.105/m²
5171GR Kaatsheuvel
€ 439.000 k.k.
€ 3.403/m²
5171AN Kaatsheuvel
€ 359.000 k.k.
€ 3.176/m²
5171TL Kaatsheuvel
€ 795.000 k.k.
€ 2.038/m²
5171TL Kaatsheuvel
€ 850.000 k.k.
€ 4.207/m²
5171RK Kaatsheuvel
€ 895.000 k.k.
€ 4.201/m²
5171XM Kaatsheuvel
€ 450.000 k.k.
€ 3.333/m²
5171DS Kaatsheuvel
€ 350.000 k.k.
€ 3.932/m²
5172CH Kaatsheuvel
€ 399.000 k.k.
€ 4.244/m²
5171XM Kaatsheuvel
€ 395.000 k.k.
€ 3.347/m²
5172GC Kaatsheuvel
€ 930.000 k.k.
€ 4.843/m²
5171ZC Kaatsheuvel
€ 340.000 k.k.
€ 3.119/m²
5171PK Kaatsheuvel
€ 849.500 k.k.
€ 5.179/m²
5171BC Kaatsheuvel
€ 519.000 k.k.
€ 3.460/m²
5171VB Kaatsheuvel
€ 535.000 k.k.
€ 3.057/m²
5171JM Kaatsheuvel
€ 349.500 k.k.
€ 1.456/m²
5171DH Kaatsheuvel
€ 535.000 k.k.
€ 3.614/m²
5171CG Kaatsheuvel
€ 600.000 k.k.
€ 4.411/m²
5172GN Kaatsheuvel
€ 485.000 k.k.
€ 3.911/m²
5171JS Kaatsheuvel
€ 895.000 k.k.
€ 4.221/m²
5171CH Kaatsheuvel
€ 350.000 k.k.
€ 3.431/m²
5171BB Kaatsheuvel
€ 375.000 k.k.
€ 3.000/m²
5171GW Kaatsheuvel
€ 485.000 k.k.
€ 6.381/m²
5172DP Kaatsheuvel
€ 460.000 k.k.
€ 4.693/m²
5171KC Kaatsheuvel
€ 549.500 k.k.
€ 3.639/m²
Bekijk recente verkopen en ontvang gratis offertes van lokale makelaars. Vergelijk meer dan 32 makelaars in Kaatsheuvel.
Selling your own home in Kaatsheuvel? Compare real estate agents in Kaatsheuvel or view the best real estate agents in Kaatsheuvel as a reference for your choice.
Real estate agents make sharper offers when they know you're comparing — ask for quotes for sale or purchase.
Short answers about housing prices, sold homes and comparing real estate agents in Kaatsheuvel.
De kosten van een makelaar in Kaatsheuvel verschillen per kantoor, woningtype en verkoopaanpak. In Kaatsheuvel kun je 32 real estate agents vergelijken; bekijk daarom ook de makelaars in Kaatsheuvel om tarieven, presentatie en lokale ervaring beter naast elkaar te zetten.
On this page we currently show 123 sold houses in Kaatsheuvel from our selection. This helps you to better assess recent transactions and the local housing market.
Houses sold in Kaatsheuvel give insight into asking prices, house types and neighborhoods where recent transactions have taken place. Compare this also with the current housing stock in Kaatsheuvel to better understand the market.
You can use sold homes as a first market indication, but a local real estate agent can better take into account finishing, location, maintenance and current demand in Kaatsheuvel.
Vergelijk de 32 real estate agents in Kaatsheuvel op lokale verkoopervaring, reviews, verwachte opbrengst, courtage en marketingaanpak. Bekijk verkoopmakelaars in Kaatsheuvel of de top 10 makelaars in Kaatsheuvel om snel sterke kantoren te ontdekken.
View current location data on residents, WOZ development, housing stock, energy consumption, business activity and safety in Kaatsheuvel. In 2025 were there 17.190 residents. The average WOZ value in 2025 is EUR 393.587.
These figures help to better assess and compare the housing stock in Kaatsheuvel with recent sold homes. Orient yourself then on suitable top real estate agents in Kaatsheuvel for sales advice in this region.
Residents
17.190
Last year: 2025
Average WOZ
EUR 393.587
Last year: 2025
Average income per person.
EUR 33.030
Source: AllNumbers
Crimes (current year)
583
Total registered
| Year | Residents |
|---|---|
| 2021 | 16.615 |
| 2022 | 16.895 |
| 2023 | 16.945 |
| 2024 | 16.975 |
| 2025 | 17.190 |
| Year | Average WOZ |
|---|---|
| 2021 | EUR 277.230 |
| 2022 | EUR 302.562 |
| 2023 | EUR 354.885 |
| 2024 | EUR 372.632 |
| 2025 | EUR 393.587 |
Hoger
2.920
Praktisch
3.600
Middelbaar
6.370
Europa
1.100
Nederland
14.580
Buiten Europa
1.520
Label C
2.141
Label A
1.999
Label B
1.416
Label D
654
Label G
472
Label F
423
Label A+++
317
Label E
307
Label A+
208
Label A++
183
Label A++++
19
Label A+++++
4
| Year | Gas (m3) | Electricity (kWh) |
|---|---|---|
| 2020 | 1.266 | 3.197 |
| 2021 | 1.423 | 3.245 |
| 2022 | 1.082 | 3.029 |
| 2023 | 923 | 2.825 |
| 2024 | 880 | 2.898 |
Hoekwoning
Gas: 944 • Electricity: 2.784
Huurwoning
Gas: 732 • Electricity: 2.115
Koopwoning
Gas: 1.028 • Electricity: 3.228
Appartement
Gas: 521 • Electricity: 1.739
Tussenwoning
Gas: 843 • Electricity: 2.586
Vrijstaande woning
Gas: 1.342 • Electricity: 4.163
Twee-onder-één-kap woning
Gas: 1.089 • Electricity: 3.213
Total number of company establishments: 2.270
| Period | Crimes |
|---|---|
| jan 2025 | 49 |
| jan 2026 | 32 |
| jul 2025 | 52 |
| jun 2025 | 40 |
| mei 2025 | 53 |
| mrt 2025 | 54 |
| nov 2024 | 57 |
| nov 2025 | 49 |
| okt 2024 | 61 |
| okt 2025 | 43 |
| sep 2024 | 55 |
| sep 2025 | 53 |
These figures give an indicative picture of safety trends in the living environment of Kaatsheuvel.
Short answers based on current local statistics, handy for a quick comparison of the living environment.
Kaatsheuvel telt in 2025 ongeveer 17.190 inwoners.
De gemiddelde WOZ-waarde in Kaatsheuvel is in 2025 circa € 393.587.
Het gemiddelde inkomen per inwoner in Kaatsheuvel ligt rond € 33.030 per jaar.
Voor het huidige jaar gaat het om ongeveer 583 geregistreerde misdrijven. Gebruik deze cijfers als indicatie en vergelijk trends per periode.
In Kaatsheuvel komt vooral "Tussenwoningen" veel voor, met ongeveer 2.586 woningen.