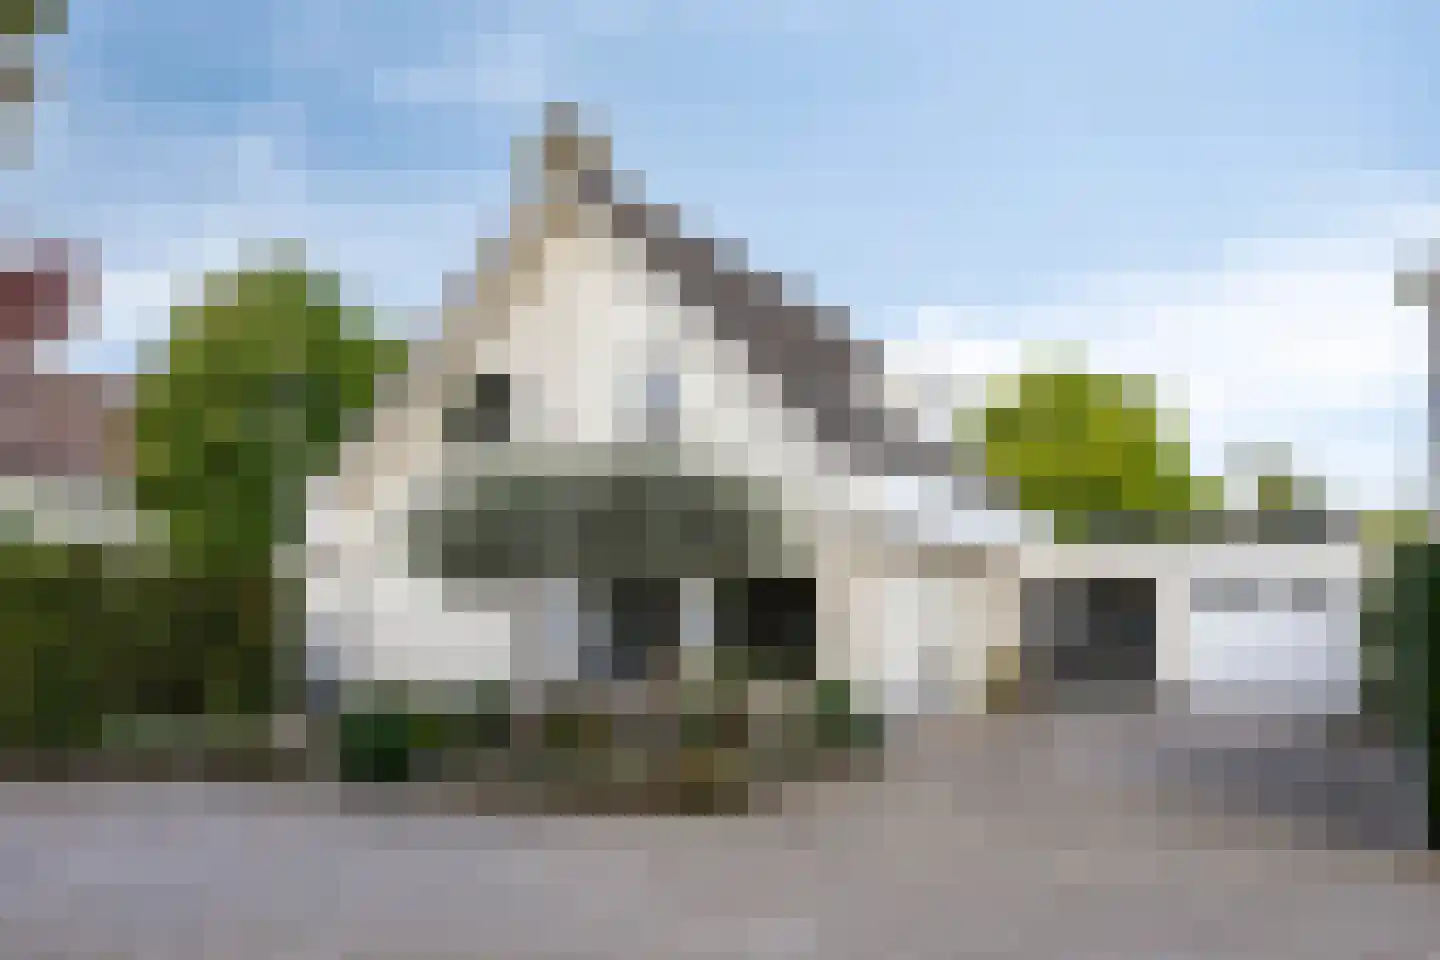
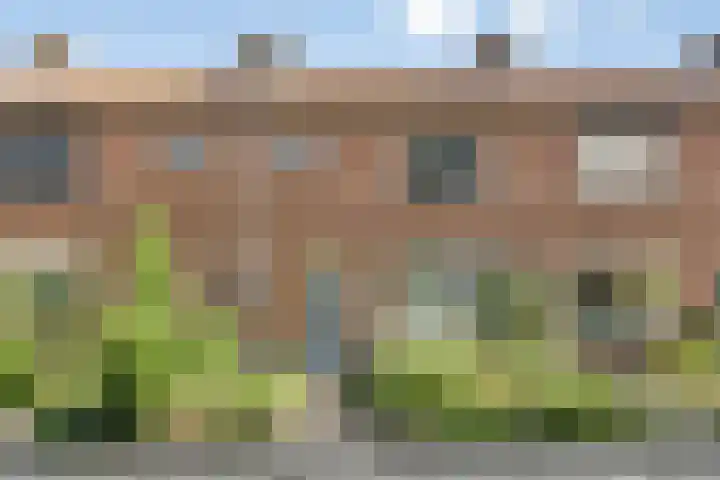
- Sold
Biesbongerd 24
4041RE Kesteren
€ 498.000 k.k.
€ 3.744/m²
- Living area
- 133 m²
- Land area
- 244 m²
- Bedrooms
- 4
View 81 sold houses in Kesteren
Type to search. Use arrow down and arrow up to navigate through results and press Enter to open.
Hidden search suggestions.
Compare sold homes in Kesteren or view the current offering in this location directly.
On this page you will find recently sold homes in Kesteren. Use this overview to better estimate selling prices, popular neighborhoods, and the local housing supply before you choose a real estate agent. Also view the current housing supply with 114 houses in Kesteren.
4041RE Kesteren
€ 498.000 k.k.
€ 3.744/m²
4041VG Kesteren
€ 695.000 k.k.
€ 4.263/m²
4041EM Kesteren
€ 465.000 k.k.
€ 3.661/m²
4041JJ Kesteren
€ 485.000 k.k.
€ 3.943/m²
4041GV Kesteren
€ 545.000 k.k.
€ 3.562/m²
4041BH Kesteren
€ 469.000 k.k.
€ 3.974/m²
4041AJ Kesteren
€ 598.000 k.k.
€ 3.858/m²
4041EL Kesteren
€ 750.000 k.k.
€ 3.807/m²
4041VJ Kesteren
€ 680.000 k.k.
€ 4.197/m²
4041GS Kesteren
€ 462.000
€ 5.704/m²
4041GS Kesteren
€ 390.500
€ 5.423/m²
4041GS Kesteren
€ 393.000
€ 5.458/m²
4041GS Kesteren
€ 390.500
€ 5.828/m²
4041VN Kesteren
€ 465.000 k.k.
€ 3.576/m²
4041CC Kesteren
€ 585.000 k.k.
€ 4.606/m²
4041XX Kesteren
€ 675.000 k.k.
€ 5.769/m²
4041GV Kesteren
€ 374.500 k.k.
€ 5.350/m²
4041CG Kesteren
€ 400.000 k.k.
€ 3.361/m²
4041XX Kesteren
€ 535.000 k.k.
€ 4.572/m²
4041AM Kesteren
€ 415.000 k.k.
€ 3.120/m²
4041XA Kesteren
€ 895.000 k.k.
€ 4.453/m²
4041XT Kesteren
€ 450.000 k.k.
€ 4.054/m²
4041BH Kesteren
€ 425.000 k.k.
€ 4.086/m²
4041EM Kesteren
€ 447.500 k.k.
€ 0/m²
4041EM Kesteren
€ 539.000 k.k.
€ 0/m²
4041RB Kesteren
€ 419.000 k.k.
€ 0/m²
4041XZ Kesteren
€ 539.000 k.k.
€ 0/m²
4041XR Kesteren
€ 425.000 k.k.
€ 0/m²
View recent sales and receive free quotes from local real estate agents. Compare more than 30 real estate agents in Kesteren.
Selling your own home in Kesteren? Compare real estate agents in Kesteren or view the best real estate agents in Kesteren as a reference for your choice.
Real estate agents make sharper offers when they know you're comparing — ask for quotes for sale or purchase.
Short answers about housing prices, sold homes and comparing real estate agents in Kesteren.
The costs of a real estate agent in Kesteren vary per office, property type and sales approach. In Kesteren you can compare 30 real estate agents; therefore also look at the real estate agents in Kesteren to better compare fees, presentation and local experience.
On this page we currently show 81 sold houses in Kesteren from our selection. This helps you to better assess recent transactions and the local housing market.
Houses sold in Kesteren give insight into asking prices, house types and neighborhoods where recent transactions have taken place. Compare this also with the current housing stock in Kesteren to better understand the market.
You can use sold homes as a first market indication, but a local real estate agent can better take into account finishing, location, maintenance and current demand in Kesteren.
Compare the 30 real estate agents in Kesteren on local sales experience, reviews, expected yield, commission and marketing approach. View real estate agents in Kesteren or the top 10 agents in Kesteren to quickly discover strong offices.
View current location data on residents, WOZ development, housing stock, energy consumption, business activity and safety in Kesteren. In 2025 were there 7.195 residents. The average WOZ value in 2025 is EUR 410.714.
These figures help to better assess and compare the housing stock in Kesteren with recent sold homes. Orient yourself then on suitable top real estate agents in Kesteren for sales advice in this region.
Residents
7.195
Last year: 2025
Average WOZ
EUR 410.714
Last year: 2025
Average income per person.
EUR 18.921
Source: AllNumbers
Crimes (current year)
158
Total registered
| Year | Residents |
|---|---|
| 2021 | 6.440 |
| 2022 | 6.740 |
| 2023 | 7.015 |
| 2024 | 7.215 |
| 2025 | 7.195 |
| Year | Average WOZ |
|---|---|
| 2021 | EUR 291.083 |
| 2022 | EUR 320.359 |
| 2023 | EUR 369.120 |
| 2024 | EUR 384.682 |
| 2025 | EUR 410.714 |
Hoger
980
Praktisch
1.460
Middelbaar
2.580
Europa
415
Nederland
6.355
Buiten Europa
425
Label A
810
Label C
573
Label B
299
Label D
269
Label A+++
155
Label G
132
Label F
87
Label E
75
Label A+
56
Label A++++
39
Label A++
37
Label A+++++
0
| Year | Gas (m3) | Electricity (kWh) |
|---|---|---|
| 2020 | 1.344 | 3.200 |
| 2021 | 1.440 | 3.301 |
| 2022 | 1.111 | 3.149 |
| 2023 | 907 | 3.007 |
| 2024 | 868 | 3.119 |
Hoekwoning
Gas: 875 • Electricity: 2.666
Huurwoning
Gas: 776 • Electricity: 2.431
Koopwoning
Gas: 989 • Electricity: 3.354
Appartement
Gas: 325 • Electricity: 1.536
Tussenwoning
Gas: 784 • Electricity: 2.478
Vrijstaande woning
Gas: 1.386 • Electricity: 4.320
Twee-onder-één-kap woning
Gas: 921 • Electricity: 3.251
Total number of company establishments: 855
| Period | Crimes |
|---|---|
| jan 2026 | 12 |
| jul 2025 | 18 |
| jun 2025 | 10 |
| mei 2025 | 12 |
| mrt 2025 | 16 |
| mrt 2026 | 12 |
| nov 2024 | 12 |
| nov 2025 | 15 |
| okt 2024 | 14 |
| okt 2025 | 13 |
| sep 2024 | 25 |
| sep 2025 | 9 |
These figures give an indicative picture of safety trends in the living environment of Kesteren.
Short answers based on current local statistics, handy for a quick comparison of the living environment.
Kesteren telt in 2025 ongeveer 7.195 inwoners.
De gemiddelde WOZ-waarde in Kesteren is in 2025 circa € 410.714.
Het gemiddelde inkomen per inwoner in Kesteren ligt rond € 18.921 per jaar.
Voor het huidige jaar gaat het om ongeveer 158 geregistreerde misdrijven. Gebruik deze cijfers als indicatie en vergelijk trends per periode.
In Kesteren komt vooral "Tussenwoningen" veel voor, met ongeveer 865 woningen.