- Sold
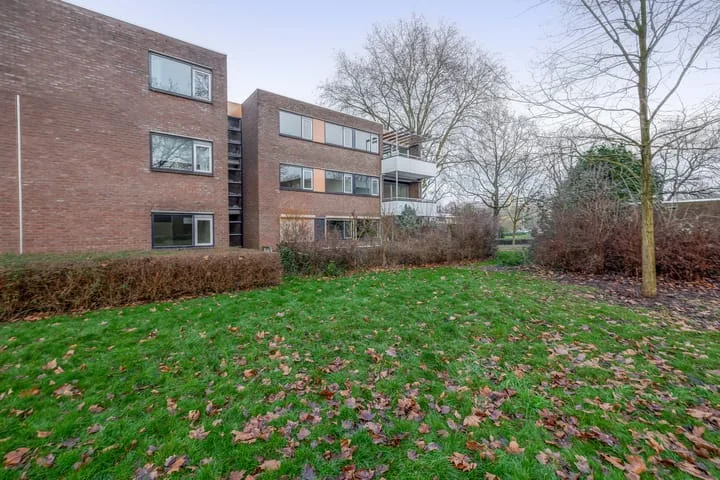
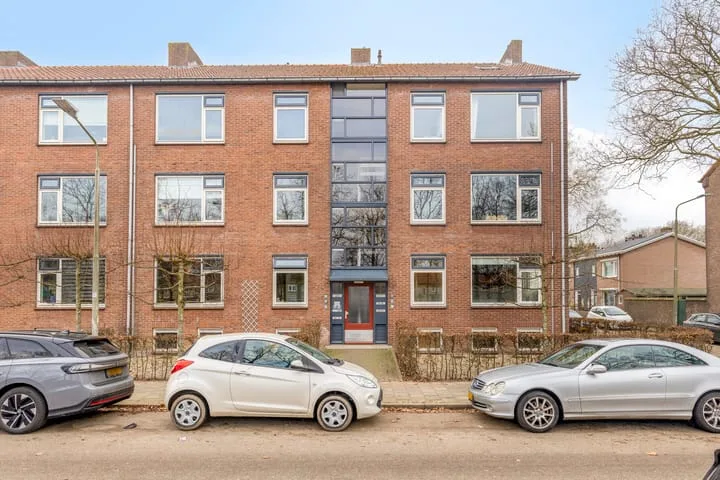
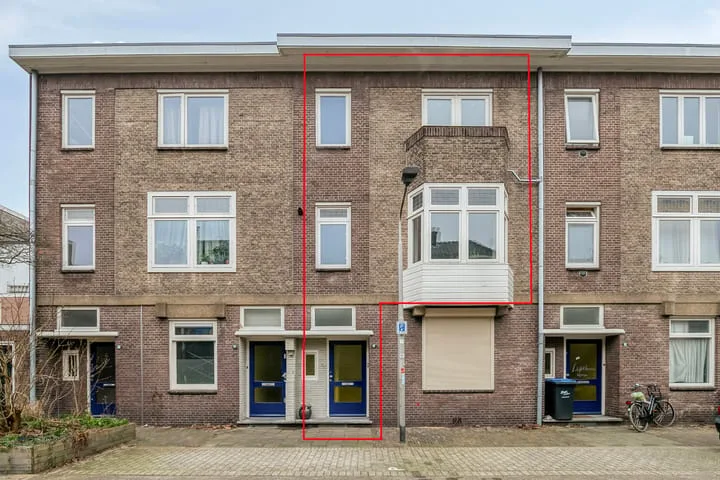
Oude Groenewoudseweg 242
6524WS Nijmegen
€ 1.075.000 k.k.
€ 5.718/m²
- Living area
- 188 m²
- Land area
- 347 m²
- Bedrooms
- 4
View 1.690 sold houses in Nijmegen
Type to search. Use arrow down and arrow up to navigate through results and press Enter to open.
Hidden search suggestions.
Compare sold homes in Nijmegen or view the current offering in this location directly.
On this page you will find recently sold homes in Nijmegen. Use this overview to better estimate selling prices, popular neighborhoods, and the local housing supply before you choose a real estate agent. Also view the current housing supply with 2.154 houses in Nijmegen.
6524WS Nijmegen
€ 1.075.000 k.k.
€ 5.718/m²
6515ZM Nijmegen
€ 825.000 k.k.
€ 4.508/m²
6533TR Nijmegen
€ 550.000 k.k.
€ 4.954/m²
6525WV Nijmegen
€ 345.000 k.k.
€ 4.600/m²
6521KE Nijmegen
€ 335.000 k.k.
€ 6.700/m²
6541MH Nijmegen
€ 600.000 k.k.
€ 5.263/m²
6521CG Nijmegen
€ 495.000 k.k.
€ 5.156/m²
6542WX Nijmegen
€ 450.000 k.k.
€ 4.205/m²
6533LG Nijmegen
€ 545.000 k.k.
€ 4.541/m²
6543PB Nijmegen
€ 425.000 k.k.
€ 3.483/m²
6542NX Nijmegen
€ 395.000 k.k.
€ 5.129/m²
6515DJ Nijmegen
€ 519.000 k.k.
€ 4.552/m²
6531JE Nijmegen
€ 275.000 k.k.
€ 6.875/m²
6537RD Nijmegen
€ 249.000 k.k.
€ 6.225/m²
6542NG Nijmegen
€ 339.000 k.k.
€ 4.134/m²
6543WT Nijmegen
€ 425.000 k.k.
€ 5.379/m²
6541GA Nijmegen
€ 725.000 k.k.
€ 4.931/m²
6545LA Nijmegen
€ 417.500 k.k.
€ 3.538/m²
6537RE Nijmegen
€ 287.500 k.k.
€ 3.885/m²
6512GE Nijmegen
€ 525.000 k.k.
€ 5.048/m²
6541TT Nijmegen
€ 345.000 k.k.
€ 6.272/m²
6546JK Nijmegen
€ 389.000 k.k.
€ 3.473/m²
6533JE Nijmegen
€ 275.000 k.k.
€ 4.583/m²
6515EL Nijmegen
€ 690.000 k.k.
€ 5.476/m²
6511RH Nijmegen
€ 550.000 k.k.
€ 3.793/m²
6538NJ Nijmegen
€ 345.000 k.k.
€ 3.080/m²
6546KV Nijmegen
€ 339.000 k.k.
€ 4.134/m²
6512JN Nijmegen
€ 535.000 k.k.
€ 4.495/m²
Get free quotes from realtors with local market knowledge in Nijmegen.
Selling a home in Nijmegen? Compare real estate agents who know the local housing market. Also check out all real estate agents in Nijmegen or the top 10 real estate agents in Nijmegen for extra context for your choice.
By comparing brokers and requesting quotes
Short answers about housing prices, sold homes and comparing real estate agents in Nijmegen.
The costs of a real estate agent in Nijmegen vary per office, property type and sales approach. Therefore, compare multiple quotes and also look at the real estate agents in Nijmegen to better compare rates, presentation and local experience.
On this page we currently show 1.690 sold houses in Nijmegen from our selection. This helps you to better assess recent transactions and the local housing market.
Houses sold in Nijmegen give insight into asking prices, house types and neighborhoods where recent transactions have taken place. Compare this also with the current housing stock in Nijmegen to better understand the market.
You can use sold homes as a first market indication, but a local real estate agent can better take into account finishing, location, maintenance and current demand in Nijmegen.
Compare realtors in Nijmegen on local sales experience, reviews, expected yield, commission and marketing approach. The top 10 realtors in Nijmegen helps to quickly discover strong offices.
View current location data on residents, WOZ development, housing stock, energy consumption, business activity and safety in Nijmegen. In 2026 were there 162.473 residents. The average WOZ value in 2025 is EUR 371.314.
These figures help to better assess and compare the housing stock in Nijmegen with recent sold homes. Orient yourself then on suitable top real estate agents in Nijmegen for sales advice in this region.
Residents
162.473
Last year: 2026
Average WOZ
EUR 371.314
Last year: 2025
Average income per person.
EUR 32.906
Source: AllNumbers
Crimes (current year)
11.524
Total registered
| Year | Residents |
|---|---|
| 2021 | 156.510 |
| 2022 | 156.795 |
| 2023 | 158.905 |
| 2024 | 162.215 |
| 2025 | 162.625 |
| 2026 | 162.473 |
| Year | Average WOZ |
|---|---|
| 2021 | EUR 264.961 |
| 2022 | EUR 297.658 |
| 2023 | EUR 347.878 |
| 2024 | EUR 359.818 |
| 2025 | EUR 371.314 |
Hoger
59.500
Praktisch
26.370
Middelbaar
46.030
Europa
16.780
Nederland
112.815
Buiten Europa
33.035
Label A
23.919
Label C
20.020
Label B
10.981
Label D
7.140
Label E
5.880
Label G
5.719
Label F
4.840
Label A+
2.692
Label A++
1.966
Label A+++
1.100
Label A++++
111
Label A+++++
12
| Year | Gas (m3) | Electricity (kWh) |
|---|---|---|
| 2020 | 1.053 | 2.382 |
| 2021 | 1.196 | 2.412 |
| 2022 | 956 | 2.277 |
| 2023 | 805 | 2.148 |
| 2024 | 795 | 2.181 |
Hoekwoning
Gas: 1.065 • Electricity: 2.616
Huurwoning
Gas: 717 • Electricity: 1.885
Koopwoning
Gas: 921 • Electricity: 2.495
Appartement
Gas: 628 • Electricity: 1.697
Tussenwoning
Gas: 907 • Electricity: 2.418
Vrijstaande woning
Gas: 1.708 • Electricity: 4.204
Twee-onder-één-kap woning
Gas: 1.228 • Electricity: 3.043
Total number of company establishments: 21.485
| Period | Crimes |
|---|---|
| jan 2026 | 823 |
| jul 2025 | 1.226 |
| jun 2025 | 913 |
| mei 2025 | 970 |
| mrt 2025 | 906 |
| mrt 2026 | 940 |
| nov 2024 | 973 |
| nov 2025 | 986 |
| okt 2024 | 1.015 |
| okt 2025 | 1.044 |
| sep 2024 | 825 |
| sep 2025 | 986 |
These figures give an indicative picture of safety trends in the living environment of Nijmegen.
Short answers based on current local statistics, handy for a quick comparison of the living environment.
Nijmegen telt in 2026 ongeveer 162.473 inwoners.
De gemiddelde WOZ-waarde in Nijmegen is in 2025 circa € 371.314.
Het gemiddelde inkomen per inwoner in Nijmegen ligt rond € 32.906 per jaar.
Voor het huidige jaar gaat het om ongeveer 11.524 geregistreerde misdrijven. Gebruik deze cijfers als indicatie en vergelijk trends per periode.
In Nijmegen komt vooral "Appartementen" veel voor, met ongeveer 41.653 woningen.