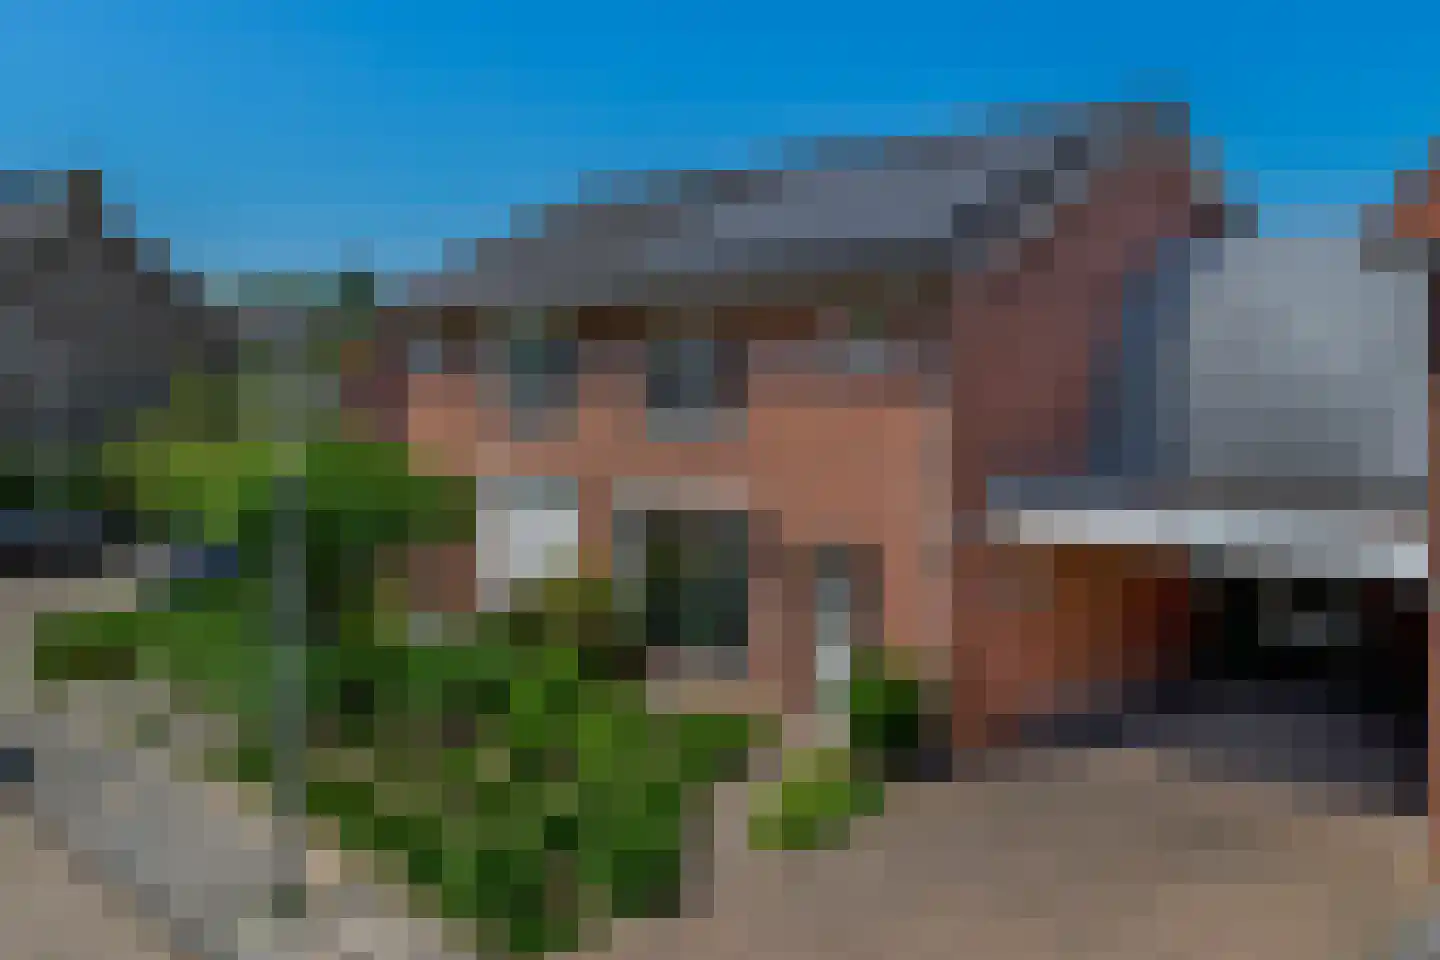
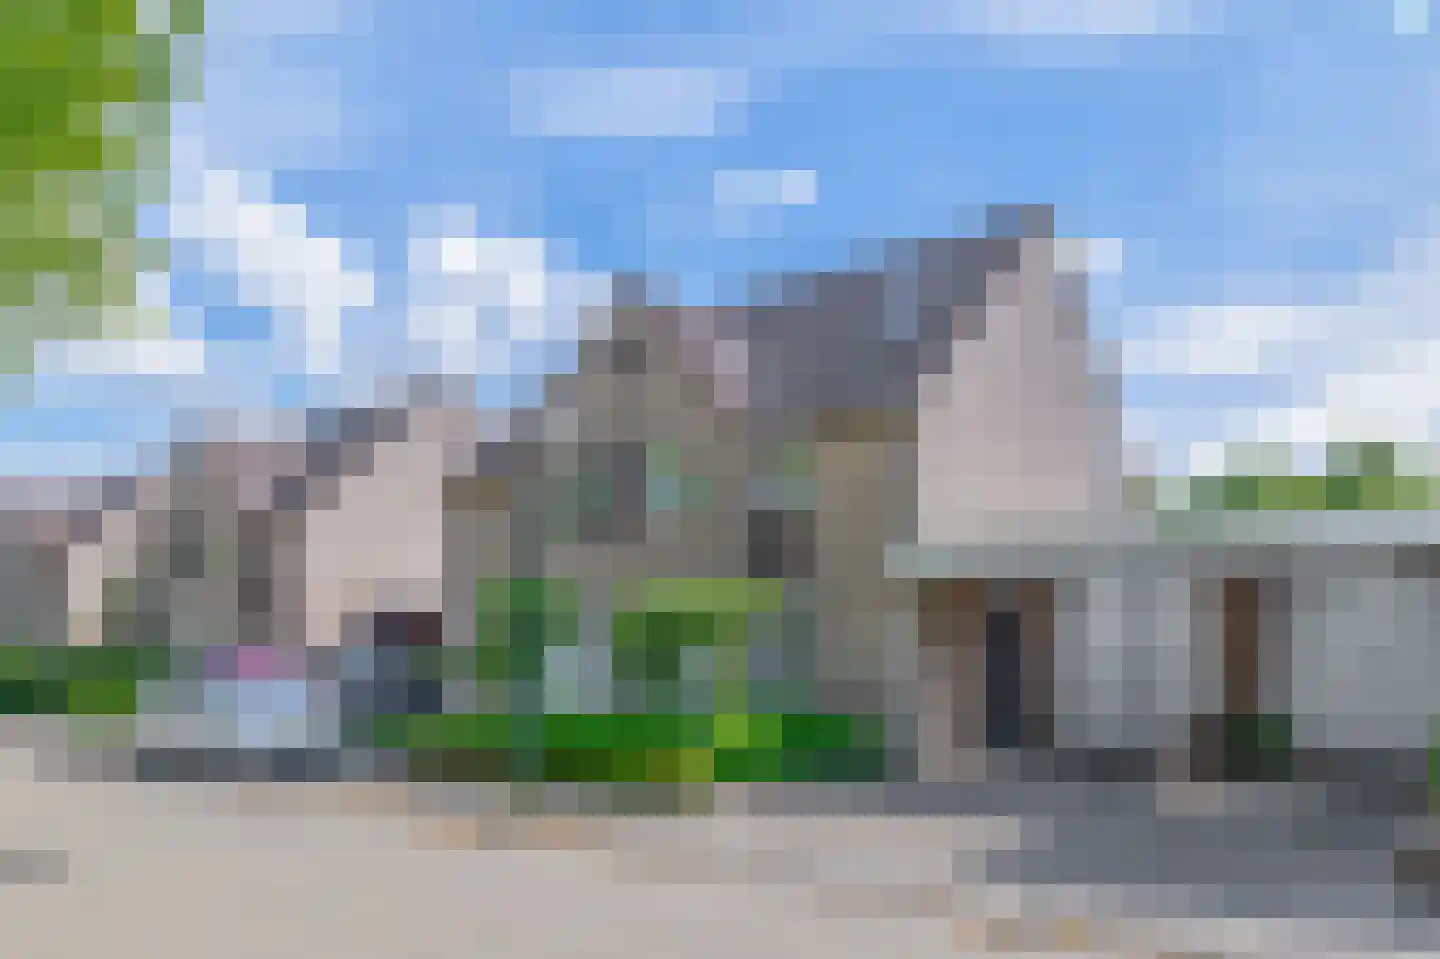
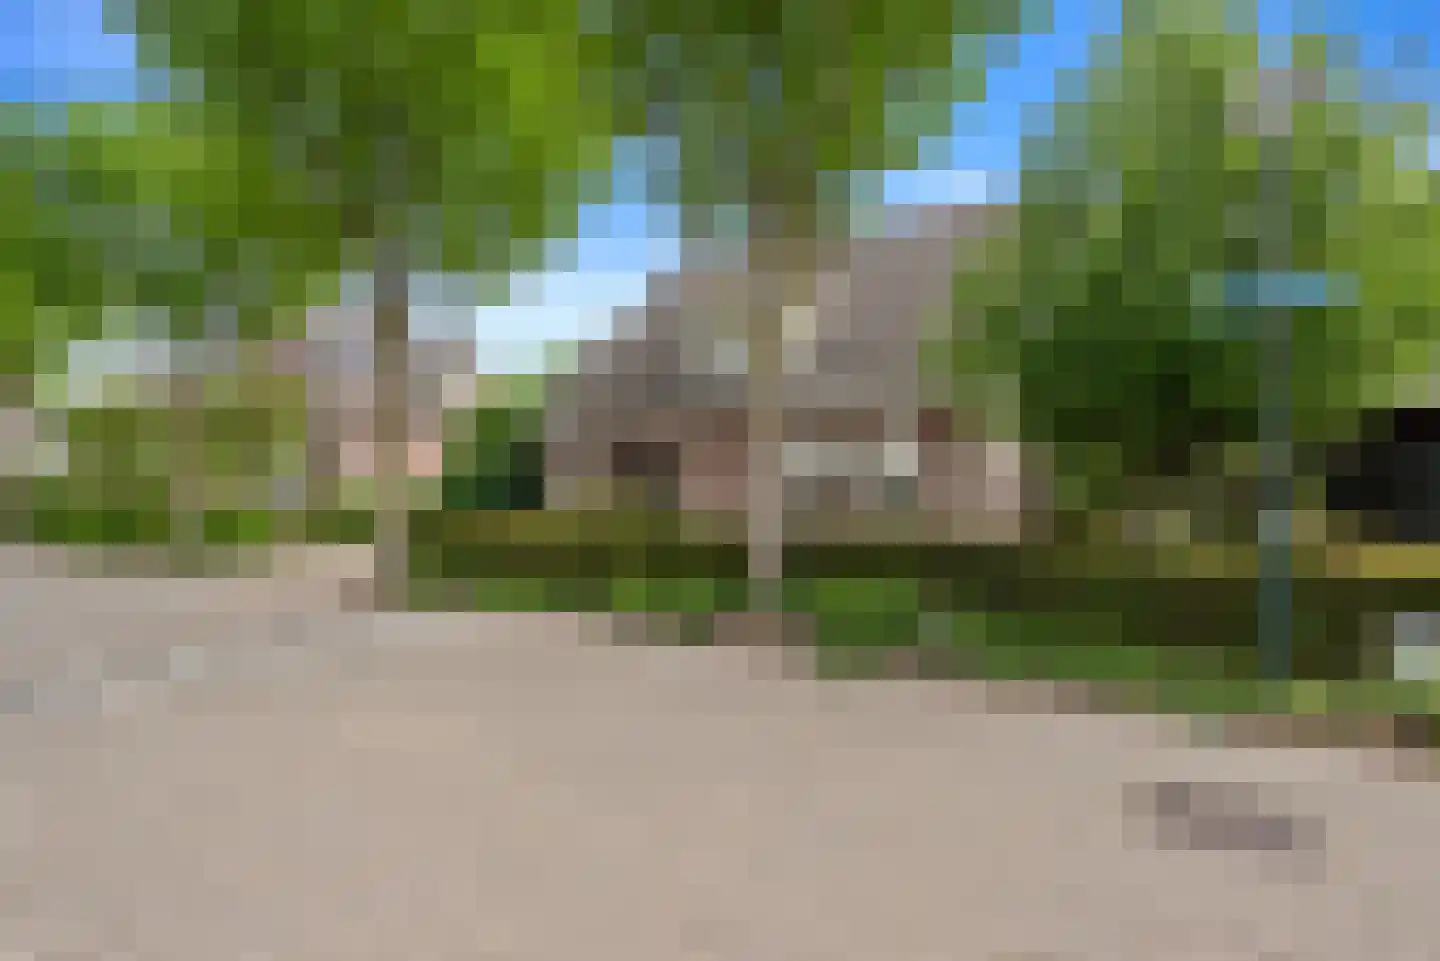
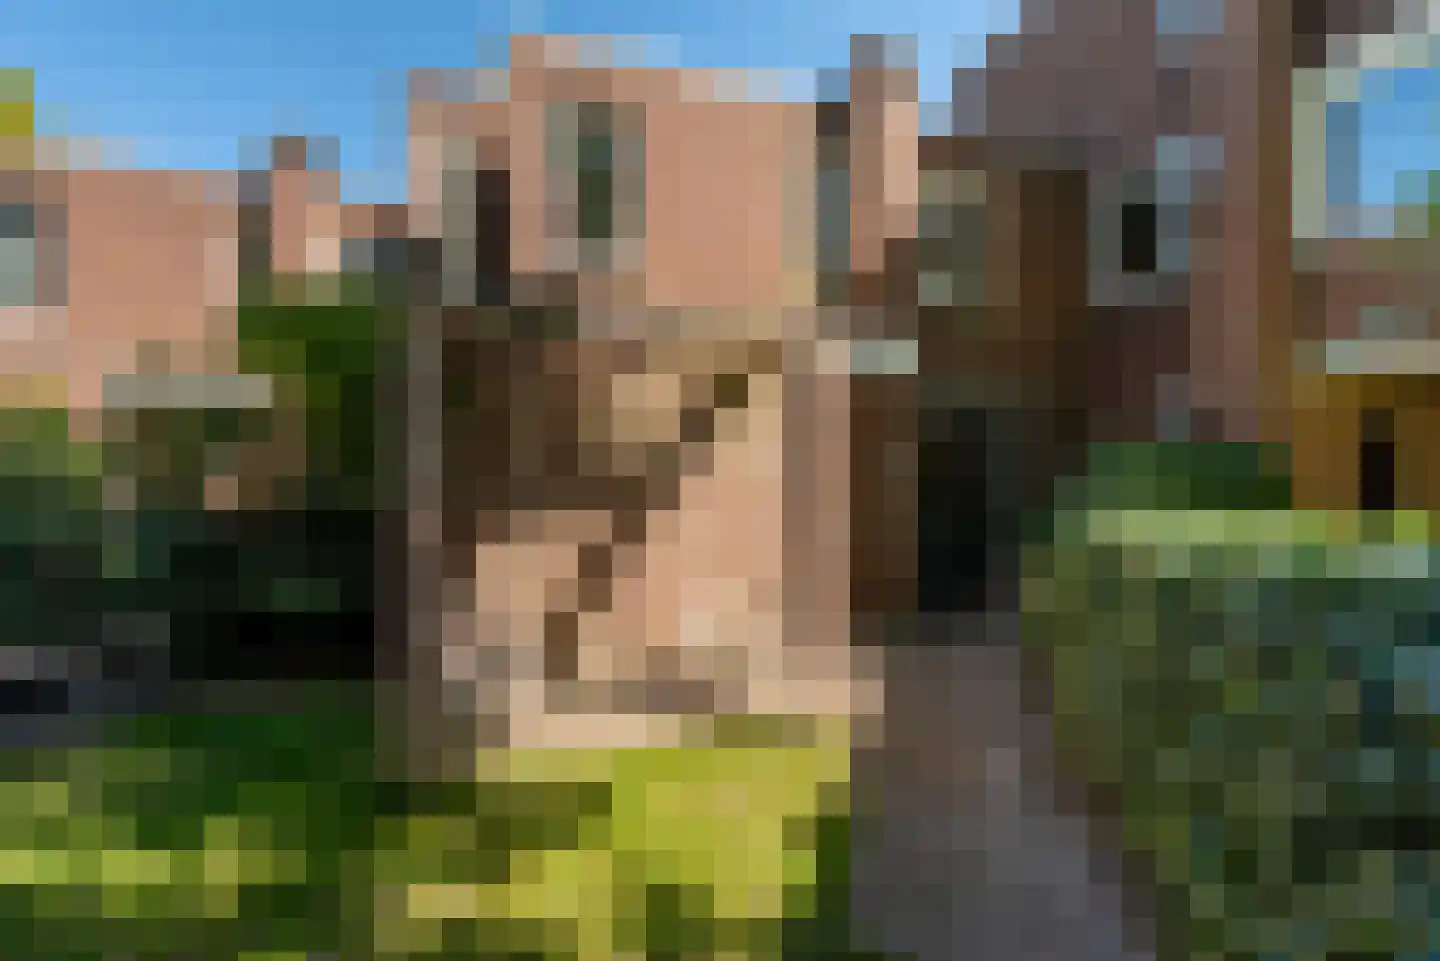
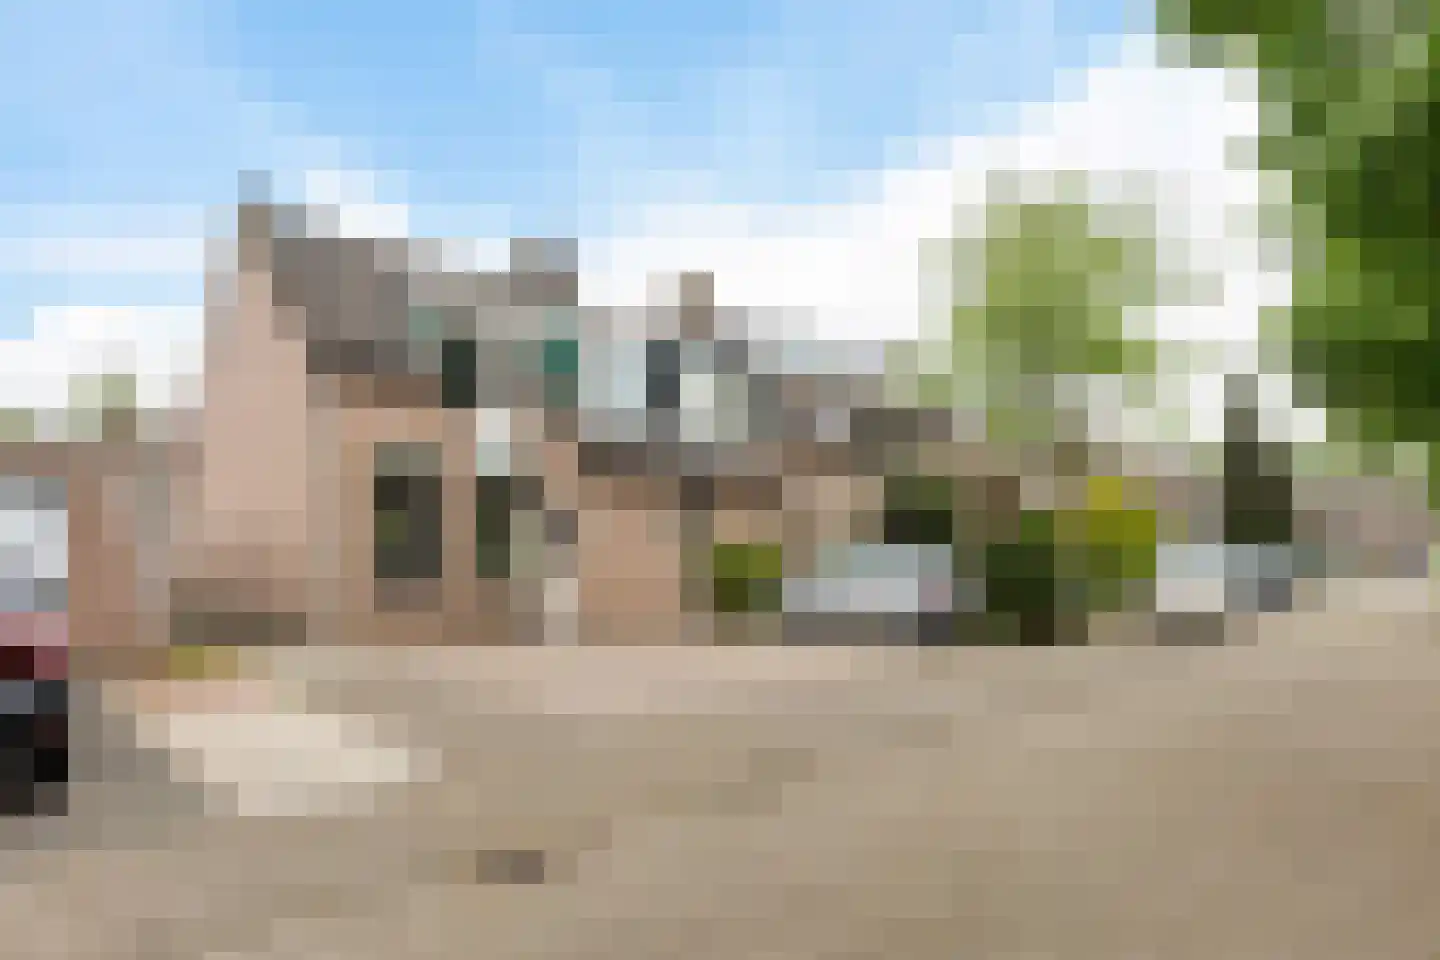
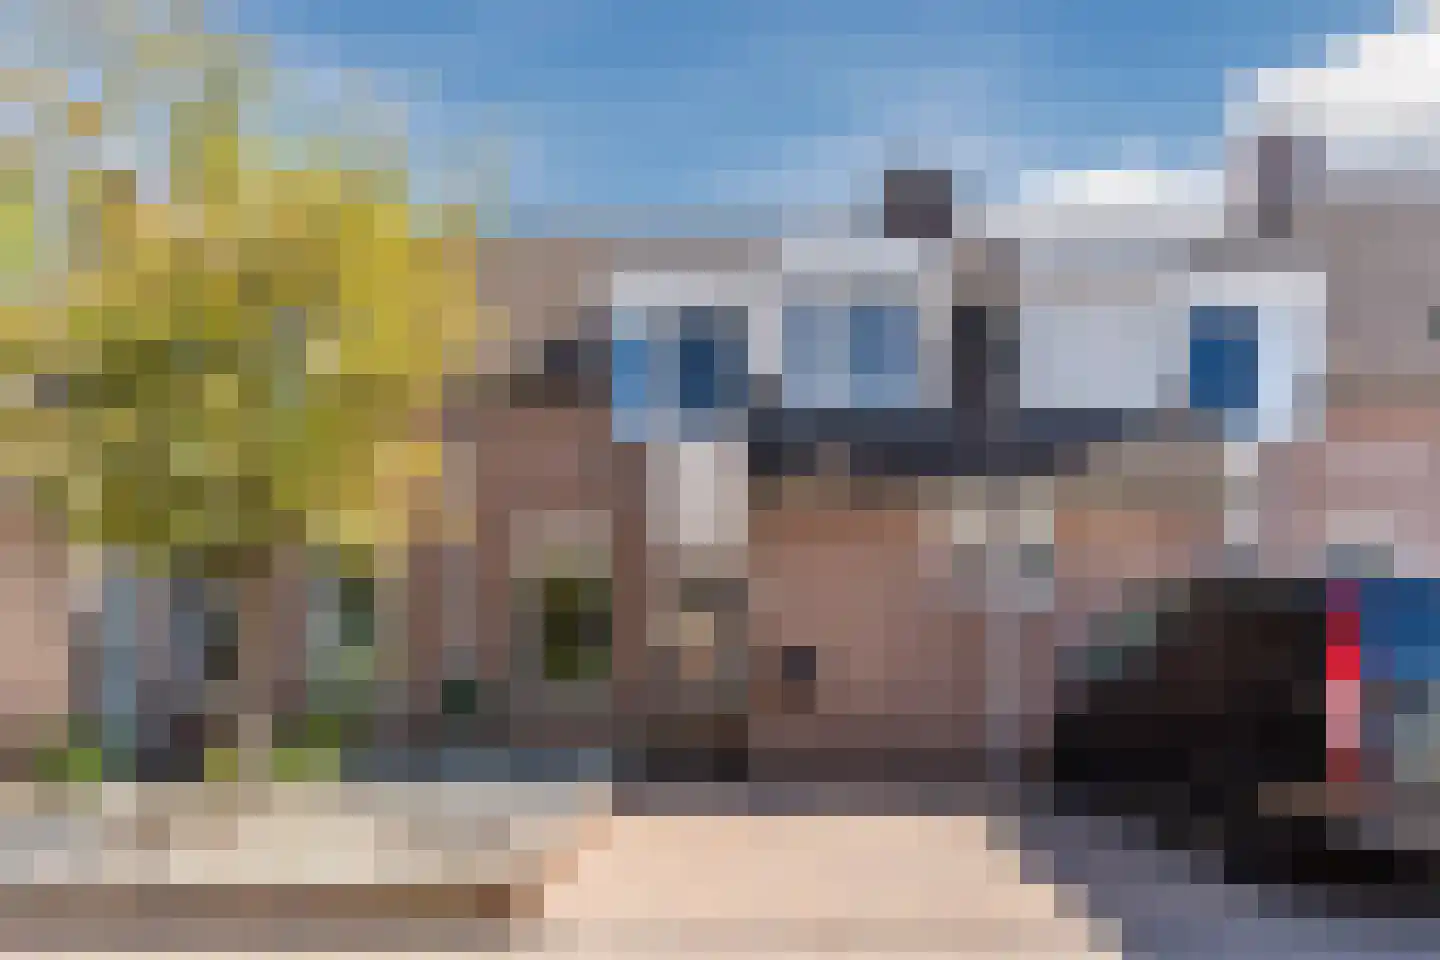
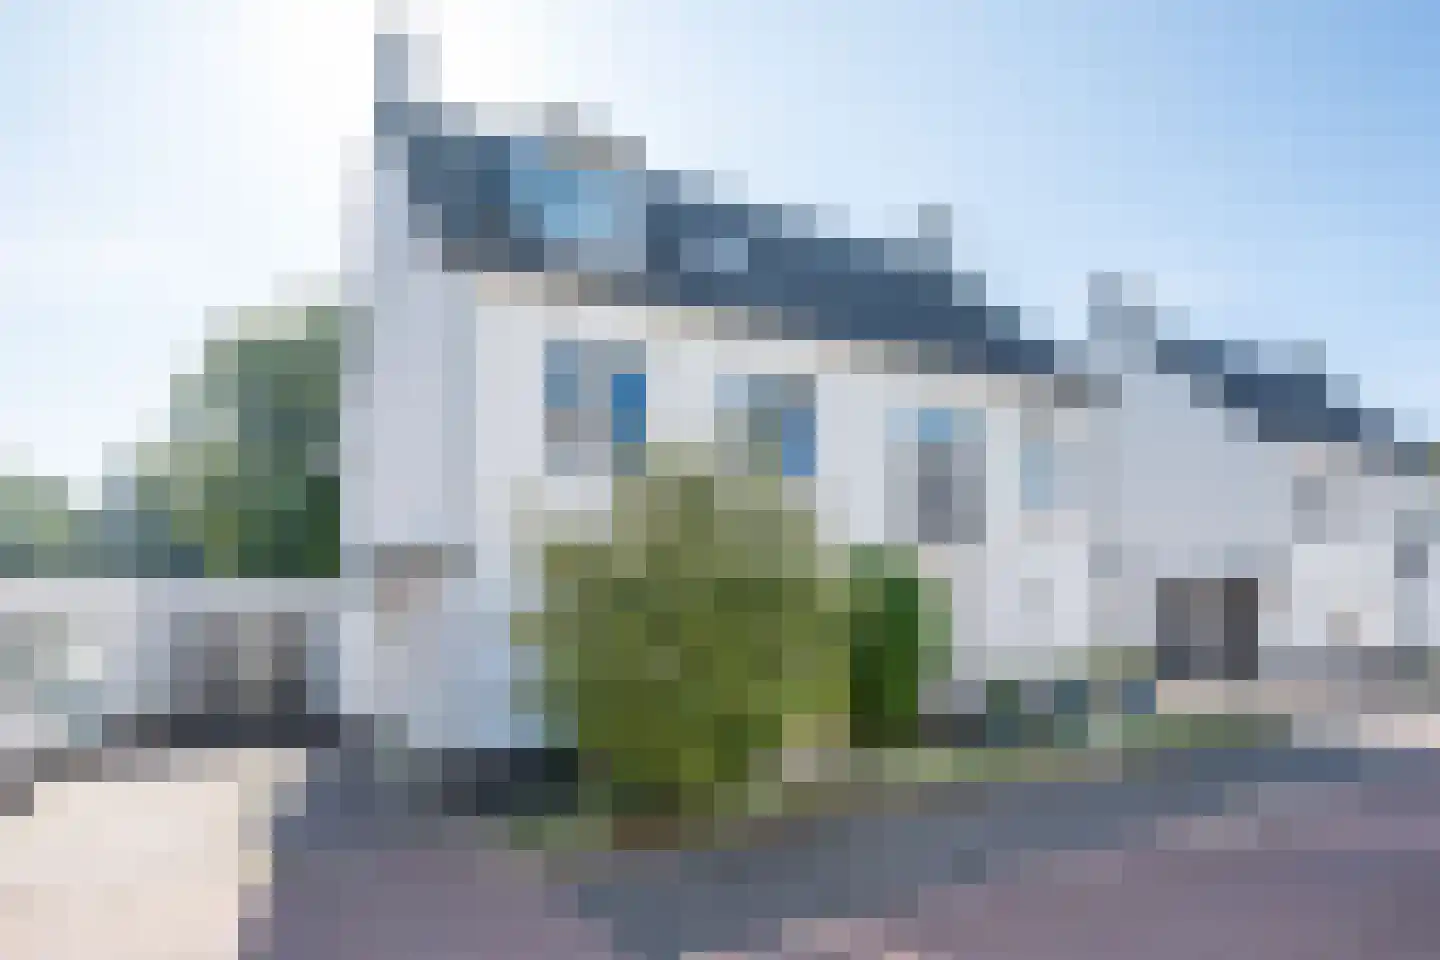
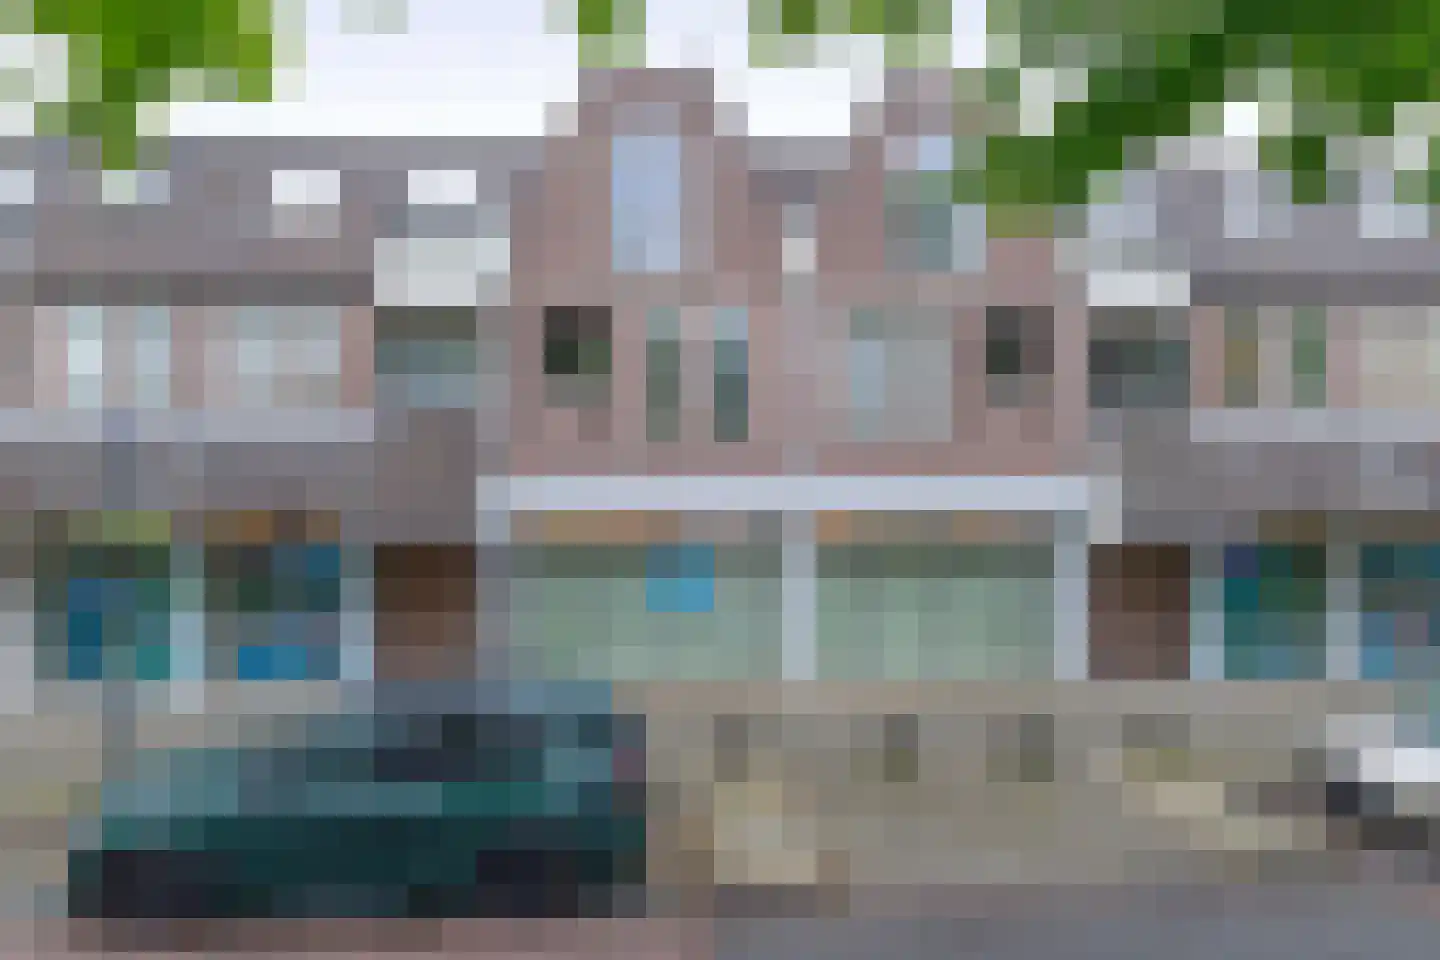
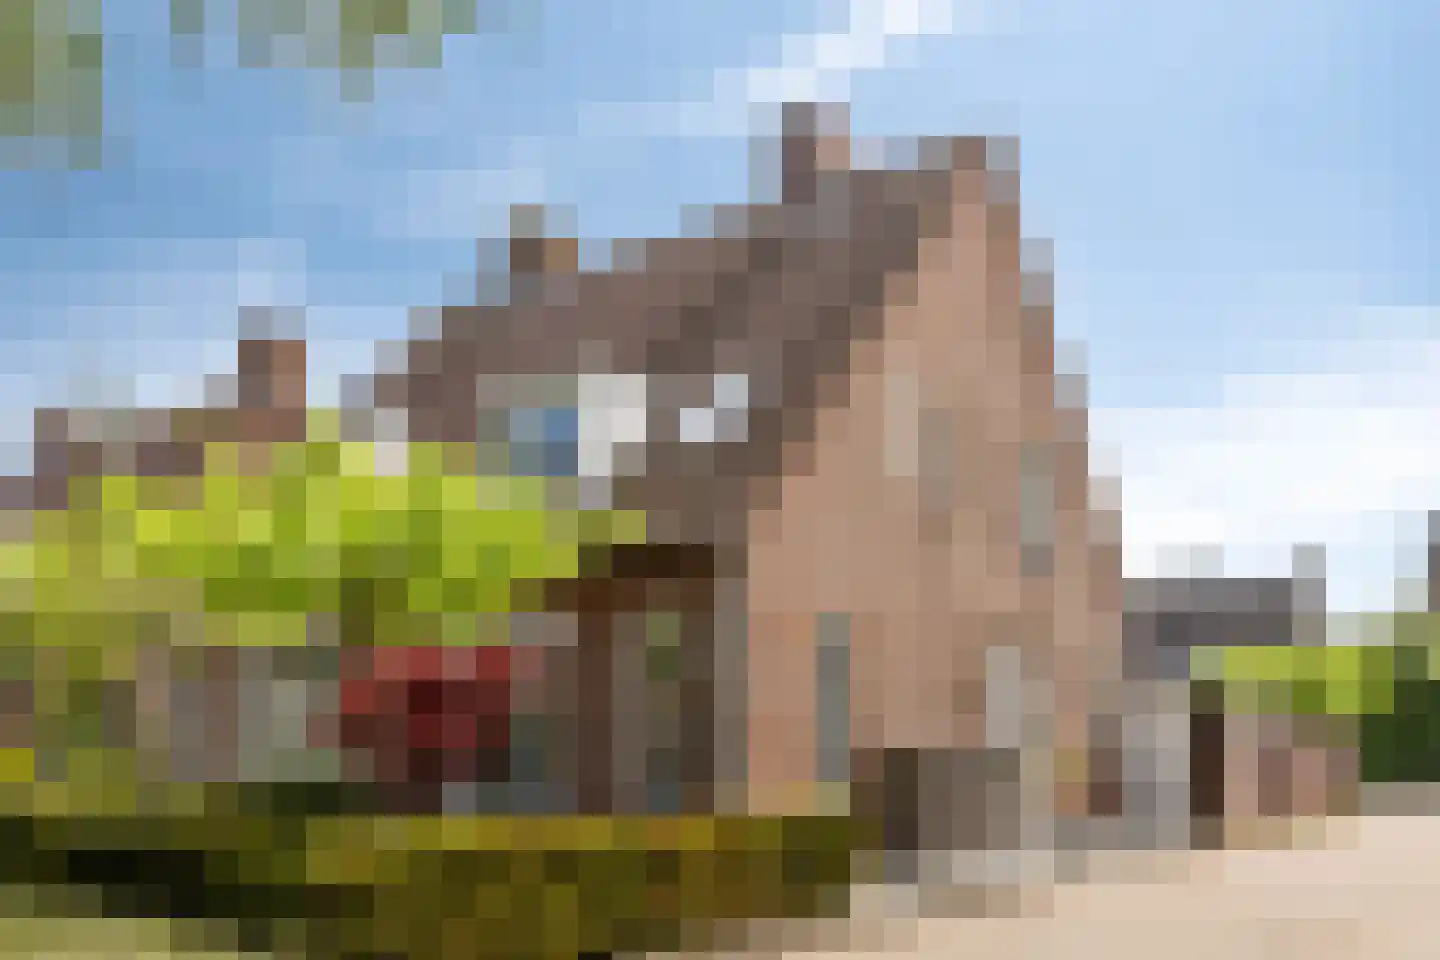
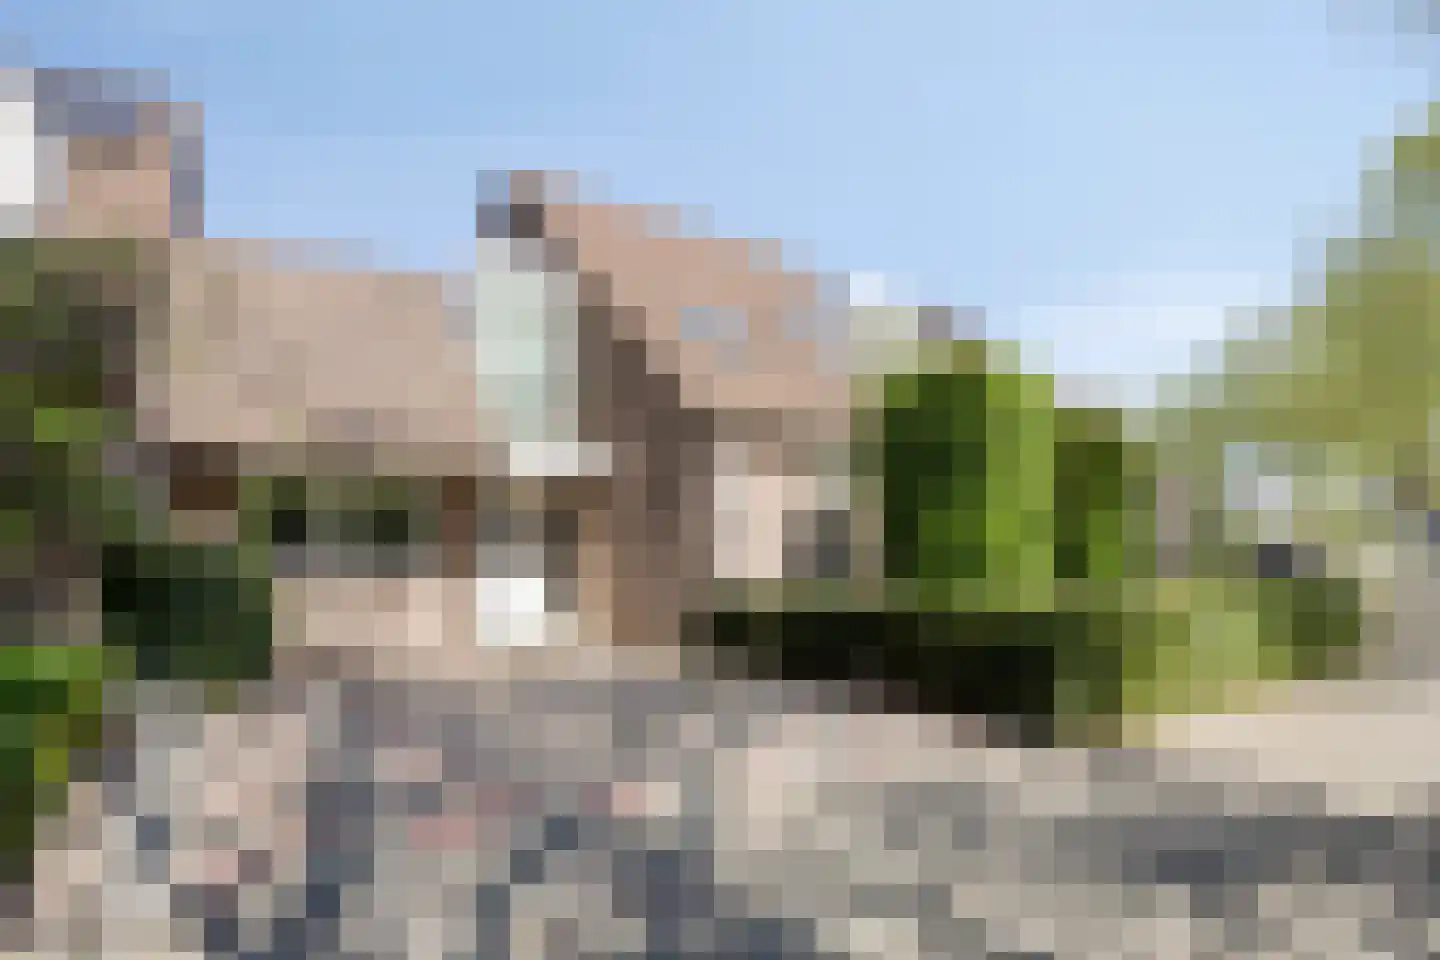
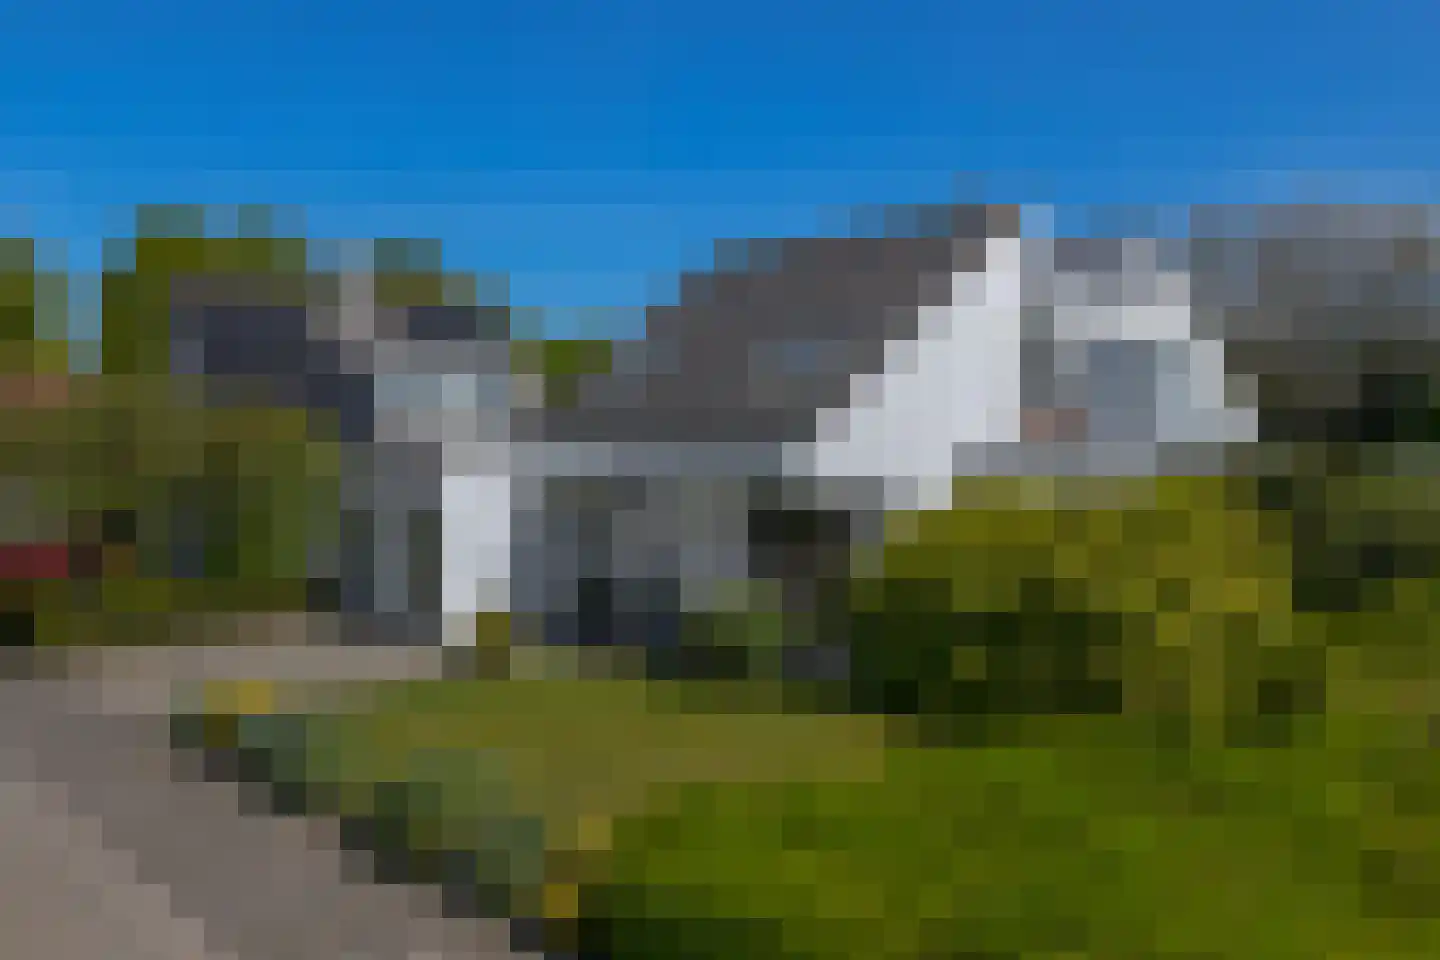
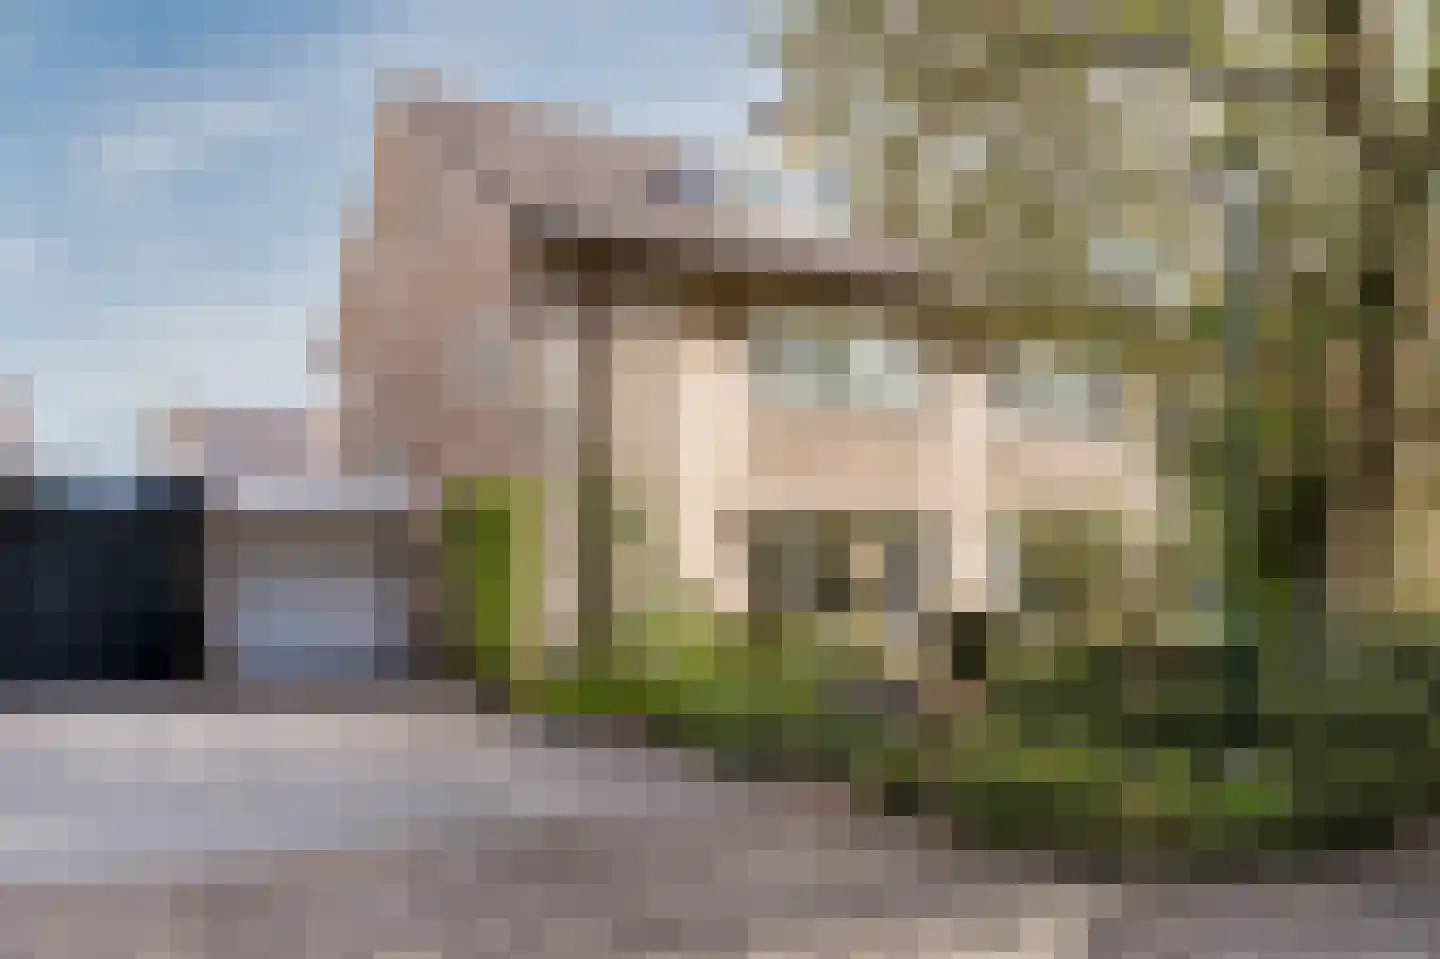
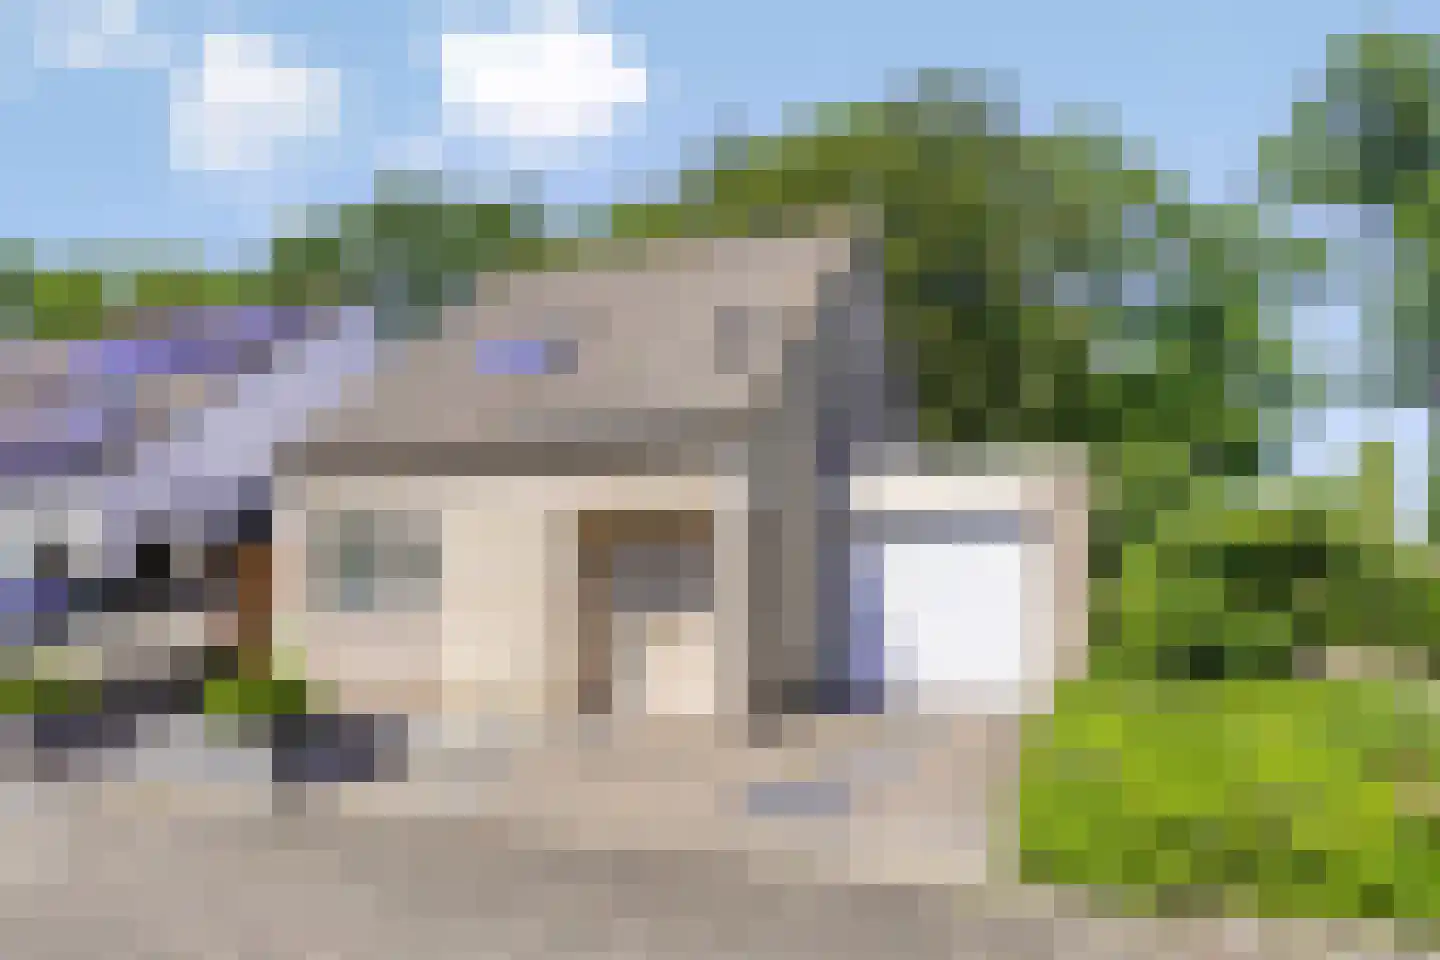
Housing offer in Nuenen

Searching in 293 houses in Nuenen

Connected to: Vastgoed Nederland NVM Makelaars

View the current housing stock in Nuenen and quickly filter by price, living area, rooms and more. There are currently 293 houses in this place within our selection. View also 219 sold houses in Nuenen for extra insight into the local housing market.

Selection

Search and filter homes

Set your preferences and discover homes that suit you.

Total supply 242.654
Filters

Set price, area and other characteristics. Adjust a filter or click on Show homes. Location changes directly above.

Reset filters

You search for

  • Place Nuenen

Selling a home in Nuenen? Compare realtor offers

Get free quotes from real estate agents with local market knowledge. Compare more than 147 real estate agents in Nuenen.

Free request a quote

  • Quotes in Nuenen
  • Non-binding
  • Personal
  • Compare free rates

Selling a home in Nuenen? View the sales-oriented guide sell a house in Nuenen, compare all real estate agents in Nuenen or view the top 10 real estate agents in Nuenen for extra context to your choice.

Compare multiple quotes

Real estate agents make sharper offers when they know you're comparing — ask for quotes for sale or purchase.

Frequently asked questions about homes in Nuenen

Practical answers about housing supply, sales and comparing real estate agents in Nuenen.

Residential and neighborhood statistics in Nuenen

View current location data on residents, WOZ development, housing stock, energy consumption, business activity and safety in Nuenen. In 2026 were there 24.467 residents. The average WOZ value in 2025 is EUR 513.000.

These figures help to better assess and compare the housing stock in Nuenen with recent sold homes. Orient yourself then on suitable top real estate agents in Nuenen for sales advice in this region.

Residents

24.467

Last year: 2026

Average WOZ

EUR 513.000

Last year: 2025

Average income per person.

EUR 39.300

Source: AllNumbers

Crimes (current year)

666

Total registered

Demographics and WOZ development

Inhabitants per year

Inhabitants per year in Nuenen
Year Residents
2022 23.826
2023 24.015
2024 24.231
2025 24.290
2026 24.467

Annual WOZ value

WOZ value per year in Nuenen
Year Average WOZ
2021 EUR 370.000
2022 EUR 403.000
2023 EUR 470.000
2024 EUR 491.000
2025 EUR 513.000

Composition of residents

Age build-up

65+: 6.628 0-15: 3.741 15-25: 2.426 25-45: 5.060 45-65: 6.435

Education level

Hoger

44

Praktisch

20

Middelbaar

36

Origin of residents (2025)

Europa

1.909

Nederland

20.042

Buiten Europa

2.339

Housing stock and construction periods

Types of homes

Hoekwoningen 1.952
Appartementen 1.717
Tussenwoningen 4.098
Vrijstaande woningen 2.301
Twee-onder-één-kap woningen 1.194

Construction period of buildings

Voor 1700 2
1700 tot 1900 100
1900 tot 1925 119
1925 tot 1950 371
1950 tot 1970 1.861
1970 tot 1980 2.702
1980 tot 1990 2.134
1990 tot 2000 1.776
2000 tot 2010 330
2010 tot 2020 784
2020 en later 508

Energy and sustainability

Energy label distribution

Label C

3.287

Label A

2.600

Label B

2.428

Label D

1.230

Label F

531

Label G

367

Label A+++

278

Label E

243

Label A+

134

Label A++++

112

Label A++

60

Label A+++++

4

Average energy consumption per year

Average energy consumption per year in Nuenen
Year Gas (m3) Electricity (kWh)
2020 1.440 3.230
2021 1.610 3.260
2022 1.260 3.040
2023 1.040 2.890
2024 1.010 2.990

Consumption per house type

Hoekwoning

Gas: 1.010 • Electricity: 2.820

Huurwoning

Gas: 700 • Electricity: 2.040

Koopwoning

Gas: 1.140 • Electricity: 3.160

Appartement

Gas: 540 • Electricity: 1.740

Tussenwoning

Gas: 940 • Electricity: 2.600

Vrijstaande woning

Gas: 1.490 • Electricity: 4.030

Twee-onder-één-kap woning

Gas: 1.190 • Electricity: 3.330

Business activity in Nuenen (2025)

Handel en HORECA 600
Nijverheid en energie 405
Zakelijke dienstverlening 1.015
Overheid, onderwijs en zorg 645
Landbouw, bosbouw en visserij 65
Vervoer, informatie en communicatie 205
Financiele diensten en onroerendgoed 260
Cultuur, recreatie en overige diensten 350

Total number of company establishments: 3.545

Recent crime statistics

Recent crime statistics in Nuenen
Period Crimes
jan 2025 62
jan 2026 60
jul 2025 42
jun 2025 61
mei 2025 59
mrt 2025 66
nov 2024 61
nov 2025 51
okt 2024 57
okt 2025 57
sep 2024 79
sep 2025 53

These figures give an indicative picture of safety trends in the living environment of Nuenen.

Frequently asked questions about living in Nuenen

Short answers based on current local statistics, handy for a quick comparison of the living environment.

Hoeveel inwoners heeft Nuenen?

Nuenen telt in 2026 ongeveer 24.467 inwoners.

Wat is de gemiddelde WOZ-waarde in Nuenen?

De gemiddelde WOZ-waarde in Nuenen is in 2025 circa € 513.000.

Wat is het gemiddelde inkomen per inwoner in Nuenen?

Het gemiddelde inkomen per inwoner in Nuenen ligt rond € 39.300 per jaar.

Hoe veilig is wonen in Nuenen?

Voor het huidige jaar gaat het om ongeveer 666 geregistreerde misdrijven. Gebruik deze cijfers als indicatie en vergelijk trends per periode.

Welke woningtypen komen het meest voor in Nuenen?

In Nuenen komt vooral "Tussenwoningen" veel voor, met ongeveer 4.098 woningen.

Receive free, non-binding quotes

Compare multiple real estate agents and choose the best match.