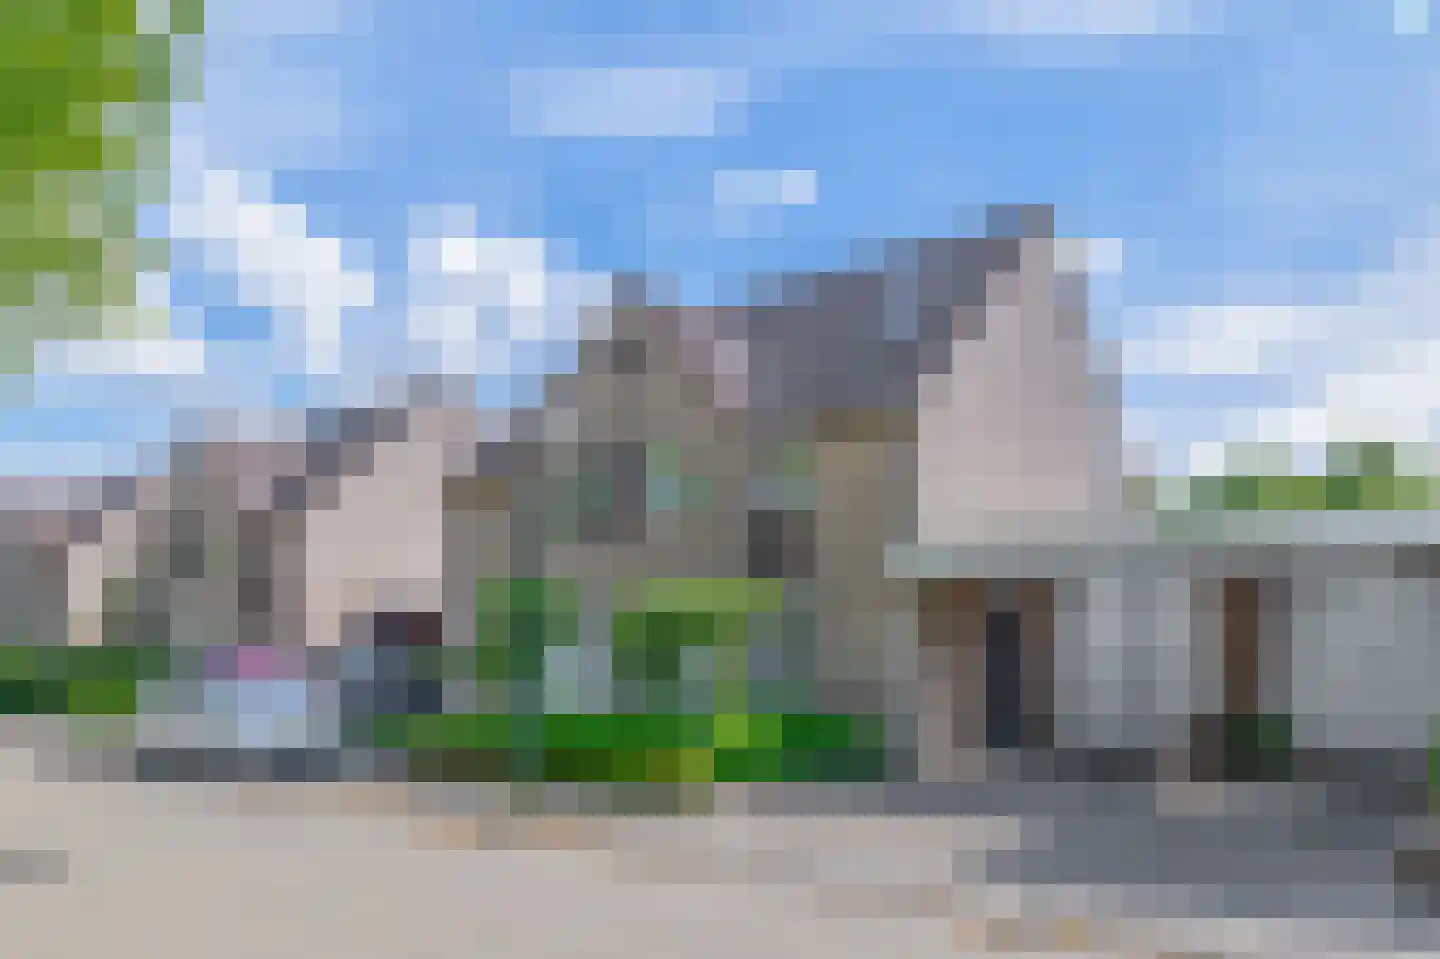
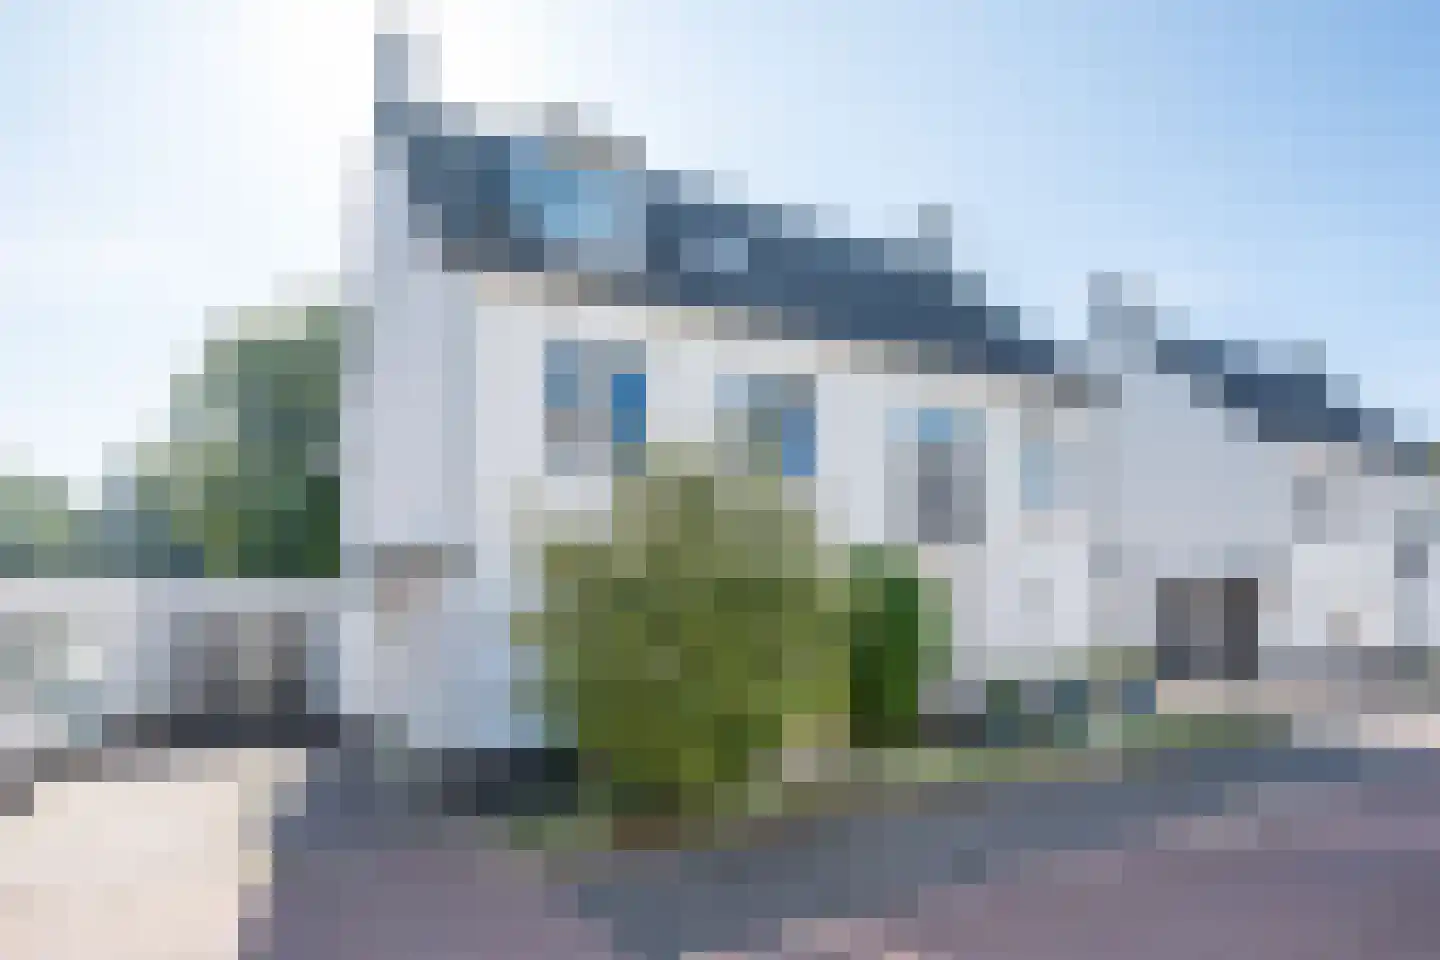
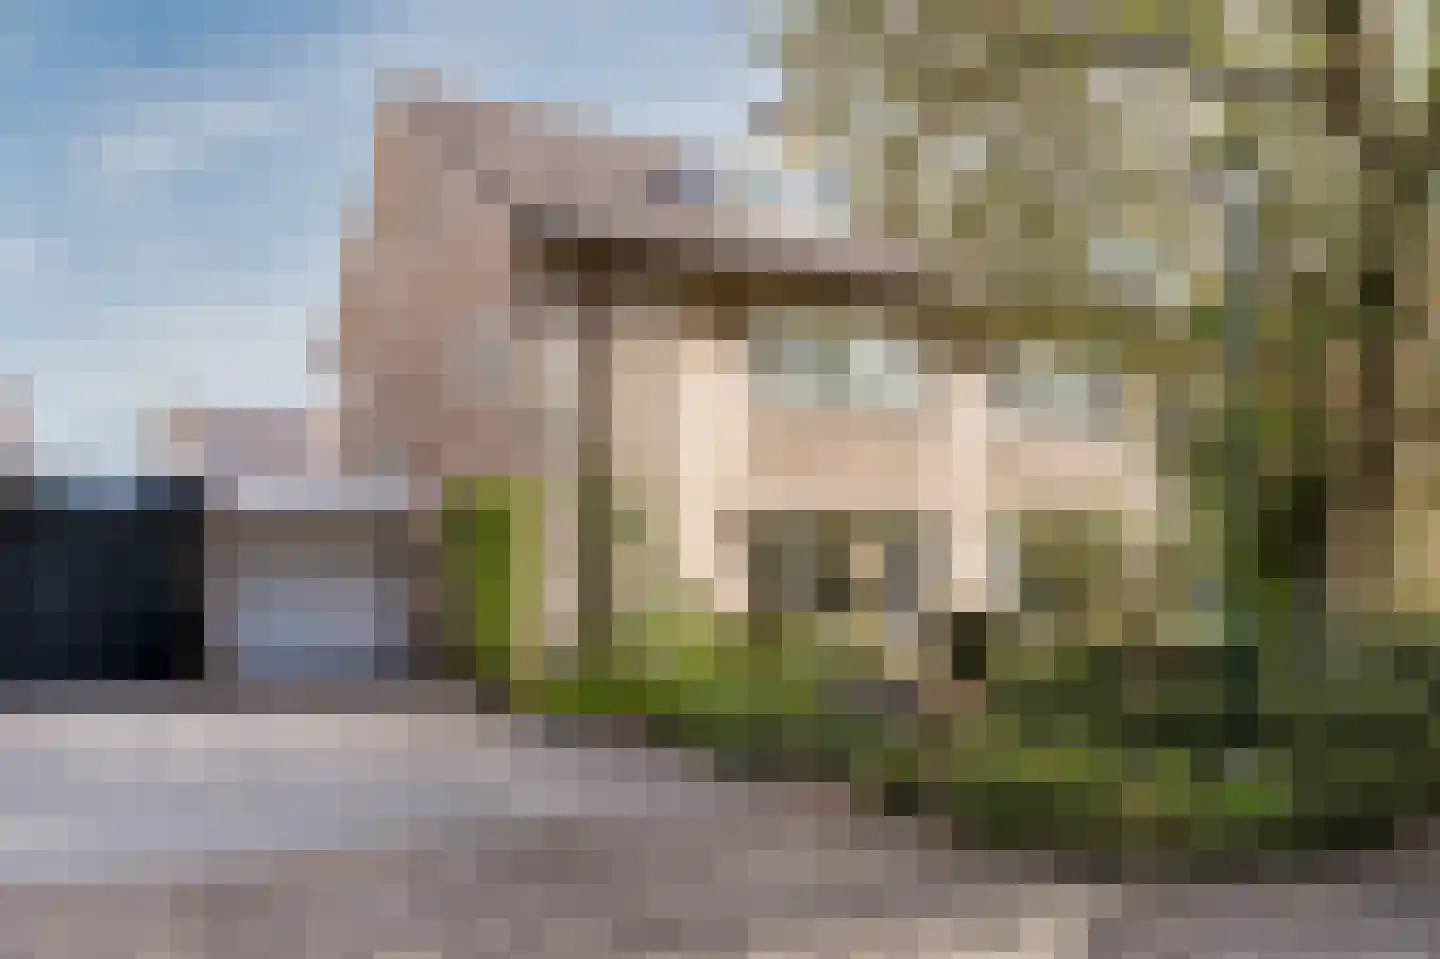
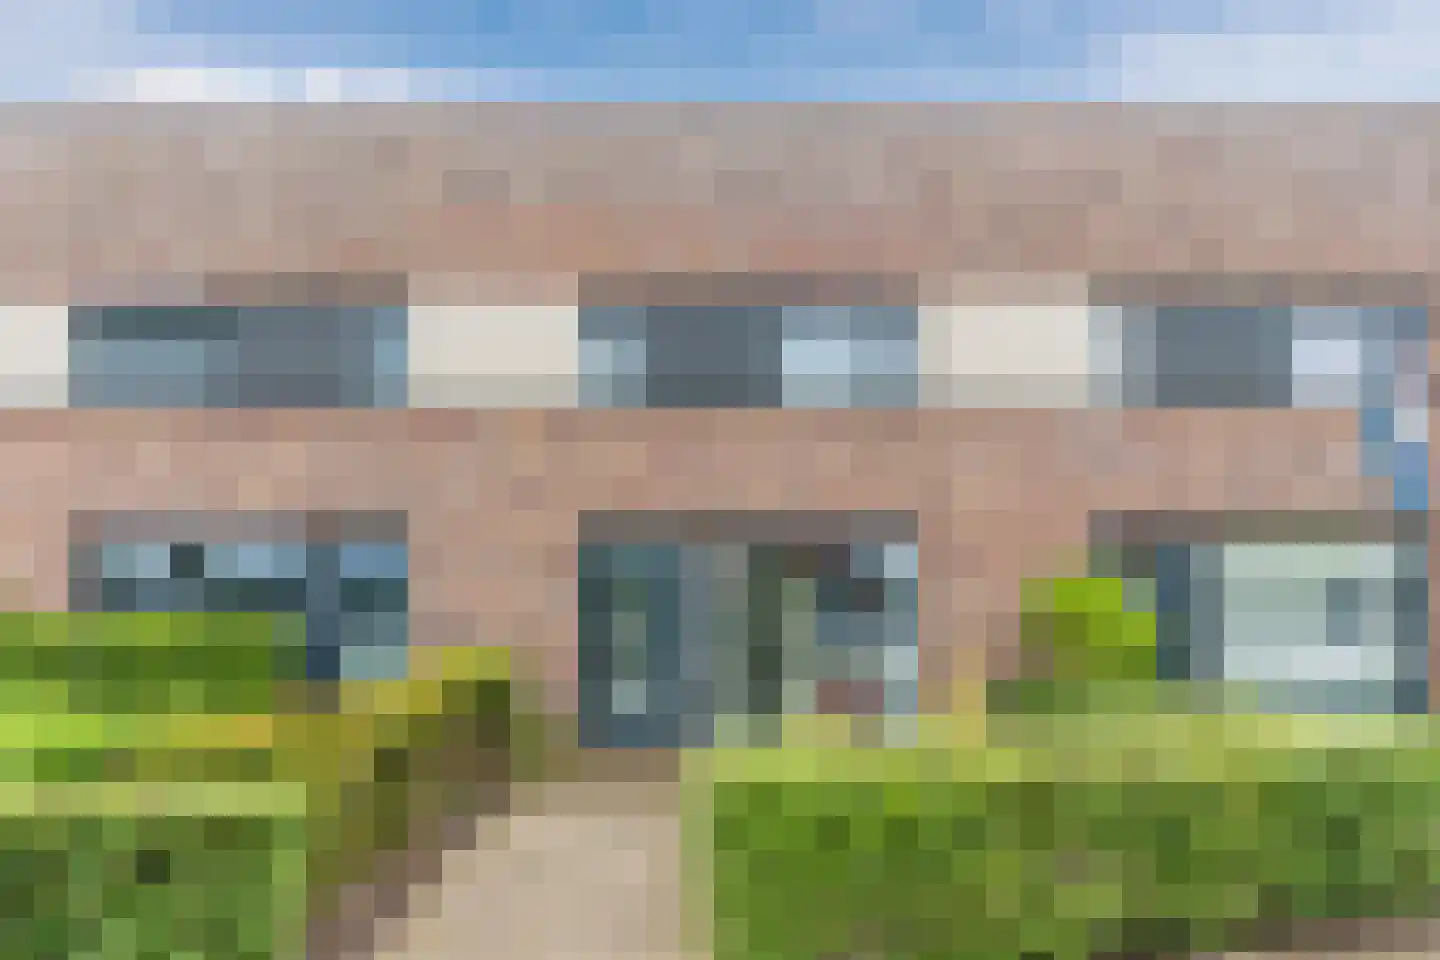
- Available
Nol Rendershof 8
5674MC Nuenen
€ 425.000 k.k.
€ 4.620/m²
- Living area
- 92 m²
- Land area
- 157 m²
- Bedrooms
- 3
Searching in 294 houses in Nuenen
Type to search. Use arrow down and arrow up to navigate through results and press Enter to open.
Hidden search suggestions.
View current properties in Nuenen or search targeted on street, postal code and property characteristics.
View the current housing stock in Nuenen and quickly filter by price, living area, rooms and more. There are currently 294 houses in this place within our selection. View also 219 sold houses in Nuenen for extra insight into the local housing market.
5674MC Nuenen
€ 425.000 k.k.
€ 4.620/m²
5673BD Nuenen
€ 498.000 k.k.
€ 4.150/m²
5671LR Nuenen
€ 2.075 p/m
€ 18/m²
5673MJ Nuenen
€ 1.650 p/m
€ 13/m²
5673MJ Nuenen
€ 1.600 p/m
€ 13/m²
5673NL Nuenen
€ 499.000 k.k.
€ 3.780/m²
5671VK Nuenen
€ 695.000 k.k.
€ 3.994/m²
5671CV Nuenen
€ 295.000 k.k.
€ 4.097/m²
5671GA Nuenen
€ 375.000 k.k.
€ 5.068/m²
5673RL Nuenen
€ 525.000 k.k.
€ 4.646/m²
5673RE Nuenen
€ 632.500 k.k.
€ 5.184/m²
5673TT Nuenen
€ 925.000 k.k.
€ 4.719/m²
5674DC Nuenen
€ 525.000 k.k.
€ 4.861/m²
5672SC Nuenen
€ 529.000 k.k.
€ 3.187/m²
5673LN Nuenen
€ 425.000 k.k.
€ 5.247/m²
5674TJ Nuenen
€ 975.000 k.k.
€ 4.258/m²
5674CT Nuenen
€ 570.000 k.k.
€ 4.488/m²
5673LM Nuenen
€ 425.000 k.k.
€ 4.885/m²
5673KB Nuenen
€ 775.000 k.k.
€ 4.844/m²
5674CZ Nuenen
€ 622.500 k.k.
€ 4.826/m²
5671GW Nuenen
€ 399.000 k.k.
€ 4.290/m²
5673MX Nuenen
€ 519.000 k.k.
€ 5.406/m²
5673PA Nuenen
€ 599.000 k.k.
€ 3.309/m²
5672TH Nuenen
€ 439.000 k.k.
5671KB Nuenen
€ 599.000 k.k.
5674VW Nuenen
€ 499.000 k.k.
5673BA Nuenen
€ 1.075.000 k.k.
5672XE Nuenen
€ 635.000 k.k.
Get free quotes from real estate agents with local market knowledge. Compare more than 147 real estate agents in Nuenen.
Selling a home in Nuenen? View the sales-oriented guide sell a house in Nuenen, compare all real estate agents in Nuenen or view the top 10 real estate agents in Nuenen for extra context to your choice.
Real estate agents make sharper offers when they know you're comparing — ask for quotes for sale or purchase.
Practical answers about housing supply, sales and comparing real estate agents in Nuenen.
The costs of a real estate agent in Nuenen depend on commission, setup costs, property presentation and the chosen service. Compare the 147 real estate agents in Nuenen via the real estate agent page and request multiple quotes to compare rates and approach well.
Within our selection, we are currently showing 294 houses in Nuenen. View also the sold houses in Nuenen to compare the current offering with recent transactions.
Take into account not only price and living area but also maintenance, energy label, location, outdoor space and sales status. This way you compare houses in Nuenen on more than just the asking price.
A local real estate agent knows the neighborhoods, recent transactions and demand in Nuenen. By comparing 147 real estate agents in the region you get a better insight into prices, sales strategy and expected yield; the top 10 in Nuenen provides a useful starting point.
Yes, when making a sales plan, a valuation in Nuenen is wise. You gain insight into a realistic asking price and can then compare offers from real estate agents specifically.
View current location data on residents, WOZ development, housing stock, energy consumption, business activity and safety in Nuenen. In 2026 were there 24.467 residents. The average WOZ value in 2025 is EUR 513.000.
These figures help to better assess and compare the housing stock in Nuenen with recent sold homes. Orient yourself then on suitable top real estate agents in Nuenen for sales advice in this region.
Residents
24.467
Last year: 2026
Average WOZ
EUR 513.000
Last year: 2025
Average income per person.
EUR 39.300
Source: AllNumbers
Crimes (current year)
666
Total registered
| Year | Residents |
|---|---|
| 2022 | 23.826 |
| 2023 | 24.015 |
| 2024 | 24.231 |
| 2025 | 24.290 |
| 2026 | 24.467 |
| Year | Average WOZ |
|---|---|
| 2021 | EUR 370.000 |
| 2022 | EUR 403.000 |
| 2023 | EUR 470.000 |
| 2024 | EUR 491.000 |
| 2025 | EUR 513.000 |
Hoger
44
Praktisch
20
Middelbaar
36
Europa
1.909
Nederland
20.042
Buiten Europa
2.339
Label C
3.287
Label A
2.600
Label B
2.428
Label D
1.230
Label F
531
Label G
367
Label A+++
278
Label E
243
Label A+
134
Label A++++
112
Label A++
60
Label A+++++
4
| Year | Gas (m3) | Electricity (kWh) |
|---|---|---|
| 2020 | 1.440 | 3.230 |
| 2021 | 1.610 | 3.260 |
| 2022 | 1.260 | 3.040 |
| 2023 | 1.040 | 2.890 |
| 2024 | 1.010 | 2.990 |
Hoekwoning
Gas: 1.010 • Electricity: 2.820
Huurwoning
Gas: 700 • Electricity: 2.040
Koopwoning
Gas: 1.140 • Electricity: 3.160
Appartement
Gas: 540 • Electricity: 1.740
Tussenwoning
Gas: 940 • Electricity: 2.600
Vrijstaande woning
Gas: 1.490 • Electricity: 4.030
Twee-onder-één-kap woning
Gas: 1.190 • Electricity: 3.330
Total number of company establishments: 3.545
| Period | Crimes |
|---|---|
| jan 2025 | 62 |
| jan 2026 | 60 |
| jul 2025 | 42 |
| jun 2025 | 61 |
| mei 2025 | 59 |
| mrt 2025 | 66 |
| nov 2024 | 61 |
| nov 2025 | 51 |
| okt 2024 | 57 |
| okt 2025 | 57 |
| sep 2024 | 79 |
| sep 2025 | 53 |
These figures give an indicative picture of safety trends in the living environment of Nuenen.
Short answers based on current local statistics, handy for a quick comparison of the living environment.
Nuenen telt in 2026 ongeveer 24.467 inwoners.
De gemiddelde WOZ-waarde in Nuenen is in 2025 circa € 513.000.
Het gemiddelde inkomen per inwoner in Nuenen ligt rond € 39.300 per jaar.
Voor het huidige jaar gaat het om ongeveer 666 geregistreerde misdrijven. Gebruik deze cijfers als indicatie en vergelijk trends per periode.
In Nuenen komt vooral "Tussenwoningen" veel voor, met ongeveer 4.098 woningen.