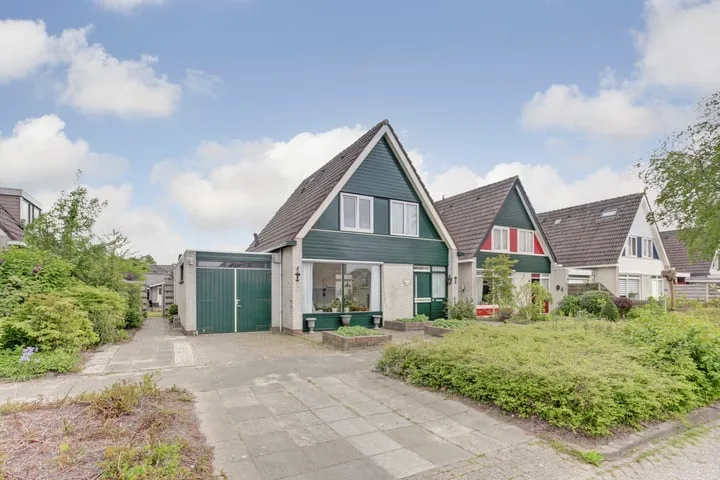
- Sold
Weegbree 23
1716VR Opmeer
€ 350.000 k.k.
€ 3.271/m²
- Living area
- 107 m²
- Land area
- 143 m²
- Bedrooms
- 3
View 16 sold houses in Opmeer
Type to search. Use arrow down and arrow up to navigate through results and press Enter to open.
Hidden search suggestions.
Compare sold homes in Opmeer or view the current offering in this location directly.
On this page you will find recently sold homes in Opmeer. Use this overview to better estimate selling prices, popular neighborhoods, and the local housing supply before you choose a real estate agent. Also view the current housing supply with 26 houses in Opmeer.
1716VR Opmeer
€ 350.000 k.k.
€ 3.271/m²
1716VA Opmeer
€ 345.000 k.k.
€ 3.317/m²
1716VR Opmeer
€ 439.000 k.k.
€ 3.752/m²
1716VL Opmeer
€ 595.000 k.k.
€ 3.765/m²
1716VV Opmeer
€ 350.000 k.k.
€ 3.645/m²
1716VS Opmeer
€ 390.000 k.k.
€ 4.193/m²
1716DP Opmeer
Price upon request
1716DS Opmeer
€ 325.000 k.k.
€ 5.078/m²
1716WG Opmeer
€ 375.000 k.k.
€ 0/m²
1716DS Opmeer
€ 392.500
€ 5.164/m²
1716DP Opmeer
€ 475.000 k.k.
€ 3.625/m²
1716KK Opmeer
€ 150.000 k.k.
€ 2.586/m²
1716DR Opmeer
€ 495.000 k.k.
€ 3.300/m²
1716KC Opmeer
€ 895.000 k.k.
€ 5.593/m²
1716DN Opmeer
€ 685.000 k.k.
€ 3.682/m²
1716WC Opmeer
€ 475.000 k.k.
€ 4.130/m²
Bekijk recente verkopen en ontvang gratis offertes van lokale verkoopmakelaars in Opmeer.
Zelf je woning verkopen in Opmeer? Vergelijk verkoopmakelaars in Opmeer of bekijk de beste verkoopmakelaars in Opmeer als referentie bij jouw keuze.
Makelaars maken scherpere voorstellen als ze weten dat je vergelijkt — vraag offertes aan voor verkoop of aankoop.
Short answers about housing prices, sold homes and comparing real estate agents in Opmeer.
The costs of a real estate agent in Opmeer vary per office, property type and sales approach. Therefore, compare multiple quotes and also look at the real estate agents in Opmeer to better compare rates, presentation and local experience.
On this page we currently show 16 sold houses in Opmeer from our selection. This helps you to better assess recent transactions and the local housing market.
Houses sold in Opmeer give insight into asking prices, house types and neighborhoods where recent transactions have taken place. Compare this also with the current housing stock in Opmeer to better understand the market.
You can use sold homes as a first market indication, but a local real estate agent can better take into account finishing, location, maintenance and current demand in Opmeer.
Vergelijk makelaars in Opmeer op lokale verkoopervaring, reviews, verwachte opbrengst, courtage en marketingaanpak. Bekijk verkoopmakelaars in Opmeer of de top 10 makelaars in Opmeer om snel sterke kantoren te ontdekken.
View current location data on residents, WOZ development, housing stock, energy consumption, business activity and safety in Opmeer. In 2025 were there 2.315 residents. The average WOZ value in 2025 is EUR 352.000.
These figures help to better assess and compare the housing stock in Opmeer with recent sold homes. Orient yourself then on suitable top real estate agents in Opmeer for sales advice in this region.
Residents
2.315
Last year: 2025
Average WOZ
EUR 352.000
Last year: 2025
Average income per person.
EUR 29.300
Source: AllNumbers
Crimes (current year)
87
Total registered
| Year | Residents |
|---|---|
| 2021 | 2.096 |
| 2022 | 2.137 |
| 2023 | 2.150 |
| 2024 | 2.140 |
| 2025 | 2.315 |
| Year | Average WOZ |
|---|---|
| 2021 | EUR 288.000 |
| 2022 | EUR 315.000 |
| 2023 | EUR 334.000 |
| 2024 | EUR 342.000 |
| 2025 | EUR 352.000 |
Hoger
340
Praktisch
440
Middelbaar
920
Europa
130
Nederland
1.930
Buiten Europa
255
Label C
480
Label B
290
Label A
228
Label D
83
Label G
47
Label F
29
Label A++
24
Label A+
19
Label E
10
Label A+++
9
Label A+++++
3
Label A++++
0
| Year | Gas (m3) | Electricity (kWh) |
|---|---|---|
| 2020 | 1.250 | 2.950 |
| 2021 | 1.380 | 3.010 |
| 2022 | 1.060 | 2.790 |
| 2023 | 960 | 2.610 |
| 2024 | 930 | 2.600 |
Hoekwoning
Gas: 960 • Electricity: 2.450
Huurwoning
Gas: 740 • Electricity: 2.080
Koopwoning
Gas: 1.040 • Electricity: 2.830
Appartement
Gas: 710 • Electricity: 2.110
Tussenwoning
Gas: 810 • Electricity: 2.320
Vrijstaande woning
Gas: 1.260 • Electricity: 3.530
Twee-onder-één-kap woning
Gas: 1.070 • Electricity: 2.480
Total number of company establishments: 425
| Period | Crimes |
|---|---|
| jan 2025 | 5 |
| jan 2026 | 9 |
| jul 2025 | 6 |
| jun 2025 | 6 |
| mei 2025 | 17 |
| mrt 2025 | 8 |
| nov 2024 | 9 |
| nov 2025 | 11 |
| okt 2024 | 4 |
| okt 2025 | 6 |
| sep 2024 | 4 |
| sep 2025 | 6 |
These figures give an indicative picture of safety trends in the living environment of Opmeer.
Short answers based on current local statistics, handy for a quick comparison of the living environment.
Opmeer telt in 2025 ongeveer 2.315 inwoners.
De gemiddelde WOZ-waarde in Opmeer is in 2025 circa € 352.000.
Het gemiddelde inkomen per inwoner in Opmeer ligt rond € 29.300 per jaar.
Voor het huidige jaar gaat het om ongeveer 87 geregistreerde misdrijven. Gebruik deze cijfers als indicatie en vergelijk trends per periode.
In Opmeer komt vooral "Tussenwoningen" veel voor, met ongeveer 359 woningen.