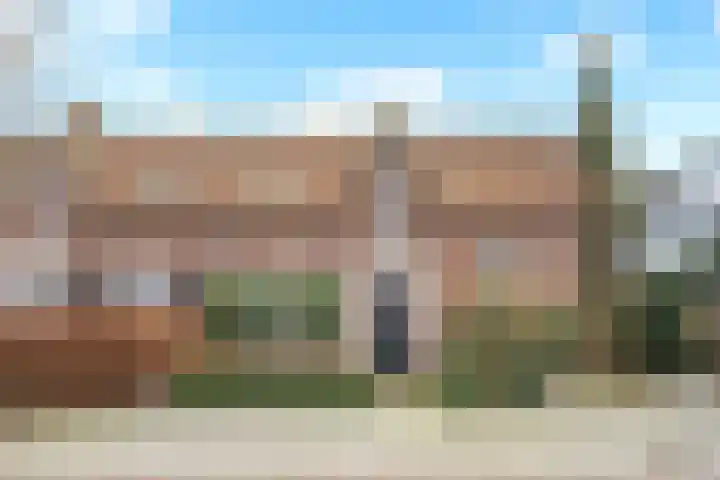
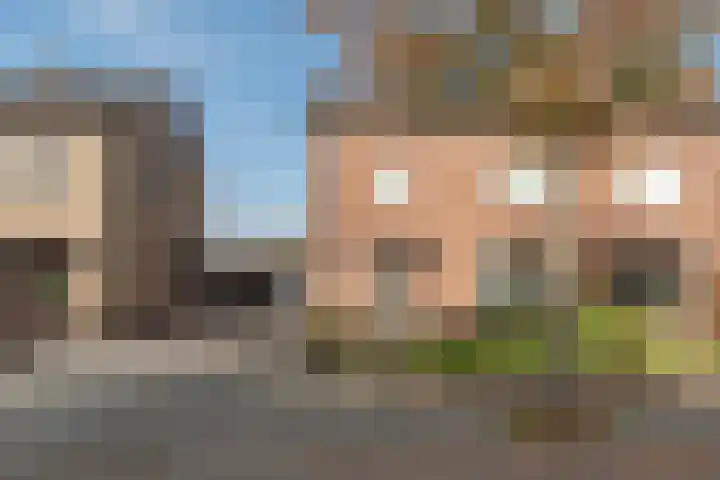
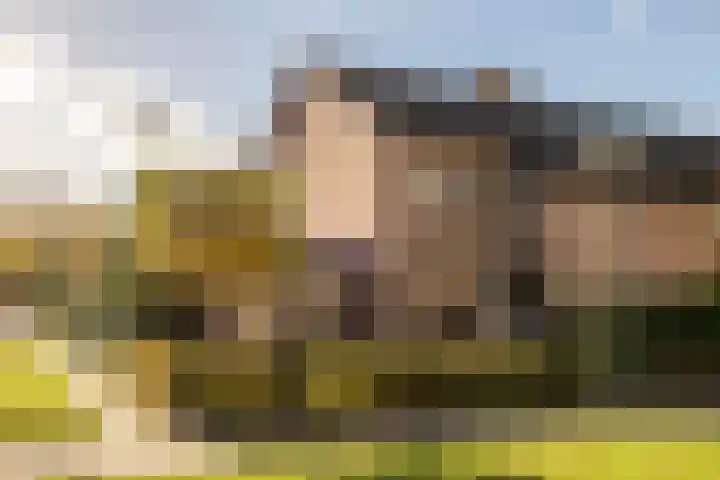
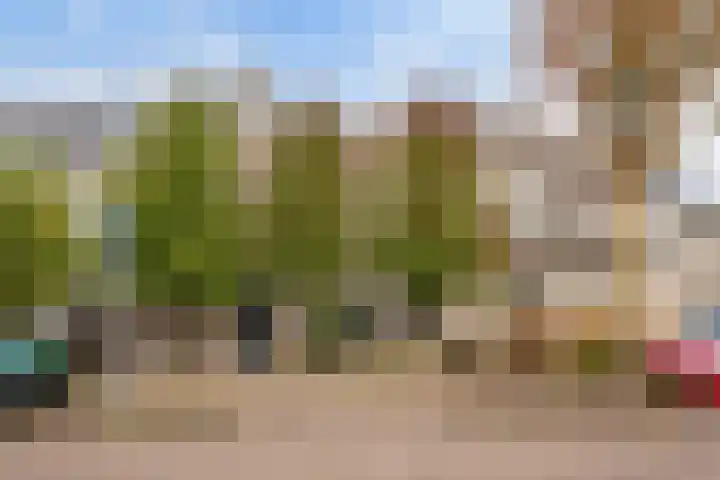
- Sold
Grimhuijsenhof 21
4851AS Ulvenhout
€ 795.000 k.k.
€ 5.678/m²
- Living area
- 140 m²
- Land area
- 180 m²
- Bedrooms
- 4
View 33 sold houses in Ulvenhout
Type to search. Use arrow down and arrow up to navigate through results and press Enter to open.
Hidden search suggestions.
Compare sold homes in Ulvenhout or view the current offering in this location directly.
On this page you will find recently sold homes in Ulvenhout. Use this overview to better estimate selling prices, popular neighborhoods, and the local housing supply before you choose a real estate agent. Also view the current housing supply with 48 houses in Ulvenhout.
4851AS Ulvenhout
€ 795.000 k.k.
€ 5.678/m²
4851AS Ulvenhout
€ 799.000 k.k.
€ 5.626/m²
4851CC Ulvenhout
€ 395.000 k.k.
€ 5.984/m²
4851SW Ulvenhout
€ 950.000 k.k.
€ 4.726/m²
4851BZ Ulvenhout
€ 569.000 k.k.
€ 5.035/m²
4851EN Ulvenhout
€ 515.000 k.k.
€ 6.602/m²
4851VS Ulvenhout
€ 625.000 k.k.
€ 4.464/m²
4851AS Ulvenhout
€ 860.000 k.k.
€ 5.584/m²
4851BP Ulvenhout
€ 650.000 k.k.
€ 4.924/m²
4851SW Ulvenhout
€ 398.000 k.k.
€ 3.790/m²
4851CW Ulvenhout
€ 649.000 k.k.
€ 5.276/m²
4851SK Ulvenhout
€ 798.000 k.k.
€ 3.764/m²
4851CL Ulvenhout
€ 419.000 k.k.
€ 4.457/m²
4851AB Ulvenhout
€ 450.000 k.k.
€ 4.945/m²
4851AG Ulvenhout
€ 498.000 k.k.
€ 5.790/m²
4851BZ Ulvenhout
€ 895.000 k.k.
€ 5.593/m²
4851BN Ulvenhout
€ 750.000 k.k.
€ 4.629/m²
4851TB Ulvenhout
€ 998.000 k.k.
€ 5.483/m²
4851VC Ulvenhout
€ 495.000 k.k.
€ 3.093/m²
4851ED Ulvenhout
€ 1.300.000 k.k.
€ 5.371/m²
4851AB Ulvenhout
€ 525.000 k.k.
€ 5.303/m²
4851CM Ulvenhout
€ 795.000 k.k.
€ 0/m²
4851BR Ulvenhout
€ 789.000 k.k.
€ 0/m²
4851BH Ulvenhout
€ 800.000 k.k.
€ 0/m²
4851CD Ulvenhout
€ 650.000 k.k.
€ 5.078/m²
4851TA Ulvenhout
€ 725.000 k.k.
€ 4.315/m²
4851TB Ulvenhout
€ 795.000 k.k.
€ 4.732/m²
4851BZ Ulvenhout
€ 625.000 k.k.
€ 5.434/m²
Get free quotes from realtors with local market knowledge in Ulvenhout.
Selling a home in Ulvenhout? Compare real estate agents who know the local housing market. Also check out all real estate agents in Ulvenhout or the top 10 real estate agents in Ulvenhout for extra context for your choice.
By comparing brokers and requesting quotes
Short answers about housing prices, sold homes and comparing real estate agents in Ulvenhout.
The costs of a real estate agent in Ulvenhout vary per office, property type and sales approach. Therefore, compare multiple quotes and also look at the real estate agents in Ulvenhout to better compare rates, presentation and local experience.
On this page we currently show 33 sold houses in Ulvenhout from our selection. This helps you to better assess recent transactions and the local housing market.
Verkochte woningen in Ulvenhout geven inzicht in vraagprijzen, woningtypes en buurten waar recent transacties hebben plaatsgevonden. Vergelijk dit ook met het actuele woningaanbod in Ulvenhout om de markt beter te duiden.
Je kunt verkochte woningen gebruiken als eerste marktindicatie, maar een lokale makelaar kan beter rekening houden met afwerking, ligging, onderhoud en actuele vraag in Ulvenhout.
Vergelijk makelaars in Ulvenhout op lokale verkoopervaring, reviews, verwachte opbrengst, courtage en marketingaanpak. De top 10 makelaars in Ulvenhout helpt om snel sterke kantoren te ontdekken.
View current location data on residents, WOZ development, housing stock, energy consumption, business activity and safety in Ulvenhout. In 2025 were there 4.915 residents. The average WOZ value in 2025 is EUR 631.000.
These figures help to better assess and compare the housing stock in Ulvenhout with recent sold homes. Orient yourself then on suitable top real estate agents in Ulvenhout for sales advice in this region.
Residents
4.915
Last year: 2025
Average WOZ
EUR 631.000
Last year: 2025
Average income per person.
EUR 45.100
Source: AllNumbers
Crimes (current year)
140
Total registered
| Year | Residents |
|---|---|
| 2021 | 4.995 |
| 2022 | 5.030 |
| 2023 | 5.020 |
| 2024 | 4.950 |
| 2025 | 4.915 |
| Year | Average WOZ |
|---|---|
| 2021 | EUR 488.000 |
| 2022 | EUR 518.000 |
| 2023 | EUR 584.000 |
| 2024 | EUR 603.000 |
| 2025 | EUR 631.000 |
Hoger
1.750
Praktisch
460
Middelbaar
1.110
Europa
420
Nederland
4.105
Buiten Europa
390
Label C
493
Label A
420
Label D
367
Label B
358
Label F
258
Label E
134
Label G
121
Label A+++
70
Label A+
44
Label A++
18
Label A++++
1
Label A+++++
0
| Year | Gas (m3) | Electricity (kWh) |
|---|---|---|
| 2020 | 1.630 | 3.520 |
| 2021 | 1.840 | 3.620 |
| 2022 | 1.430 | 3.390 |
| 2023 | 1.210 | 3.200 |
| 2024 | 1.190 | 3.330 |
Hoekwoning
Gas: 1.100 • Electricity: 2.850
Huurwoning
Gas: 790 • Electricity: 2.050
Koopwoning
Gas: 1.340 • Electricity: 3.570
Appartement
Gas: 620 • Electricity: 1.880
Tussenwoning
Gas: 980 • Electricity: 2.780
Vrijstaande woning
Gas: 1.650 • Electricity: 4.220
Twee-onder-één-kap woning
Gas: 1.230 • Electricity: 3.230
Total number of company establishments: 825
| Period | Crimes |
|---|---|
| jan 2026 | 8 |
| jul 2025 | 10 |
| jun 2025 | 10 |
| mei 2025 | 8 |
| mrt 2025 | 17 |
| mrt 2026 | 6 |
| nov 2024 | 11 |
| nov 2025 | 16 |
| okt 2024 | 11 |
| okt 2025 | 14 |
| sep 2024 | 14 |
| sep 2025 | 14 |
These figures give an indicative picture of safety trends in the living environment of Ulvenhout.
Short answers based on current local statistics, handy for a quick comparison of the living environment.
Ulvenhout telt in 2025 ongeveer 4.915 inwoners.
De gemiddelde WOZ-waarde in Ulvenhout is in 2025 circa € 631.000.
Het gemiddelde inkomen per inwoner in Ulvenhout ligt rond € 45.100 per jaar.
Voor het huidige jaar gaat het om ongeveer 140 geregistreerde misdrijven. Gebruik deze cijfers als indicatie en vergelijk trends per periode.
In Ulvenhout komt vooral "Vrijstaande woningen" veel voor, met ongeveer 646 woningen.