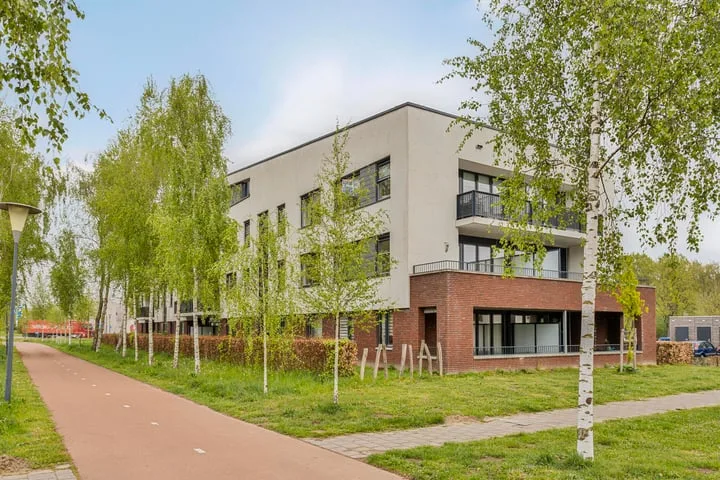
- Sold
Biezenkuilen 79
5502PB Veldhoven
€ 475.000 k.k.
€ 4.025/m²
- Living area
- 118 m²
- Land area
- 189 m²
- Bedrooms
- 4
View 497 sold houses in Veldhoven
Type to search. Use arrow down and arrow up to navigate through results and press Enter to open.
Hidden search suggestions.
Compare sold homes in Veldhoven or view the current offering in this location directly.
On this page you will find recently sold homes in Veldhoven. Use this overview to better estimate selling prices, popular neighborhoods, and the local housing supply before you choose a real estate agent. Also view the current housing supply with 747 houses in Veldhoven.
5502PB Veldhoven
€ 475.000 k.k.
€ 4.025/m²
5503XR Veldhoven
€ 400.000 k.k.
€ 4.545/m²
5509NG Veldhoven
€ 1.350.000 k.k.
€ 5.844/m²
5501JD Veldhoven
€ 382.500 k.k.
€ 3.984/m²
5508DN Veldhoven
€ 450.000 k.k.
€ 4.054/m²
5502TH Veldhoven
€ 575.000 k.k.
€ 4.049/m²
5503EE Veldhoven
€ 450.000 k.k.
€ 4.455/m²
5508DZ Veldhoven
€ 590.000 k.k.
€ 4.720/m²
5508KC Veldhoven
€ 698.000 k.k.
€ 4.813/m²
5507RK Veldhoven
€ 925.000 k.k.
€ 4.404/m²
5507NX Veldhoven
€ 875.000 k.k.
€ 3.923/m²
5505RG Veldhoven
€ 479.000 k.k.
€ 3.713/m²
5508LR Veldhoven
€ 375.000 k.k.
€ 4.870/m²
5501GC Veldhoven
€ 450.000 k.k.
€ 4.591/m²
5501DL Veldhoven
€ 395.000 k.k.
€ 3.872/m²
5508KC Veldhoven
€ 685.000 k.k.
€ 4.892/m²
5502BE Veldhoven
€ 519.000 k.k.
€ 4.942/m²
5507LC Veldhoven
€ 775.000 k.k.
€ 3.638/m²
5503EE Veldhoven
€ 389.000 k.k.
€ 3.969/m²
5509RD Veldhoven
€ 392.500 k.k.
€ 5.946/m²
5503PW Veldhoven
€ 410.000 k.k.
€ 6.029/m²
Get free quotes from realtors with local market knowledge in Veldhoven.
Selling a home in Veldhoven? Compare real estate agents who know the local housing market. Also check out all real estate agents in Veldhoven or the top 10 real estate agents in Veldhoven for extra context for your choice.
By comparing brokers and requesting quotes
Short answers about housing prices, sold homes and comparing real estate agents in Veldhoven.
The costs of a real estate agent in Veldhoven vary per office, property type and sales approach. Therefore, compare multiple quotes and also look at the real estate agents in Veldhoven to better compare rates, presentation and local experience.
On this page we currently show 497 sold houses in Veldhoven from our selection. This helps you to better assess recent transactions and the local housing market.
Houses sold in Veldhoven give insight into asking prices, house types and neighborhoods where recent transactions have taken place. Compare this also with the current housing stock in Veldhoven to better understand the market.
You can use sold homes as a first market indication, but a local real estate agent can better take into account finishing, location, maintenance and current demand in Veldhoven.
Compare realtors in Veldhoven on local sales experience, reviews, expected yield, commission and marketing approach. The top 10 realtors in Veldhoven helps to quickly discover strong offices.
View current location data on residents, WOZ development, housing stock, energy consumption, business activity and safety in Veldhoven. In 2026 were there 47.902 residents. The average WOZ value in 2025 is EUR 480.000.
These figures help to better assess and compare the housing stock in Veldhoven with recent sold homes. Orient yourself then on suitable top real estate agents in Veldhoven for sales advice in this region.
Residents
47.902
Last year: 2026
Average WOZ
EUR 480.000
Last year: 2025
Average income per person.
EUR 38.300
Source: AllNumbers
Crimes (current year)
1.512
Total registered
| Year | Residents |
|---|---|
| 2022 | 45.822 |
| 2023 | 46.417 |
| 2024 | 46.827 |
| 2025 | 47.601 |
| 2026 | 47.902 |
| Year | Average WOZ |
|---|---|
| 2021 | EUR 346.000 |
| 2022 | EUR 375.000 |
| 2023 | EUR 441.000 |
| 2024 | EUR 459.000 |
| 2025 | EUR 480.000 |
Hoger
38
Praktisch
23
Middelbaar
39
Europa
4.601
Nederland
35.250
Buiten Europa
7.750
Label C
6.357
Label A
5.181
Label B
4.371
Label D
1.621
Label E
1.042
Label F
973
Label A++++
703
Label A+++
659
Label G
550
Label A+
491
Label A++
278
Label A+++++
17
| Year | Gas (m3) | Electricity (kWh) |
|---|---|---|
| 2020 | 1.240 | 3.070 |
| 2021 | 1.380 | 3.100 |
| 2022 | 1.080 | 2.870 |
| 2023 | 910 | 2.700 |
| 2024 | 880 | 2.780 |
Hoekwoning
Gas: 960 • Electricity: 2.730
Huurwoning
Gas: 690 • Electricity: 1.990
Koopwoning
Gas: 1.020 • Electricity: 3.050
Appartement
Gas: 540 • Electricity: 1.820
Tussenwoning
Gas: 830 • Electricity: 2.500
Vrijstaande woning
Gas: 1.410 • Electricity: 4.000
Twee-onder-één-kap woning
Gas: 1.140 • Electricity: 3.260
Total number of company establishments: 5.395
| Period | Crimes |
|---|---|
| jan 2025 | 130 |
| jan 2026 | 96 |
| jul 2025 | 118 |
| jun 2025 | 118 |
| mei 2025 | 144 |
| mrt 2025 | 156 |
| nov 2024 | 126 |
| nov 2025 | 102 |
| okt 2024 | 158 |
| okt 2025 | 134 |
| sep 2024 | 115 |
| sep 2025 | 132 |
These figures give an indicative picture of safety trends in the living environment of Veldhoven.
Short answers based on current local statistics, handy for a quick comparison of the living environment.
Veldhoven telt in 2026 ongeveer 47.902 inwoners.
De gemiddelde WOZ-waarde in Veldhoven is in 2025 circa € 480.000.
Het gemiddelde inkomen per inwoner in Veldhoven ligt rond € 38.300 per jaar.
Voor het huidige jaar gaat het om ongeveer 1.512 geregistreerde misdrijven. Gebruik deze cijfers als indicatie en vergelijk trends per periode.
In Veldhoven komt vooral "Tussenwoningen" veel voor, met ongeveer 7.930 woningen.