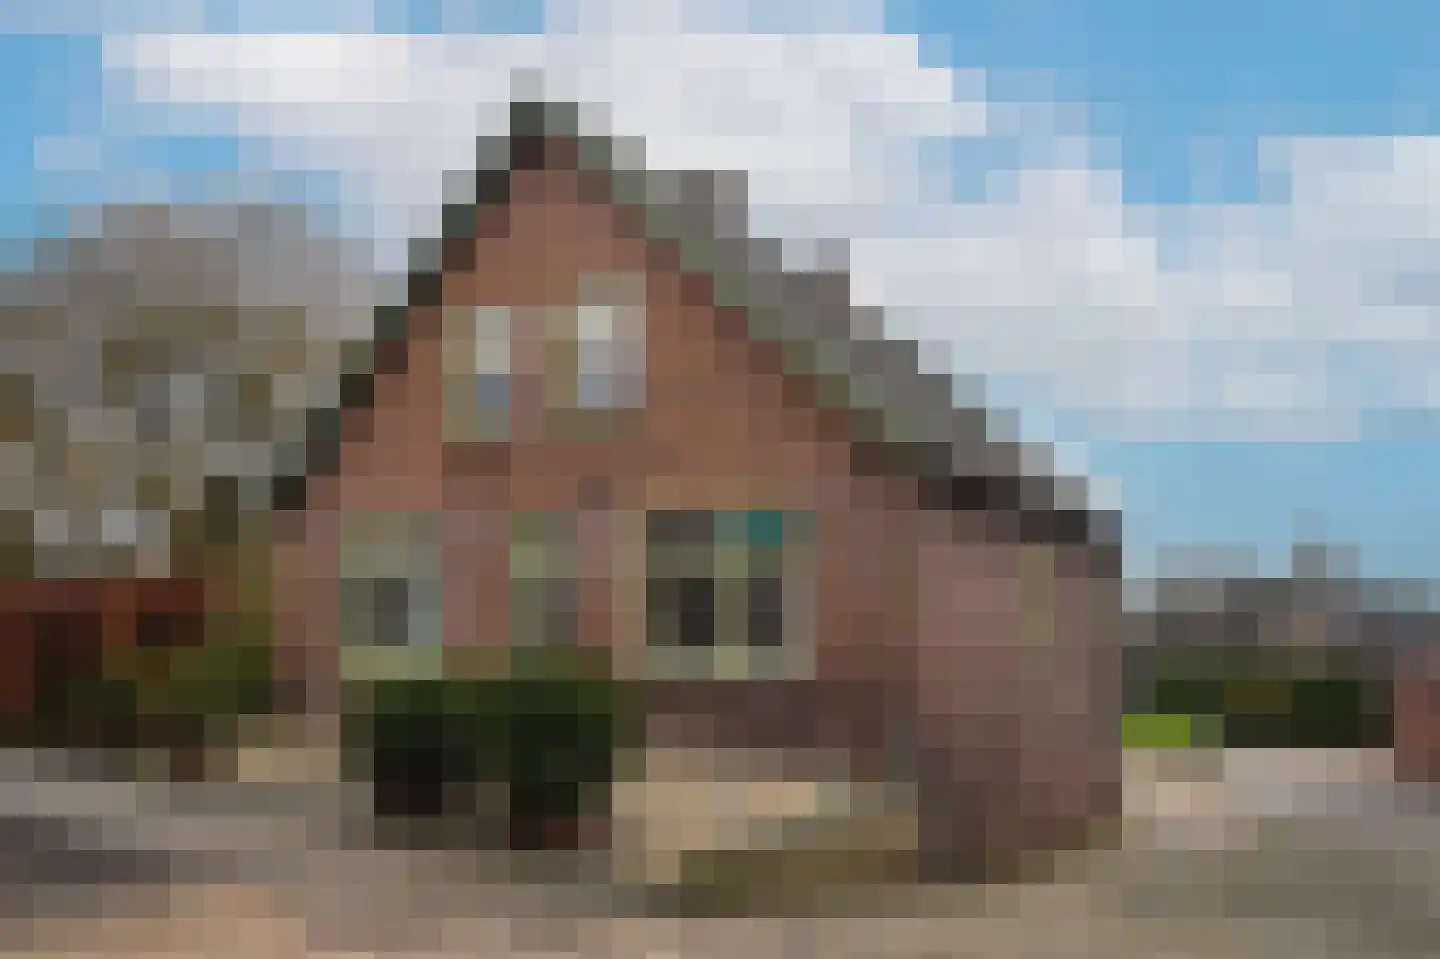
Houses sold in Wamel

View 23 sold houses in Wamel

Connected to: Vastgoed Nederland NVM Makelaars

On this page you will find recently sold homes in Wamel. Use this overview to better estimate selling prices, popular neighborhoods, and the local housing supply before you choose a real estate agent. Also view the current housing supply with 38 houses in Wamel.

Selection

Search and filter homes

Set your preferences and discover homes that suit you.

Total supply 242.655
Filters

Set price, area and other characteristics. Adjust a filter or click on Show homes. Location changes directly above.

Reset filters

You search for

  • Place Wamel
  • Status Sold

Sell your house in Wamel? Compare real estate agents

View recent sales and receive free quotes from local real estate agents. Compare more than 23 real estate agents in Wamel.

Free request a quote

  • Quotes in Wamel
  • Non-binding
  • Personal
  • Compare free rates

Selling your own home in Wamel? Compare real estate agents in Wamel or view the best real estate agents in Wamel as a reference for your choice.

Compare multiple quotes

Real estate agents make sharper offers when they know you're comparing — ask for quotes for sale or purchase.

Frequently asked questions about sold homes in Wamel

Short answers about housing prices, sold homes and comparing real estate agents in Wamel.

Residential and neighborhood statistics in Wamel

View current location data on residents, WOZ development, housing stock, energy consumption, business activity and safety in Wamel. In 2026 were there 2.690 residents. The average WOZ value in 2025 is EUR 429.000.

These figures help to better assess and compare the housing stock in Wamel with recent sold homes. Orient yourself then on suitable top real estate agents in Wamel for sales advice in this region.

Residents

2.690

Last year: 2026

Average WOZ

EUR 429.000

Last year: 2025

Average income per person.

EUR 34.500

Source: AllNumbers

Crimes (current year)

52

Total registered

Demographics and WOZ development

Inhabitants per year

Inhabitants per year in Wamel
Year Residents
2021 2.470
2022 2.475
2023 2.555
2024 2.585
2025 2.700
2026 2.690

Annual WOZ value

WOZ value per year in Wamel
Year Average WOZ
2021 EUR 295.000
2022 EUR 327.000
2023 EUR 387.000
2024 EUR 394.000
2025 EUR 429.000

Composition of residents

Age build-up

65+: 570 0-15: 430 15-25: 265 25-45: 680 45-65: 755

Education level

Hoger

570

Praktisch

510

Middelbaar

980

Origin of residents (2025)

Europa

185

Nederland

2.350

Buiten Europa

170

Housing stock and construction periods

Types of homes

Hoekwoningen 151
Appartementen 156
Tussenwoningen 194
Vrijstaande woningen 408
Twee-onder-één-kap woningen 242

Construction period of buildings

Voor 1700 5
1700 tot 1900 70
1900 tot 1925 60
1925 tot 1950 135
1950 tot 1970 212
1970 tot 1980 187
1980 tot 1990 89
1990 tot 2000 89
2000 tot 2010 87
2010 tot 2020 69
2020 en later 90

Energy and sustainability

Energy label distribution

Label C

254

Label A

225

Label G

155

Label B

122

Label D

105

Label A+++

90

Label F

82

Label E

37

Label A+

7

Label A++

4

Label A++++

4

Label A+++++

0

Average energy consumption per year

Average energy consumption per year in Wamel
Year Gas (m3) Electricity (kWh)
2020 1.500 3.390
2021 1.690 3.460
2022 1.260 3.260
2023 1.020 3.140
2024 930 3.230

Consumption per house type

Hoekwoning

Gas: 910 • Electricity: 2.390

Huurwoning

Gas: 710 • Electricity: 2.090

Koopwoning

Gas: 1.130 • Electricity: 3.500

Appartement

Gas: 700 • Electricity: 2.040

Tussenwoning

Gas: 710 • Electricity: 2.420

Vrijstaande woning

Gas: 1.290 • Electricity: 3.990

Twee-onder-één-kap woning

Gas: 1.010 • Electricity: 3.210

Business activity in Wamel (2025)

Handel en HORECA 40
Nijverheid en energie 55
Zakelijke dienstverlening 80
Overheid, onderwijs en zorg 70
Landbouw, bosbouw en visserij 35
Vervoer, informatie en communicatie 20
Financiele diensten en onroerendgoed 5
Cultuur, recreatie en overige diensten 50

Total number of company establishments: 355

Recent crime statistics

Recent crime statistics in Wamel
Period Crimes
jan 2026 5
jul 2025 8
jun 2025 3
mei 2025 3
mrt 2025 3
mrt 2026 0
nov 2024 6
nov 2025 4
okt 2024 3
okt 2025 2
sep 2024 2
sep 2025 5

These figures give an indicative picture of safety trends in the living environment of Wamel.

Frequently asked questions about living in Wamel

Short answers based on current local statistics, handy for a quick comparison of the living environment.

Hoeveel inwoners heeft Wamel?

Wamel telt in 2026 ongeveer 2.690 inwoners.

Wat is de gemiddelde WOZ-waarde in Wamel?

De gemiddelde WOZ-waarde in Wamel is in 2025 circa € 429.000.

Wat is het gemiddelde inkomen per inwoner in Wamel?

Het gemiddelde inkomen per inwoner in Wamel ligt rond € 34.500 per jaar.

Hoe veilig is wonen in Wamel?

Voor het huidige jaar gaat het om ongeveer 52 geregistreerde misdrijven. Gebruik deze cijfers als indicatie en vergelijk trends per periode.

Welke woningtypen komen het meest voor in Wamel?

In Wamel komt vooral "Vrijstaande woningen" veel voor, met ongeveer 408 woningen.

Receive free, non-binding quotes

Compare multiple real estate agents and choose the best match.