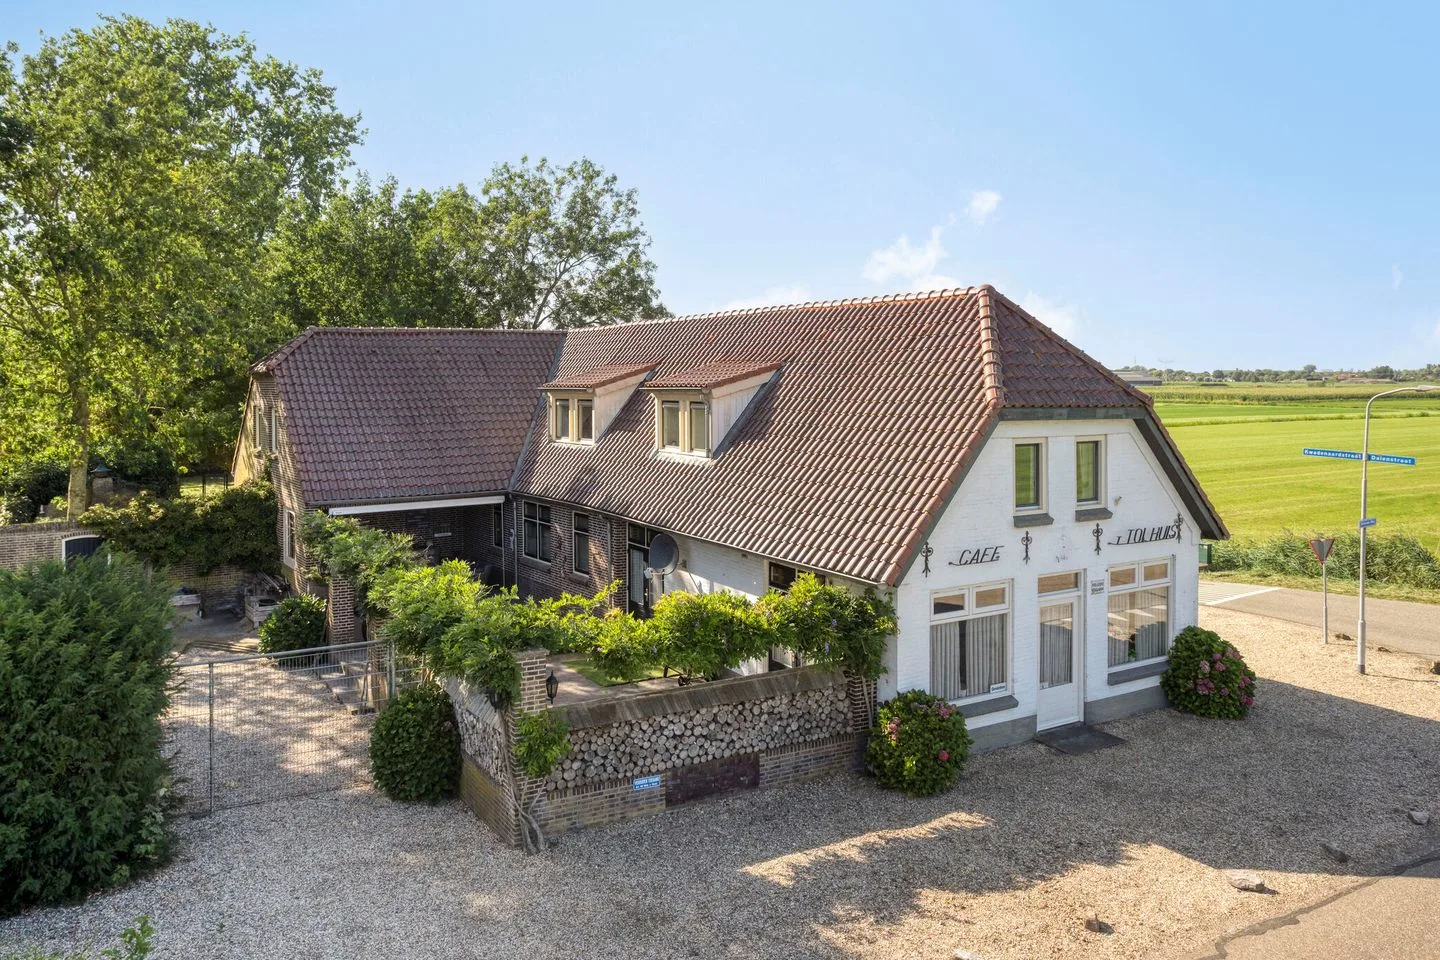
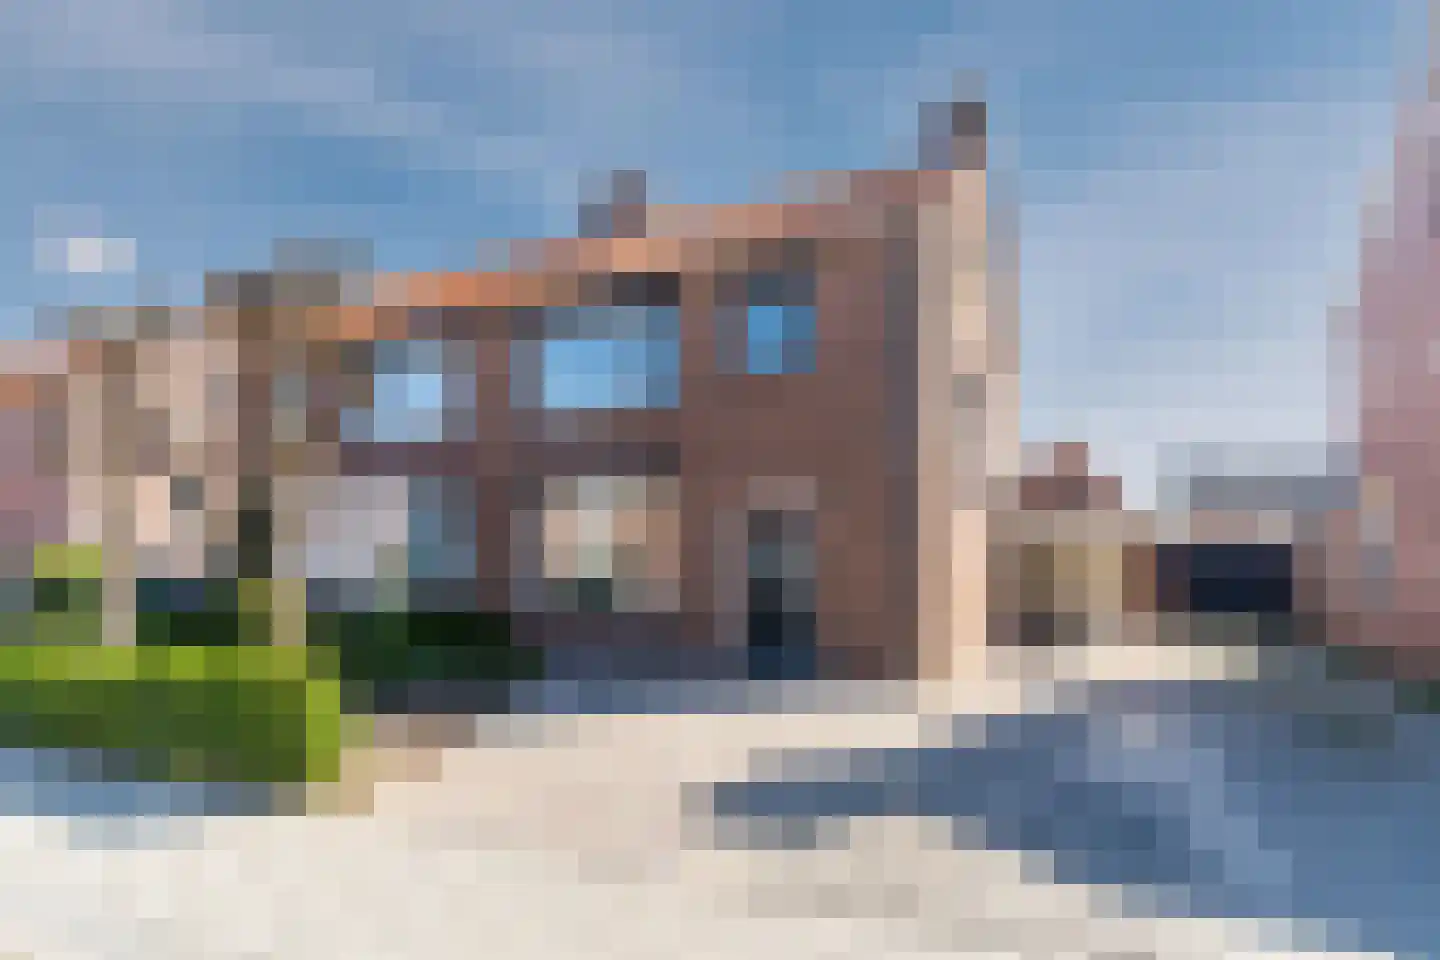
- Available
Industriestraat 14
6659AL Wamel
€ 500.000 k.k.
€ 3.067/m²
- Living area
- 163 m²
- Land area
- 1059 m²
- Bedrooms
- 4
Searching in 38 houses in Wamel
Type to search. Use arrow down and arrow up to navigate through results and press Enter to open.
Hidden search suggestions.
View current properties in Wamel or search targeted on street, postal code and property characteristics.
View the current housing stock in Wamel and quickly filter by price, living area, rooms and more. There are currently 38 houses in this place within our selection. View also 23 sold houses in Wamel for extra insight into the local housing market.
6659AL Wamel
€ 500.000 k.k.
€ 3.067/m²
6659CC Wamel
€ 675.000 k.k.
€ 6.027/m²
6659CH Wamel
€ 650.000 k.k.
€ 4.452/m²
6659CS Wamel
€ 395.000 k.k.
€ 3.835/m²
6659KL Wamel
€ 895.000 k.k.
€ 2.878/m²
6659BR Wamel
€ 595.000 k.k.
€ 2.306/m²
6659CC Wamel
€ 350.000 k.k.
€ 4.321/m²
6659CP Wamel
€ 419.000 k.k.
6659AH Wamel
€ 465.000 k.k.
6659AS Wamel
€ 420.000 k.k.
€ 4.719/m²
6659CP Wamel
€ 735.000 k.k.
€ 2.838/m²
6659CG Wamel
€ 450.000 k.k.
€ 2.239/m²
6659BW Wamel
€ 379.000 k.k.
€ 3.384/m²
6659BW Wamel
€ 650.000 k.k.
€ 1.260/m²
6659BA Wamel
€ 750.000 k.k.
€ 3.676/m²
6659CG Wamel
€ 350.000 k.k.
€ 3.271/m²
6659CC Wamel
€ 500.000 k.k.
€ 2.778/m²
6659CT Wamel
€ 375.000 k.k.
€ 2.952/m²
6659BS Wamel
€ 400.000 k.k.
€ 3.418/m²
6659BN Wamel
€ 589.000 k.k.
€ 3.613/m²
6659CT Wamel
€ 625.000 k.k.
€ 4.340/m²
6659BR Wamel
€ 389.000 k.k.
€ 4.138/m²
6659BJ Wamel
€ 625.000 k.k.
€ 3.094/m²
6659CP Wamel
€ 695.000 k.k.
€ 3.492/m²
6659AR Wamel
€ 625.000 k.k.
€ 4.882/m²
6659BT Wamel
€ 569.000 k.k.
€ 3.289/m²
6659EE Wamel
€ 375.000 k.k.
€ 3.826/m²
6659CX Wamel
€ 465.000 k.k.
€ 3.120/m²
Get free quotes from real estate agents with local market knowledge. Compare more than 23 real estate agents in Wamel.
Selling a home in Wamel? Compare all real estate agents in Wamel or view the top 10 real estate agents in Wamel for extra context for your choice.
Real estate agents make sharper offers when they know you're comparing — ask for quotes for sale or purchase.
Practical answers about housing supply, sales and comparing real estate agents in Wamel.
The costs of a real estate agent in Wamel depend on commission, setup costs, property presentation and the chosen service. Compare the 23 real estate agents in Wamel via the real estate agent page and request multiple quotes to compare rates and approach well.
Within our selection, we are currently showing 38 houses in Wamel. View also the sold houses in Wamel to compare the current offering with recent transactions.
Take into account not only price and living area but also maintenance, energy label, location, outdoor space and sales status. This way you compare houses in Wamel on more than just the asking price.
A local real estate agent knows the neighborhoods, recent transactions and demand in Wamel. By comparing 23 real estate agents in the region you get a better insight into prices, sales strategy and expected yield; the top 10 in Wamel provides a useful starting point.
Yes, when making a sales plan, a valuation in Wamel is wise. You gain insight into a realistic asking price and can then compare offers from real estate agents specifically.
View current location data on residents, WOZ development, housing stock, energy consumption, business activity and safety in Wamel. In 2026 were there 2.690 residents. The average WOZ value in 2025 is EUR 429.000.
These figures help to better assess and compare the housing stock in Wamel with recent sold homes. Orient yourself then on suitable top real estate agents in Wamel for sales advice in this region.
Residents
2.690
Last year: 2026
Average WOZ
EUR 429.000
Last year: 2025
Average income per person.
EUR 34.500
Source: AllNumbers
Crimes (current year)
52
Total registered
| Year | Residents |
|---|---|
| 2021 | 2.470 |
| 2022 | 2.475 |
| 2023 | 2.555 |
| 2024 | 2.585 |
| 2025 | 2.700 |
| 2026 | 2.690 |
| Year | Average WOZ |
|---|---|
| 2021 | EUR 295.000 |
| 2022 | EUR 327.000 |
| 2023 | EUR 387.000 |
| 2024 | EUR 394.000 |
| 2025 | EUR 429.000 |
Hoger
570
Praktisch
510
Middelbaar
980
Europa
185
Nederland
2.350
Buiten Europa
170
Label C
254
Label A
225
Label G
155
Label B
122
Label D
105
Label A+++
90
Label F
82
Label E
37
Label A+
7
Label A++
4
Label A++++
4
Label A+++++
0
| Year | Gas (m3) | Electricity (kWh) |
|---|---|---|
| 2020 | 1.500 | 3.390 |
| 2021 | 1.690 | 3.460 |
| 2022 | 1.260 | 3.260 |
| 2023 | 1.020 | 3.140 |
| 2024 | 930 | 3.230 |
Hoekwoning
Gas: 910 • Electricity: 2.390
Huurwoning
Gas: 710 • Electricity: 2.090
Koopwoning
Gas: 1.130 • Electricity: 3.500
Appartement
Gas: 700 • Electricity: 2.040
Tussenwoning
Gas: 710 • Electricity: 2.420
Vrijstaande woning
Gas: 1.290 • Electricity: 3.990
Twee-onder-één-kap woning
Gas: 1.010 • Electricity: 3.210
Total number of company establishments: 355
| Period | Crimes |
|---|---|
| jan 2026 | 5 |
| jul 2025 | 8 |
| jun 2025 | 3 |
| mei 2025 | 3 |
| mrt 2025 | 3 |
| mrt 2026 | 0 |
| nov 2024 | 6 |
| nov 2025 | 4 |
| okt 2024 | 3 |
| okt 2025 | 2 |
| sep 2024 | 2 |
| sep 2025 | 5 |
These figures give an indicative picture of safety trends in the living environment of Wamel.
Short answers based on current local statistics, handy for a quick comparison of the living environment.
Wamel telt in 2026 ongeveer 2.690 inwoners.
De gemiddelde WOZ-waarde in Wamel is in 2025 circa € 429.000.
Het gemiddelde inkomen per inwoner in Wamel ligt rond € 34.500 per jaar.
Voor het huidige jaar gaat het om ongeveer 52 geregistreerde misdrijven. Gebruik deze cijfers als indicatie en vergelijk trends per periode.
In Wamel komt vooral "Vrijstaande woningen" veel voor, met ongeveer 408 woningen.