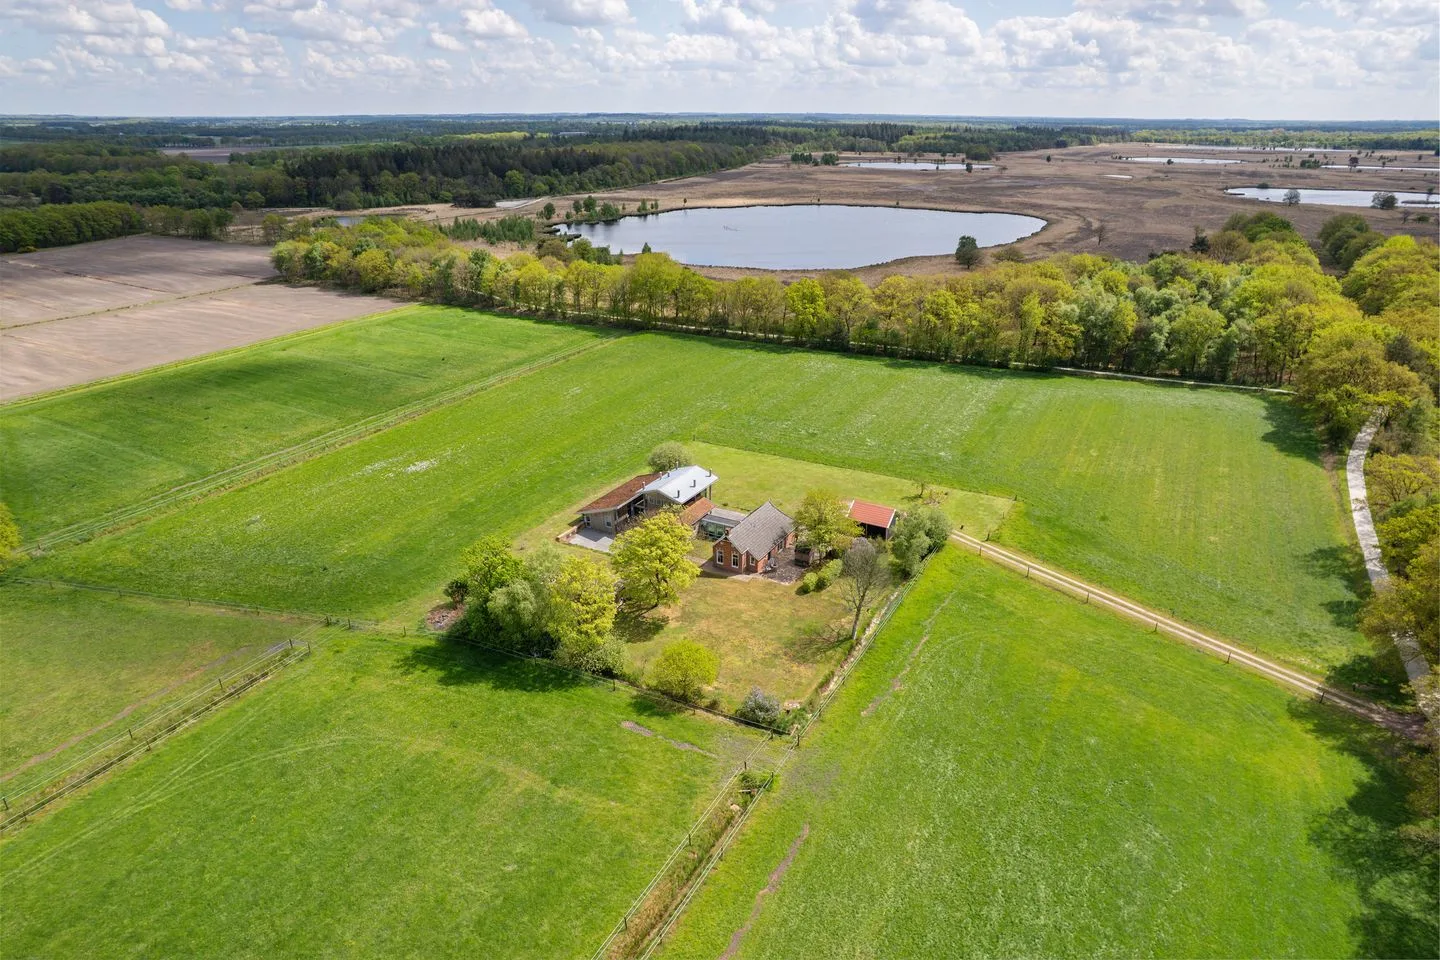
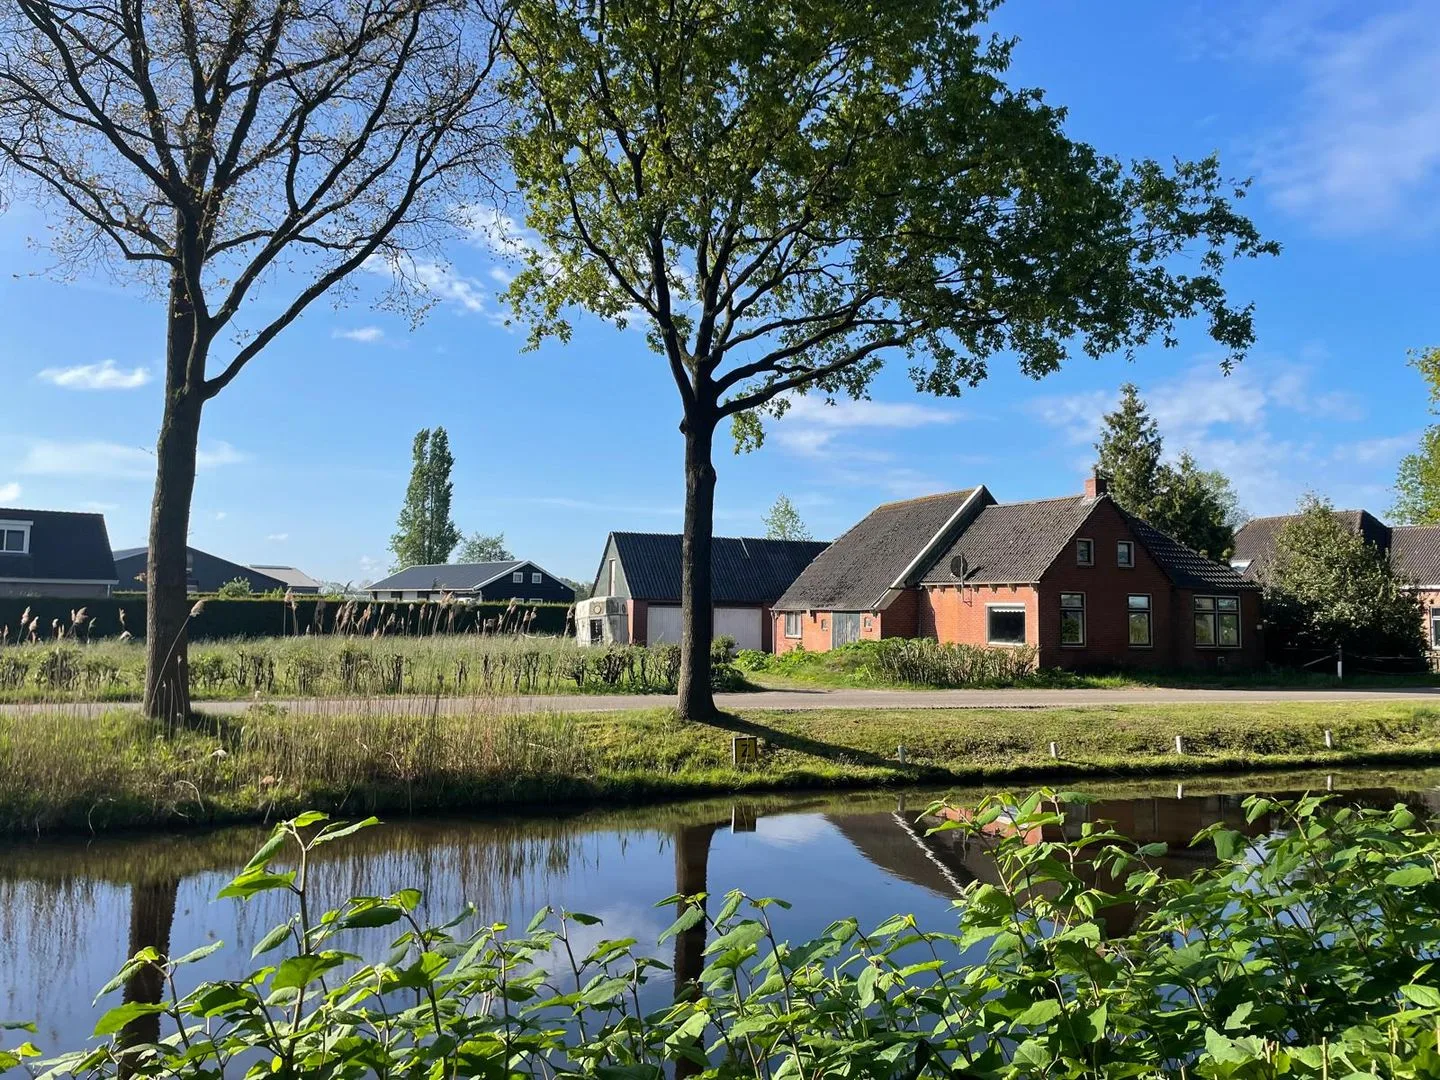
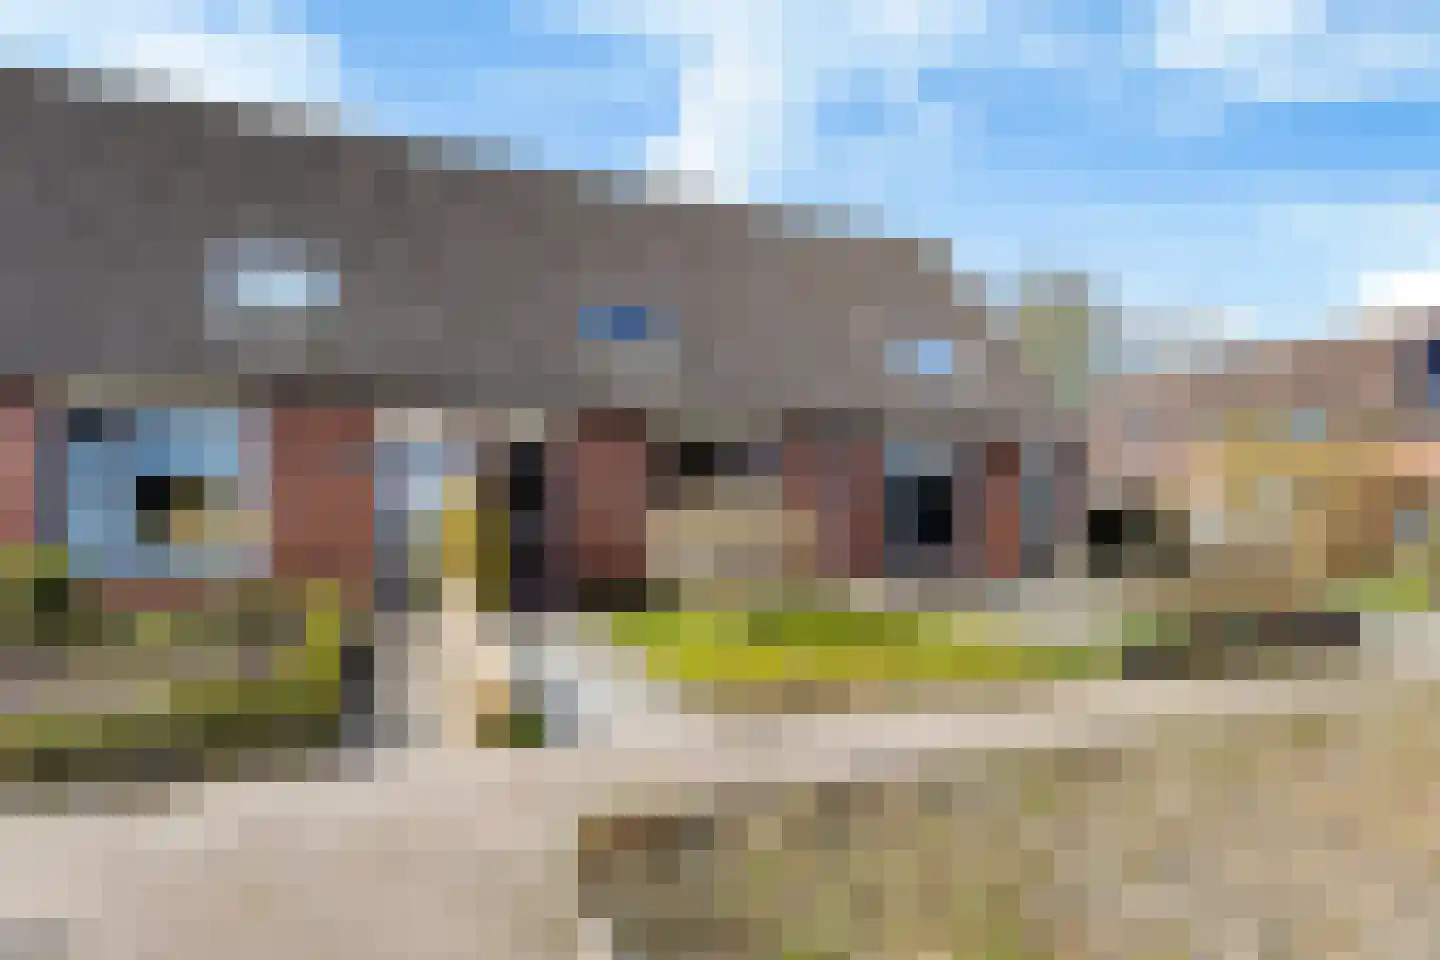
- Available
Weinterp 64
9241HE Wijnjewoude
€ 425.000 k.k.
€ 4.620/m²
- Living area
- 92 m²
- Land area
- 7649 m²
- Bedrooms
- 3
Searching in 23 houses in Wijnjewoude
Type to search. Use arrow down and arrow up to navigate through results and press Enter to open.
Hidden search suggestions.
View current properties in Wijnjewoude or search targeted on street, postal code and property characteristics.
View the current housing stock in Wijnjewoude and quickly filter by price, living area, rooms and more. There are currently 23 houses in this place within our selection. View also 11 sold houses in Wijnjewoude for extra insight into the local housing market.
9241HE Wijnjewoude
€ 425.000 k.k.
€ 4.620/m²
9241HM Wijnjewoude
€ 695.000 k.k.
€ 4.696/m²
9241WP Wijnjewoude
€ 1.995.000 k.k.
€ 7.615/m²
9241HB Wijnjewoude
€ 449.500 k.k.
€ 3.978/m²
9241HR Wijnjewoude
€ 550.000 k.k.
€ 3.459/m²
9241GC Wijnjewoude
€ 400.000 k.k.
€ 3.810/m²
9241HM Wijnjewoude
€ 335.000 k.k.
€ 2.991/m²
9241EL Wijnjewoude
€ 539.000 k.k.
9241WC Wijnjewoude
€ 595.000 k.k.
€ 4.917/m²
9241EE Wijnjewoude
€ 239.000 k.k.
€ 3.319/m²
9241GL Wijnjewoude
€ 399.950
€ 3.703/m²
9241GL Wijnjewoude
€ 399.950
€ 3.773/m²
9241EG Wijnjewoude
€ 325.000 k.k.
€ 3.571/m²
9241EA Wijnjewoude
€ 379.000 k.k.
€ 3.267/m²
9241EA Wijnjewoude
€ 425.000 k.k.
€ 2.544/m²
9241GT Wijnjewoude
€ 276.000 k.k.
€ 2.905/m²
9241GJ Wijnjewoude
Price upon request
9241GN Wijnjewoude
€ 425.000 k.k.
€ 5.059/m²
9241HK Wijnjewoude
Price upon request
9241HB Wijnjewoude
€ 635.000 k.k.
€ 3.919/m²
9241GS Wijnjewoude
€ 350.000 k.k.
€ 4.166/m²
9241GH Wijnjewoude
€ 365.000 k.k.
€ 0/m²
9241EG Wijnjewoude
€ 435.000 k.k.
€ 3.655/m²
Get free quotes from real estate agents with local market knowledge. Compare more than 32 real estate agents in Wijnjewoude.
Selling a home in Wijnjewoude? Compare all real estate agents in Wijnjewoude or view the top 10 real estate agents in Wijnjewoude for extra context for your choice.
Real estate agents make sharper offers when they know you're comparing — ask for quotes for sale or purchase.
Practical answers about housing supply, sales and comparing real estate agents in Wijnjewoude.
The costs of a real estate agent in Wijnjewoude depend on commission, setup costs, property presentation and the chosen service. Compare the 32 real estate agents in Wijnjewoude via the real estate agent page and request multiple quotes to compare rates and approach well.
Within our selection, we are currently showing 23 houses in Wijnjewoude. View also the sold houses in Wijnjewoude to compare the current offering with recent transactions.
Take into account not only price and living area but also maintenance, energy label, location, outdoor space and sales status. This way you compare houses in Wijnjewoude on more than just the asking price.
A local real estate agent knows the neighborhoods, recent transactions and demand in Wijnjewoude. By comparing 32 real estate agents in the region you get a better insight into prices, sales strategy and expected yield; the top 10 in Wijnjewoude provides a useful starting point.
Yes, when making a sales plan, a valuation in Wijnjewoude is wise. You gain insight into a realistic asking price and can then compare offers from real estate agents specifically.
View current location data on residents, WOZ development, housing stock, energy consumption, business activity and safety in Wijnjewoude. In 2026 were there 2.068 residents. The average WOZ value in 2025 is EUR 357.000.
These figures help to better assess and compare the housing stock in Wijnjewoude with recent sold homes. Orient yourself then on suitable top real estate agents in Wijnjewoude for sales advice in this region.
Residents
2.068
Last year: 2026
Average WOZ
EUR 357.000
Last year: 2025
Average income per person.
EUR 28.100
Source: AllNumbers
Crimes (current year)
28
Total registered
| Year | Residents |
|---|---|
| 2021 | 2.055 |
| 2022 | 2.055 |
| 2023 | 2.130 |
| 2024 | 2.105 |
| 2025 | 2.075 |
| 2026 | 2.068 |
| Year | Average WOZ |
|---|---|
| 2021 | EUR 269.000 |
| 2022 | EUR 295.000 |
| 2023 | EUR 340.000 |
| 2024 | EUR 348.000 |
| 2025 | EUR 357.000 |
Hoger
400
Praktisch
420
Middelbaar
740
Europa
40
Nederland
1.920
Buiten Europa
115
Label G
206
Label C
165
Label A
149
Label B
146
Label D
87
Label F
51
Label E
34
Label A+
24
Label A++
7
Label A+++
4
Label A++++
1
Label A+++++
0
| Year | Gas (m3) | Electricity (kWh) |
|---|---|---|
| 2020 | 1.620 | 3.110 |
| 2021 | 1.770 | 3.190 |
| 2022 | 1.360 | 2.950 |
| 2023 | 1.110 | 2.950 |
| 2024 | 1.060 | 3.120 |
Hoekwoning
Gas: 1.000 • Electricity: 2.350
Huurwoning
Gas: 990 • Electricity: 2.030
Koopwoning
Gas: 1.140 • Electricity: 3.220
Appartement
Gas: 830 • Electricity: 1.810
Tussenwoning
Gas: 880 • Electricity: 2.040
Vrijstaande woning
Gas: 1.210 • Electricity: 3.390
Twee-onder-één-kap woning
Gas: 1.000 • Electricity: 2.450
Total number of company establishments: 300
| Period | Crimes |
|---|---|
| jan 2026 | 0 |
| jul 2025 | 3 |
| jun 2025 | 4 |
| mei 2025 | 0 |
| mrt 2025 | 1 |
| mrt 2026 | 0 |
| nov 2024 | 3 |
| nov 2025 | 0 |
| okt 2024 | 5 |
| okt 2025 | 1 |
| sep 2024 | 0 |
| sep 2025 | 6 |
These figures give an indicative picture of safety trends in the living environment of Wijnjewoude.
Short answers based on current local statistics, handy for a quick comparison of the living environment.
Wijnjewoude telt in 2026 ongeveer 2.068 inwoners.
De gemiddelde WOZ-waarde in Wijnjewoude is in 2025 circa € 357.000.
Het gemiddelde inkomen per inwoner in Wijnjewoude ligt rond € 28.100 per jaar.
Voor het huidige jaar gaat het om ongeveer 28 geregistreerde misdrijven. Gebruik deze cijfers als indicatie en vergelijk trends per periode.
In Wijnjewoude komt vooral "Vrijstaande woningen" veel voor, met ongeveer 539 woningen.